#GoChain Breakout NowEntry : 0.00000166 - 0.00000146 - 0.00000131
Target 1 : 0.00000178
Target 2 : 0.00000216
Target 3 : 0.00000235
Target 4 : 0.00000324
Target 5 : 0.00000465
Stop loss : 0.00000120
Risk/Reward : 20%/215%
Do not hurry to buy, the price may go down to good places
Please share your opinion in the comments box and do not forget to press the like button
Add to watchlist
Gochainbtc


Possible breakout for GOthe price squeezed nicely with this wedge so breakout will come probably but the volume is very low and because of that the breakout might be weak but still profit opportunity looks good.
Stop level is under the wedge

GOBTC formed bullish BAT a good long opportunityPriceline of GoChain / Bitcoin has formed a bullish BAT pattern and entered in potential reversal zone.
This PRZ area should be used as stop loss, in case of complete candle stick closes below this zone.
I have used Fibonacci sequence to set the targets:
Buy between: 0.00000121 to 0.00000119
Sell between: 0.00000123 to 0.00000128
Regards,
Atif Akbar (moon333)

GoChain (Sept 28) #GO $GO #BTC $BTCBuy : Close to 110 as possible
Sell : 120-130-140
Mid-Hold : 180-220
Stop : 105

GoChain BullishNowadays, GoChain is on the end of falling wedge, where I expect breakout. It means, that our buy zone is point of breakout or double bottom. Target for falling wedge is height of start falling wedge. This height you put on point of break and it is your target. Watch out for rezistences, you can close small ammount of your position there.

Possible adam&eve formation I think there is possible adam&eve formation, risk is a bit high but profit oppotunity looks very well.
I will share the 4h chart of GO as a comment, to see the wedge with better view.

GO near important trendlineGO found support at 140 and is near the trendline covering over 3 month period (from 31/03 => 11/06 => 02/07). Doesn't mean it will change the trend, but may pump a little, unless get dumped by BTC before that.
CryptoTrades channel trade setup:
Pullback buy zone 135-140
Targets 152 - 157 - 168
HODLer's candy 179
Stop loss below 134
Stopless strategy - double at ~117-120, sell below ~140
Risk/Reward Ratio 2 / 3 / 4.6 (for main targets)

GoChain/Bitcoin (July 07) #GO $GO #BTC $BTCBuyzone : 140-145
Sellzone : 160-185
Holdzone : 340-435-1270
Stoploss : Under 135

$GO Showing some volume momentum as it bounces from ATL BTC supp$GO Showing some volume momentum as it bounces from ATL BTC support at ~125sats...
UCTS Buy signal on the 6H was printed and we may have a chance to reach resistance at ~226sats... (if btc allows it)
If taking this trade, 145/146(LH) as stop loss seems right.
#GO


GoChain/BTC Bullish ChartI am Waching Closly #Gochain.
I already bought and if more dip then I will buy more.
My Potential Buy one given in Chart.
My Target for This month are: 500/600/700 Satoshi.
In 4 hours chart Golden cross already done.

GoChain/Bitcoin (20 May) #GO $GO #BTC $BTC#BUY
GO is moving in the Falling Wedge formation and found good support at 220 and is ready to rise again with the goal of nearly 100% profit
Buyzone : buy as close to 250 as possible
Sellzone : 280-300-350-400-435
Stoploss if price is lower than 240 and consider buying back around 200-220

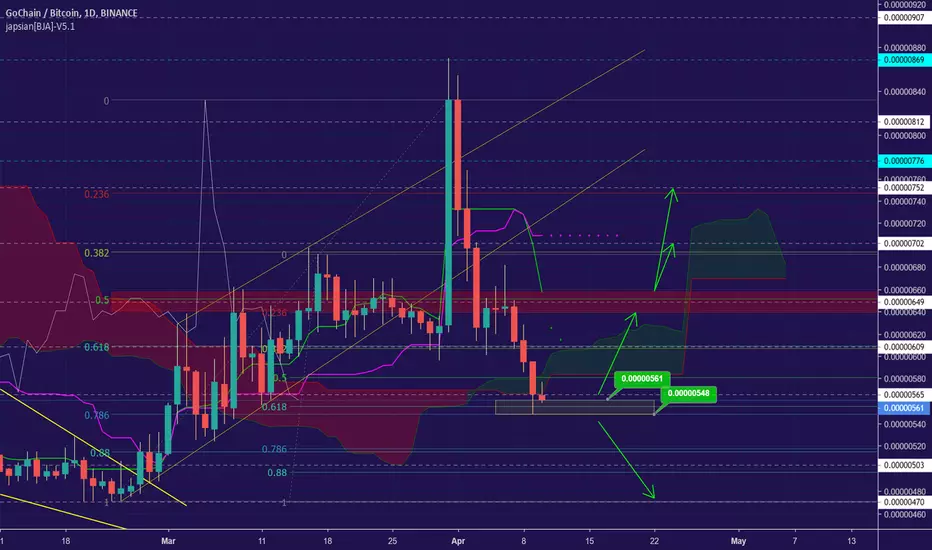
[GOBTC] GoChain TargetsBINANCE:GOBTC
Buy Zone : 0.00000520 ~ 0.00000530
Short Term
TP1 : 0.00000543
TP2 : 0.00000559
TP3 : 0.00000582
TP4 : 0.00000602
Mid-Long Term
TP1 : 0.00000676
TP2 : 0.00000747
TP3 : 0.00000820

Looking good... keeps pushing upUpdate on $GO, Looking good, Tested EMA100, did a pullback to EMA50 and bounced again with volume.
If it can break and hold above EMA100 then new local highs can be achieved.
Both RSI and MACD looking good and rising.
Potential Resistances/Targets on the chart. #GO
GoChain ready for the next step!We have potential rhythm of reversal head and shoulders pattern! volume is rising this could be breakout. Also we have touch our lowest support zone.


Daily Bullish Signal $GO #GO #GOBTC (25 March 2019)RED ARROW indicates the EXPECTED Time and Targets
Level Stoploss point up to maximize profit and reduce risk
I'm working all the time, even in Bearish Market

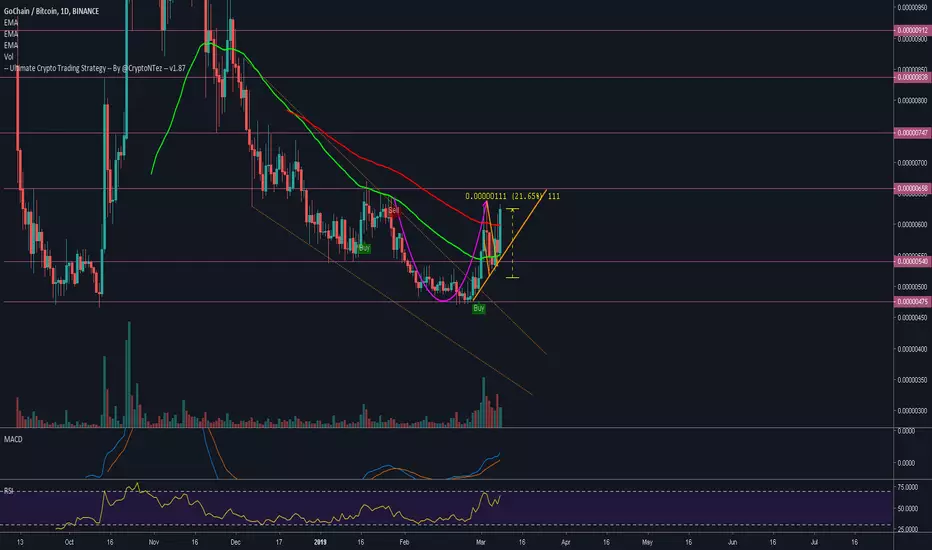
Go Gochain Chart Analysis Gochain looking Bullish from here
buy between 480-510
Target 562
Target 620
Target 700
SL 470

reaching 20% since buy signal & break from the descending channRSI reaching overbought levels & MACD rising really strong.
Current resistance at EMA100 & Ichi cloud.
Next target can be found at ~661/748sats.
If you are into this trade start adding a SL to lock profits
