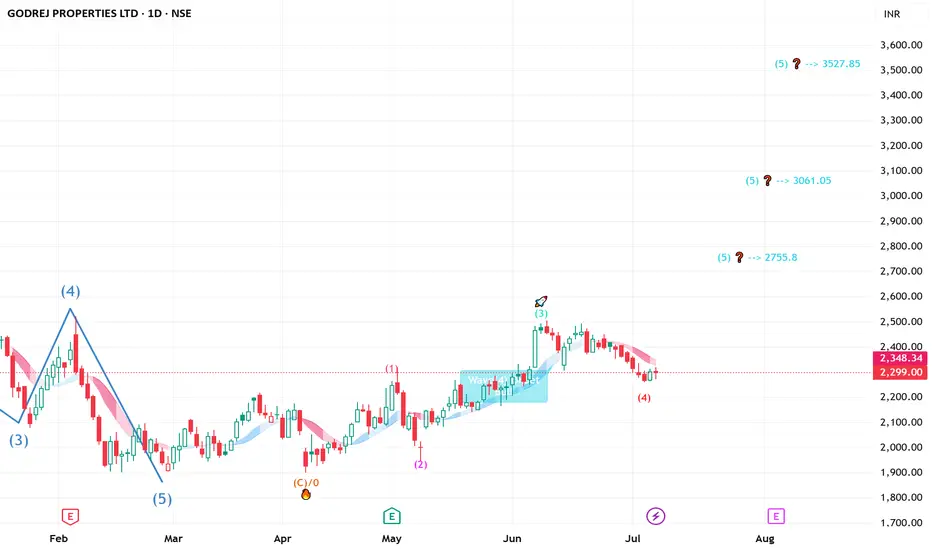
GODREJ PROPERTIES - Ready to FLY - short to long Elliot waveGODREJ PROPERTIES-----Daily counts indicate Excellent bullish wave structure.
Both appear to be optimistic and this stock invalidation number (S L) wave 2 low
target short / long term are already shared as per charts
correction wave leg seems completed
Investing in declines is a smart move for short/ long-term players.
Buy in DIPS recommended
Long-term investors prepare for strong returns over the next two to five years.
one of best counter
Every graphic used to comprehend & LEARN & understand the theory of Elliot waves, Harmonic waves, Gann Theory, and Time theory
Every chart is for educational purposes.
We have no accountability for your profit or loss.
GODREJPROP
Non-agricultural data is coming, gold trend analysis The biggest news overnight was the expected rate cut by the European Central Bank, which indicated that the European Central Bank may cut interest rates further.
Although the trade war with the United States is imminent and Europe plans to increase military spending, it has triggered the most significant economic policy shift in Europe in decades.
In addition, the number of initial jobless claims in the United States last week fell by 21,000, a larger drop than expected, suggesting that the labor market remained stable in February, but import tariffs and drastic government spending cuts will cause turbulence in the future.
In addition, the number of initial jobless claims in the United States last week fell by 21,000, a larger drop than expected, suggesting that the labor market remained stable in February, but import tariffs and drastic government spending cuts will cause turbulence in the future.
In the early morning, Federal Reserve Chairman Powell will also give a speech at the University of Chicago Booth School of Business, so everyone should pay close attention.
From the perspective of the 1-hour cycle, it is very similar to the 4-hour cycle, and it is not an exaggeration to say that it is a nested structure. The same trend line breaks down, and the same high point moves down. Again, not chasing the rise is a discipline that must be followed. Even if it breaks through 2930 today, the upper 2940--44 area will still be beaten down. So in the short term, you can short around 25. Conservative investors can wait for the release of non-agricultural data and choose the opportunity to enter the market.

47% GROWTH》GODREJPROP SHOWING A GOOD REVERSAL SIGN FROM BOTTOMRecently NSE:GODREJPROP almost drawdown 19% from recent high and we plan for almost 47% upward potentially reward.
🔔 NOTE:
➡️ ENTRY ONLY IF the weekly candle CLOSES ABOVE 2550 INR.
📊 Godrej Properties (GODREJPROP) is exhibiting a positive reversal from its bottom levels. However, ⚠️ signs of weakness remain visible.
✅ Suggestion:
Wait for a strong confirmation with the weekly close above 2550 INR to enter.
Once confirmed, bullish momentum could target long-term profits at the 3802 INR level.
🎯 TARGET LEVELS
TP-1 🟡: 2836.25 INR
TP-2 🟠: 3026.00 INR
TP-3 🟢: 3405.90 INR (50% Profit Booking Recommended Due to Resistance ⚒️)
TP-4 🟩: 3802.00 INR (Long-Term Target – 9 to 12 Months 🚀)
📉 STRICT STOP LOSS (SL):
2240.90 INR 🚫 (Ensure proper risk management here!)
⚡ Action Plan:
If entry conditions are met, follow the targets and risk levels carefully. This stock offers an excellent reward-to-risk ratio, but confirmation is key! 🕒
🔴DISCLAIMER:
I AM NOT A SEBI-REGISTERED ANALYST. SECURITIES AND INVESTMENTS ARE SUBJECT TO MARKET RISKS. PLEASE READ AND UNDERSTAND THE TRADING IDEA CAREFULLY BEFORE MAKING ANY INVESTMENT DECISIONS. INVEST WISELY AND AT YOUR OWN RISK. 📉📈
If you find this really helpful
Like,share,subscribe @Alpha_strike_trader

GODREJPROP Trading Within Fresh Demand ZoneGODREJPROP is currently trading at ₹2734.1, positioned within its fresh demand zone between ₹2737.35 and ₹2641.5, established on 22nd November 2024. This untested zone indicates potential buying interest, making it a level to watch for signs of support and possible trading opportunities.
Disclaimer: This analysis is for informational purposes only and should not be considered as financial advice. Please conduct your own research or consult a financial advisor before making any investment or trading decisions.

GODREJPROPHi guys,
In this chart i Found a Demand Zone in GODREJPROP CHART for Positional entry,
Observed these Levels based on price action and Demand & Supply.
*Don't Take any trades based on this Picture.
... because this chart is for educational purpose only not for Buy or Sell Recommendation..
Thank you

GODREJPROP Long Opportunity There is Institution buying zone if price come at that level then we can go long.
I am NOT a SEBI registered advisor or a financial adviser. Any of my investment or trade ideas I share on my profile are only my view point.

How to trade GodrejPropertiesGodrej Properties , now at 3034 on June 20-2024 ::
As per the ongoing pattern, this might probably touch the upper trendline at around 3170
Surpassing this can give a trend towards 4000
If this cannot hold 3170 after surpassing,
OF
If this falls now, then buy at around 2800-2830 levels and hold for target of 3280-3300 and thereafter it tests again if this can hold the price above the trendline.
FYI, am holding few

MACD Crossover Swing Trade📊 Script: GODREJPROP
📊 Sector: Realty
📊 Industry: Construction
⏱️ C.M.P 📑💰- 2842
🟢 Target 🎯🏆 - 3009
⚠️ Stoploss ☠️🚫 - 2756
📊 Script: ASAHIINDIA
📊 Sector: Glass & Glass Products
📊 Industry: Glass & Glass Products
⏱️ C.M.P 📑💰- 640
🟢 Target 🎯🏆 - 671
⚠️ Stoploss ☠️🚫 - 621
📊 Script: NH
📊 Sector: Healthcare
📊 Industry: Healthcare
⏱️ C.M.P 📑💰- 1265
🟢 Target 🎯🏆 - 1343
⚠️ Stoploss ☠️🚫 - 1247
📊 Script: TRITURBINE
📊 Sector: Capital Goods - Electrical Equipment
📊 Industry: Electric Equipment
⏱️ C.M.P 📑💰- 569
🟢 Target 🎯🏆 - 609
⚠️ Stoploss ☠️🚫 - 563
⚠️ Important: Always maintain your Risk & Reward Ratio.
✅Like and follow to never miss a new idea!✅
Disclaimer: I am not SEBI Registered Advisor. My posts are purely for training and educational purposes.
Eat🍜 Sleep😴 TradingView📈 Repeat 🔁
Happy learning with trading. Cheers!🥂

Keep An Eye - Cup & Hand📊 Script: GODREJPROP
📊 Sector: Realty
📊 Industry: Construction
Key highlights: 💡⚡
📈 There is formation of Cup & Hand in daily chart.
📈 Script is near the neck line of Cup & Hand It may give breakout.
📈 Keep An Eye on stock Buy Only Above 2484 level.
📈 One can go for Swing Trade Only Above 2484 level..
⏱️ C.M.P 📑💰- 2497
BUY ONLY ABOVE 2484
⚠️ Important: Always maintain your Risk & Reward Ratio.
✅Like and follow to never miss a new idea!✅
Disclaimer: I am not SEBI Registered Advisor. My posts are purely for training and educational purposes.
Eat🍜 Sleep😴 TradingView📈 Repeat 🔁
Happy learning with trading. Cheers!🥂

Godrej Properties, a leading real estateGodrej Properties, a leading real estate developer known for its commitment to quality and innovation, presents an intriguing investment opportunity. With a stop-loss set at 2400 and a target of 2750, investors can strategically position themselves in the market.

Buy Godrejpropabove 1320 tgt 1490/2300/4200 sl below 1120Company has given a good guidance for the upcoming quarters as well as the stock is about to break the sown ward channel. So currently at good accumulation point near 200 Weekly EMA which will also act as good support zone. The out look is to buy on dips and keep adding for the short and medium term outlook.

#SUNTECK 401 BUY SUNTECK RECOMMENDATION BY RACHIT SETHIA SUNTECK 401
TGT 500
SL 370
RR > 3
Timeframe < 6M
Factors: BULLISH WEDGE BREAKOUT Trend Following Rising Volume with rising Prices. Flag pattern breakout. Pennant Pattern Breakout with Bullish Candle. Retest Successful. Higher Highs & Higher Lows. Broken above RESISTANCE levels Trading at SUPPORT levels Earnings are strong. Bullish Wedge Breakout Risk Return Ratio is healthy. And Rising from Double Bottom Pattern to Flag Pattern forming. If you like my work KINDLY LIKE SHARE & FOLLOW this page for free Stock Recommendations. With 💚 from Rachit Sethia

#godrejprop - Chart crossing 0.50 retrace weekly TF#godrejprop - what a beautiful chart crossing 0.50 retracement weekly but if this forms a dragonfly doji or hammer then wick becomes SL.
Target should be 1990.
PS : Only for mastering the chart & Fibo. Pls don't trade.

GODREJPROP - Stock AnalysisGodrej Properties Ltd. is displaying strong bullish momentum in both technical and fundamental aspects, making it an attractive option for investors.
From a technical standpoint, the stock exhibits several "Strong Bullish" signals. The PriceVol indicator suggests a "Strong Bullish" sentiment, with rising prices accompanied by increasing trading volume in recent sessions. The HighLow indicator indicates "Strong Bullish" sentiment, with the stock near a one-year high and showing a robust uptrend.
The one-day analysis is "Strong Bullish," with the latest tick displaying a strong price rise supported by good volume. The Parabolic SAR (PSAR) is "Bullish" with a bullish crossover, while the KeltnerBand, HighLowBand, Awesome Oscillator, MAChannelBand, and Supertrend all indicate "Strong Bullish" signals, showing positive breakout patterns.
The MACD (Moving Average Convergence Divergence) is "Bullish" with a bullish crossover of the Macd and Signal lines, although it's noted that there have been frequent crossovers. The Williams %R and Fast Stochastic are "Bullish," indicating they are in the overbought territory, but the uptrend appears strong, suggesting that shorting the stock at this point may be risky.
The CMF (Chaikin Money Flow) suggests "Bullish" sentiment with very strong buying pressure. The daily, weekly, and monthly candlestick patterns all reflect bullish sentiment, with the weekly and monthly patterns displaying "Strong Bullish" signals.
In terms of resistance, the stock has encountered short-term resistance levels, with top points at 1716.0 on November 2, 2023, 1707.5 on October 17, 2023, and 1727.45 on October 11, 2023.
From a fundamental perspective, Godrej Properties Ltd. demonstrates positive trends. The company's Book Value has been trending upwards over the last three years, indicating a strong financial position. The Piotroski F Score is at a stable value of 4.0, which signifies sound financial health.
There has been annual net profit growth over the last three years, and the company's EBITDA has been continuously increasing for the past three years. Godrej Properties Ltd. maintains a good net margin of 22.11%, suggesting healthy profitability. However, it offers a very low dividend yield of 0.550%, indicating a preference for reinvesting profits for growth. Additionally, there has been a steady increase in Total Assets over the last three years, reflecting the company's ongoing growth and financial stability.
In summary, Godrej Properties Ltd. offers a compelling investment opportunity with strong technical and fundamental indicators. The stock's bullish technical signals, coupled with its solid financial performance, make it an appealing choice for investors seeking growth potential in the market. Nonetheless, investors should continue to monitor both technical and fundamental developments for a comprehensive understanding of the stock's potential.
Go Long above 1726.60
Stop Loss 1588

Long Trade in Godrej PropertiesEnter after breaking the red trend with strong buying volume only, The trend is good and the price has been respecting the trend for almost a year.
This trade will give you around 30% profit so you have to be patient.
All the best to all my fellow investors,,

GODREJPROP AT MONTHLY 40 SUPPORT #GODREJPROP down 60% from all-time highs & testing the confluence of supports! Price retesting horizontal breakout + primary trendline support since 2014. Monthly RSI @40 Support which indicates Value Buying in stock. Good For Investment Point of view. On Weekly + Monthly TF Price formed a falling wedge Patten and price also very close to upper downward trendline .After Breakout Good move can be seen in coming days. Wait for a higher high on daily before going with a full position. Price might consolidate for a few more weeks. Chart Showing perfect low Risk & High Reward Setup. Find Perfect Entry in Lower Timeframes. Positional Targets:- 1200/1355/1500+✔️

Godrej Properties NSE:GODREJPROP
Entry at current market price -
Gains: 15%
Duration: 3 months
If the price comes down to green box, it's a perfect buy zone.
Entry at green box -
Gains: 27-30%
Duration: 4 months
*Not a financial advice.
My charts speaks louder than words.
I'm a chartist and I paint charts.

GODREJPROP Daily TF Sellers Trapped
GodrejProp on daily chart gave fake breakdown 2 times of major support to attract sellers.. Now after getting trapped, all their stoplosses will get hit as soon as it gives a breakout of previous swing high or W pattern neckline. Taking it 1700 levels in coming time. It can be a good option to invest for 3-4 months.

GODREJPROP SUPPORT BREAKDOWN!!!Hello to everyone,
👉👉Keep Eyes on #GODREJPROP ✅🎯
👉Strong Support Zone broken Today. If Price closes below the Support Zone on #Weekly Chart and price sustain itself below the Support level than we can see good fall in price in coming days.
👉 After Breakdown of support zone wait for the closing and let sustain the price below it than only enter in the position. ✅✅👍
Traders, if you liked this idea or if you have your own opinion about it, write in the comments. I will be glad.

GODREJPROP sell for intraday tradingGODREJPROP sell for intraday trading if stock break the given support level........

Godrejproperties view for today 13th FebGodrejproperties view for today 13th Feb
Inverse head and shoulder expectation
Please follow strict risk reward and stop loss
Charts for educational purposes only
Thanks,
V Trade Point

Godrej Properties has fallen about 56% from its highsGodrej Properties
The stock has fallen about 56% from its highs and the charts are still not at their best, meaning it could fall further.
Now the question is how much further?
The next support that I got from it from monthly and weekly charts are at 865- 740, this is the zone, where it consolidated earlier and saw a massive move on the upside.
Major resistance 1500-1550
Immediate resistance: 1300- 1330
Major Support @ 740- 865

GodrejPropGodrejProp CMP 1258
We can see that my trend has turned bullish
also candles also turned bullish
As long as we hold 1190 levels (red line)
I am expecting it to touch 1675 levels (green line)
Vedang :)
Chart is for study purpose only!!!
