SPY/QQQ Plan Your Trade For 4-15 : Base Rally PatternToday's pattern suggests the SPY/QQQ have been busy forming a BASE and may transition into a moderate rally mode.
I believe this move will prompt the SPY to move above the $550 level, potentially targeting $555-565 over the next 48 hours.
This upward move could be related to news or Q1:2025 earnings.
I don't believe the markets really want to move downward at this time, although I do believe the markets will move into a topping pattern by the end of this week.
Gold and Silver are moving into BLANK pattern day, today. Given the fact that we are between rally patterns and the metals charts show a very clear FLAGGING formation (watch my video), I believe we are moving into a FLAG APEX that will prompt a move above $3300 (for Gold) and $33 (for Silver). It's just a matter of time.
BTCUSD is still struggling in the Consolidation phase. As I keep suggesting, I believe the next move for Bitcoin is to the downside. But, until we break this consolidation phase, price will continue to roll around within the consolidation range.
Remember, we are going to be moving back to more normal volatility. So you need to understand these huge daily ranges are going to vanish over the next 3-5+ days.
Volatility will likely move back to the 1% to 2.5% range very quickly.
Get some..
#trading #research #investing #tradingalgos #tradingsignals #cycles #fibonacci #elliotwave #modelingsystems #stocks #bitcoin #btcusd #cryptos #spy #gold #nq #investing #trading #spytrading #spymarket #tradingmarket #stockmarket #silver
GOLD-SILVER

SPY/QQQ Plan Your Trade For 4-14 : Up-Down-Up PatternToday's pattern suggests the markets will move in a moderate upward price trend.
Although I don't expect anything huge today, I do believe the EPP structures/layers support this upward price move and that we'll see the SPY attempt to move back towards/above 550 over time.
The QQQ will likely follow the SPY higher over the next 5+ days.
Don't get too excited about this upward price move because it is structurally moving to setup a PEAK that will transition into a downtrend near April 22-25. This peak will create a downward price flag (a new inverted EPP) structure that will assist in developing a new sideways price structure carrying into June/July.
In other words, it looks like we are trapped between 480-585 on the SPY, and we will likely stay within that wide consolidation range for another 2-3 months.
Gold should attempt to rally this week, trying to break above $3300. I believe this is a critical level for Gold and also presents a breakaway level for Silver near $33.00
Bitcoin has moved into APEX VOLATILITY and will continue to trap BUYERS into believing BTCUSD is breaking away from the consolidation range. This is a BULL TRAP.
I believe BTCUSD will ROLL OVER within about 4-5 days - setting up a big breakdown move as the SPY/QQQ also roll downward in about 5+ days.
We still continue to see volatility and sideways price action. Still lots of opportunities for skilled traders.
Get Some..
#trading #research #investing #tradingalgos #tradingsignals #cycles #fibonacci #elliotwave #modelingsystems #stocks #bitcoin #btcusd #cryptos #spy #gold #nq #investing #trading #spytrading #spymarket #tradingmarket #stockmarket #silver

GOLD & SILVER Weekly Market Forecast: Wait For Buys!In this video, we will analyze the GOLD & Silver Futures. We'll determine the bias for the upcoming week of April 14-18th, and look for the best potential setups.
Gold is still bullish, making new ATH's. Silver is not as strong, but had a very strong previous week after sweeping the range lows.
I would take valid buy setups in Gold, but not in Silver. I would prefer sells in Silver. Trade one, not both. The stronger for buys and the weaker for sells.
Enjoy!
May profits be upon you.
Leave any questions or comments in the comment section.
I appreciate any feedback from my viewers!
Like and/or subscribe if you want more accurate analysis.
Thank you so much!
Disclaimer:
I do not provide personal investment advice and I am not a qualified licensed investment advisor.
All information found here, including any ideas, opinions, views, predictions, forecasts, commentaries, suggestions, expressed or implied herein, are for informational, entertainment or educational purposes only and should not be construed as personal investment advice. While the information provided is believed to be accurate, it may include errors or inaccuracies.
I will not and cannot be held liable for any actions you take as a result of anything you read here.
Conduct your own due diligence, or consult a licensed financial advisor or broker before making any and all investment decisions. Any investments, trades, speculations, or decisions made on the basis of any information found on this channel, expressed or implied herein, are committed at your own risk, financial or otherwise.

SPY/QQQ Plan Your Trade Overview For 4-12 : Thank youThis video is mostly a big thank you for all the great comments and questions over the past few weeks.
I've been posting these videos on TradingView for almost a year and the types of viewers/followers I've been gaining is incredible.
You guys & gals have really impressed me with your questions and engagement. Many of you follow me for months without ever commenting or asking any questions.
I received a call from a client/follower in Alberta last night and he reported last week's gains at over 300% by following my videos.
I received a message from another TV follower saying he's been following my videos for many months and, after a bad loss a few years back, he has decided to give trading another go.
I've stated it before and I'll keep saying it.. I'm not trying to scam you out of anything. I'm trying to show you the RIGHT SKILLS and TECHNIQUES for you to learn to become a better, more skilled trader.
The way I look at it is like this...
If I can teach you half of what I know and see on the charts, then you guys will be able to achieve so much greater success and have gained/retained the knowledge to do it on your own.
You watch me do it over and over on these charts. Guess what - you are LEARNING at the same time.
Now, after a couple of years of doing this and following my videos, you've GAINED an education on how to trade more efficiently, manage risk more efficiently, and achieve your trading goals (I hope).
Right now, I'm getting messages/comments from people saying they are making 200%, 300%, 500%, or more every week or two from my videos.
That is absolutely incredible. I just want to urge you to remember I'm not 100% perfect in predicting the markets. No one EVER really is 100% perfect at it.
In the long run, as long as you don't get super greedy, you'll survive any minor losses and live to trade another day.
That is probably the most important thing I can teach you - trade within a proper scale to your RISK LEVEL. Never BET THE FARM on your trades. Always have a 50% to 70% cash reserve.
Anyway. Thank you. I really appreciate all of you.
Hope you enjoy this video.
#trading #research #investing #tradingalgos #tradingsignals #cycles #fibonacci #elliotwave #modelingsystems #stocks #bitcoin #btcusd #cryptos #spy #gold #nq #investing #trading #spytrading #spymarket #tradingmarket #stockmarket #silver

Gold’s deleveraging pullback spurs fresh demandSpot gold's initial response to the steepest US trade barriers in more than 100 years was a move to a fresh record high of USD 3,167 per troy ounce on heightened inflation risks, before surging volatility in response to collapsing stock markets saw traders turn their attention to capital preservation and deleveraging—the dash-for-cash focus hurt all leveraged positions across the commodities sector, including those in silver, which experienced a brutal 16.5% top-to-bottom slump, but also bullion, which despite its safe haven label during times of turmoil fell by around 4% before finding solid support around USD 2,950.
As the dust begins to settle following one of the worst risk reduction periods in recent years, demand for silver and especially gold has re-emerged, with gold has reaching a fresh all-time-high above USD 3,200, while silver has managed to retrace half of what was lost during the first week of April, both strongly suggesting that underlying concerns remain.
A combination of heightened global economic tensions, the risk of stagflation – a combination of lower employment, growth and rising inflation - a weaker dollar, will, in our opinion, continue to support bullion, and to a certain extent also silver. Adding to this is a market that is now aggressively positioning for the Fed to deliver more cuts this year—at current count more than 75 basis points of easing by year-end, and not least continued demand from central banks and high net worth individuals looking to reduce or hedge their exposure to US government bonds and the dollar.
With all the mentioned developments in mind, we maintain our forecast for gold reaching a minimum of USD 3,300 this year, while silver, given its industrious exposure and recession worries, may struggle to materially outperform gold as we had previously forecast. Instead, based on the XAU/XAG ratio returning below 90 from above 100 currently, we see silver eventually making it higher towards USD 37.

SPY/QQQ Plan Your Trade For 4-11 : Break-Away in CarryoverToday's Break-away pattern suggests the SPY/QQQ will attempt to move (break) away from yesterday's Body range. I believe this trend, after the recent Ultimate Low in price, will be to the upside.
I know a lot of people are asking, "why do you think the markets are going to rally now - after you suggested the markets would trend downward?"
Things have changed now that we have a 90-day pause in the tariff wars. Yes, China is still an issue - but the rest of the world seems to have a pause on the tariff wars as negotiations continue.
I believe the removal of the tariff pressure on the markets will result in a moderate upward trend as we move into Q1:2025 earnings season.
Still, I don't believe we will see new ATHs anytime soon. But I do believe the 580+ level on the SPY is a potential high price level that can be reached before the end of April 2025.
Gold and Silver are moving into a GAP trend move today. I believe the GAP will be to the upside and I believe Gold and Silver will continue to rally.
Silver is really low in terms of comparison to Gold. Silver could make a very big move to the upside over the next 30+ days.
BTCUSD is still consolidating into the narrow range I suggested would happen before the bigger breakdown event near the end of April (into early May).
Everything is playing out just as I expected. The big change is the removal of the tariffs for 75+ nations (for now). That will give the markets some room to the upside and we need to understand how price structure is playing out into an A-B-C wave structure.
Get some.
#trading #research #investing #tradingalgos #tradingsignals #cycles #fibonacci #elliotwave #modelingsystems #stocks #bitcoin #btcusd #cryptos #spy #gold #nq #investing #trading #spytrading #spymarket #tradingmarket #stockmarket #silver

Long due Precipitous Drop in DXY is Making Gold Unstoppable? DXY tanking has gold making a higher high after a 20 week intermediate cycle. Is this a false breakout or the next leg up?

SPY/QQQ Plan Your Trade For 4-10 : FLAT-DOWN PatternToday's Flat-Down Pattern suggests the SPY/QQQ will struggle to move away from yesterday's big open-close range.
Normally, I would suggest the Flat-Down pattern will be a small, somewhat FLAT price move.
But, after yesterday's big move, the Flat-Down pattern can really be anywhere within yesterday's Daily Body range.
So, we could see very wild volatility today. That means we need to be prepared for general price consolidation (which suggests somewhat sideways price trending) and be prepared for some potential BIG price trends within that consolidation.
These BIG price trends would be more like bursts of trending, while still staying somewhat consolidated overall.
Watch today's video to learn how the Excess Phase Peak pattern is dominating the trend right now (in the Consolidation Phase).
The same thing is happening in BTCUSD. BTCUSD has been in an EPP Consolidation phase for over 35+ days now.
Gold and Silver are setting up a CRUSH pattern today. That could be a VERY BIG move higher (or downward). Given my analysis of Gold acting like a hedge (a proper hedge for global risk levels), I believe today's move will EXPLODE higher.
Gold is already in an early-stage parabolic bullish price trend. When gold explodes above $3500, I believe it will quickly gain momentum towards the $5100 level.
Right now, Gold is recovering from the Tariff news and about to explode upward (above $3200) if we see this CRUSH pattern play out well.
Thank you again for all the great compliments. I'm just trying to share my knowledge and skills with all of you before I die. There is no need to carry all of this great information and technology to my grave.
So, follow along, ask questions, learn, and PROFIT while I keep doing this.
Get some.
#trading #research #investing #tradingalgos #tradingsignals #cycles #fibonacci #elliotwave #modelingsystems #stocks #bitcoin #btcusd #cryptos #spy #gold #nq #investing #trading #spytrading #spymarket #tradingmarket #stockmarket #silver

Palladium 8 Year Cycle Low is in and Gold AgreesMaking the case for an 8 year cycle low in palladium

SPY/QQQ Plan Your Trade For 4-9 : Top/Resistance UpdateToday's big rally, prompted by Trump's Tariff comments, presents a real learning opportunity for traders and followers of my videos.
Everyone wants to know what's going to happen next.
This video will tell you what I believe is NEXT for the markets and why.
It should also reinforce the construct that price is the ultimate indicator and the use of the EPP/Cradle patterns as a mechanism for using price structure to attempt to identify where opportunities may exist.
As much as this video is an analysis of price action and a prediction of what may come next, it is also a tutorial showing you how to use price patterns, structure and context to attempt to plan for your next opportunities.
Ideally, the next phase of the market is to establish a consolidation range.
If the 480-525 lower consolidation range does not hold - then it will likely become a precursor of the July breakdown (support) level. Remember, we still have the July/Oct lows to deal with.
I fully expect the 550-575 consolidation range to become the new dominant consolidation phase for the current EPP pattern.
It makes sense to me that, absent any crazy tariff war, the most likely outcome will be for the markets to recover back to the 550-575 level and to consolidate further.
The last component we have to consider is the recent lows near 480 could have been a very quick breakdown to an Ultimate Low. If that is the case, then we'll most into a mode of seeking the next higher resistance level and I believe the 550 or 575 level would be the obvious next resistance level.
So, at this point, I believe the continuation of the Excess Phase Peak pattern is likely, but the price is actively seeking the consolidation range between the lower consolidation level and the upper consolidation level.
Price MUST establish the consolidation range, or INVALIDATE this pattern, in order to move onto the next pattern/phase.
Get Some..
#trading #research #investing #tradingalgos #tradingsignals #cycles #fibonacci #elliotwave #modelingsystems #stocks #bitcoin #btcusd #cryptos #spy #gold #nq #investing #trading #spytrading #spymarket #tradingmarket #stockmarket #silver

Trump's Tariff Wars : Why It Is Critical To Address Global TradeThis video, a continuation of the Trump's Tariff Wars video I created last week, tries to show you why it is critically important that we, as a nation, address the gross imbalances related to US trade to global markets that are resulting in a $1.5-$1.8 TRILLION deficit every fiscal year.
There has been almost NOTHING done about this since Trump's last term as President.
Our politicians are happy to spend - spend - spend - but none of them are worries about the long-term fiscal health of the US. (Well, some of them are worried about it - but the others seem to be completely ignorant of the risks related to the US).
Trump is raising this issue very early into his second term as president to protect ALL AMERICANS. He is trying to bring the issue into the news to highlight the imbalances related to US trade throughout the world.
When some other nation is taking $300B a year from the us with an unfair tariff rate - guess what, we need to make that known to the American consumer because we are the ones that continue to pay that nation the EXTRA every year.
Do you want to keep paying these other nations a grossly inefficient amount for cheap trinkets, or do you want our politicians and leaders to take steps to balance the trade deficits more efficiently so we don't pass on incredible debt levels to our children and grandchildren?
So many people simply don't understand what is at risk.
Short-term - the pain may seem excessive, but it may only last 30, 60, 90 days.
Long-term - if we don't address this issue and resolve it by negotiating better trade rates, this issue will destroy the strength of the US economy, US Dollar, and your children's future.
Simply put, we can't keep going into debt without a plan to attempt to grow our GDP.
The solution to this imbalance is to grow our economy and to raise taxes on the uber-wealthy.
We have to grow our revenues and rebalance our global trade in an effort to support the growth of the US economy.
And, our politicians (till now) have been more than happy to ignore this issue and hide it from the American people. They simply didn't care to discuss it or deal with it.
Trump brought this to the table because it is important.
I hope you now see HOW important it really is.
Get some.
#trading #research #investing #tradingalgos #tradingsignals #cycles #fibonacci #elliotwave #modelingsystems #stocks #bitcoin #btcusd #cryptos #spy #gold #nq #investing #trading #spytrading #spymarket #tradingmarket #stockmarket #silver

SPY/QQQ Plan Your Trade For 4-9 : Top/Resistance PatternToday's pattern suggests the SPY/QQQ will attempt to move a bit higher in early trading - trying to identify a resistance area. Then, roll over into a downward price trend.
Be cautious of the overnight price range, potentially already setting the upper boundary of the TOP pattern for today. It can happen that overnight trading sets a PEAK/TOP, and we move into sideways/downward trading related to the current TOP/Resistance pattern.
I believe the US markets will attempt to move upward, toward the $490-500+ level before topping out today. I believe this move will be related to the strong support near the $480 level and will attempt to further establish the downward price channel established by the big breakdown in trend over the past 9+ days.
Ultimately, I believe price is struggling for direction, but I also believe this process (with tariffs) is working out as expected.
This is obviously a very volatile market - so stay cautious as we move into a more consolidated price trend over the next few weeks.
I don't expect the markets to try to make any really big moves over the next 2+ week (unless news hits). At this point, I believe the markets will try to UNWIND the volatility over the next 2+ weeks.
BTCUSD is trading near the lower range of the consolidation phase. This could be the start of the breakdown to the Ultimate Low.
GOLD and Silver are moving higher after forming the base (just as I expected). Metals will likely rally strongly as global fear elevates.
Thank you for all the great comments. I'll try to publish a few new videos today and tomorrow to help everyone out.
Remember, price gives us new information every minute/bar. It is a matter of unraveling the puzzle with price - one bar at a time.
If you like what I do, follow along.
Get some.
#trading #research #investing #tradingalgos #tradingsignals #cycles #fibonacci #elliotwave #modelingsystems #stocks #bitcoin #btcusd #cryptos #spy #gold #nq #investing #trading #spytrading #spymarket #tradingmarket #stockmarket #silver

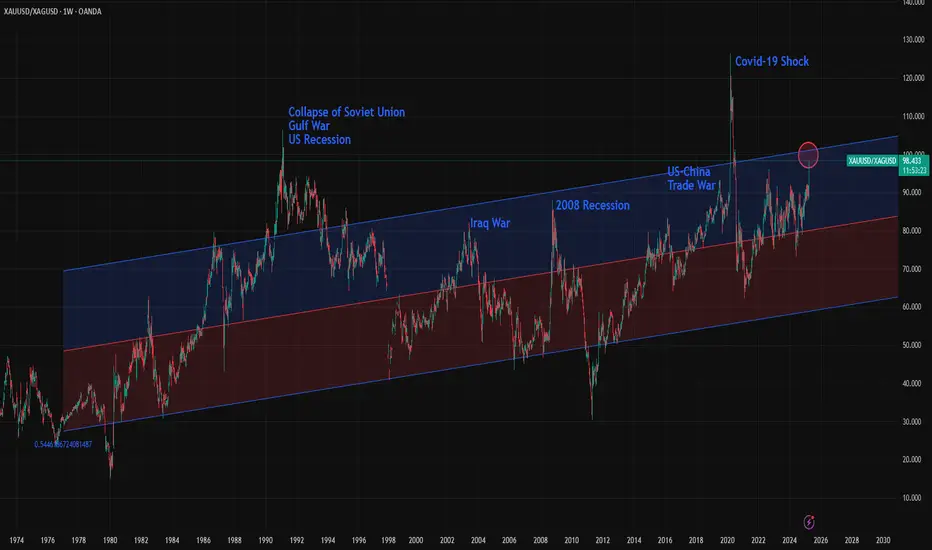
Gold/Silver Ratio Nears 100: What Does It Mean Historically?The Gold/Silver ratio is on the verge of reaching 100, an extremely rare level seen only at key historical turning points. The chart includes a 2,500-week linear regression channel, which shows that over the very long term, the ratio has been steadily rising, though at a slow pace. Occasionally, the ratio touches the 1.5 standard deviation line, and in rare, game-changing events, and sometimes it even breaks beyond that level.
Here are some of the key historical turning points marked by major spikes in the Gold/Silver ratio:
1- Early 1990s: The collapse of the Soviet Union, the Gulf War, and a U.S. recession pushed the ratio to 106. It remained above 1.5 standard deviations for more than two years.
2- 2002: Following the dot-com bubble burst, the 9/11 attacks, and the Iraq War, the ratio climbed to 82.6, nearing the 1.5 deviation line.
3- 2008 Recession: The global financial crisis triggered by the collapse of Lehman Brothers sent the ratio to 88.50. This spike sparked a major rally in both gold and silver, lasting until 2011 when the ratio reached one of its deepest bottoms.
4- 2019: The U.S.–China trade war under Trump’s first term pushed the ratio to 93, again nearing the 1.5 deviation threshold.
5- 2020 (COVID-19 Shock): The pandemic caused one of the biggest disruptions in modern economic history. Although relatively short-lived, its impacts were severe. The Gold/Silver ratio surged to 126 , marking the highest level in modern records, possibly the highest in all of history.
6- 2024–2025 (Global Trade War?): With the U.S. imposing major tariffs on key global trading partners, this could be another historic inflection point. The full impact is still unfolding, but risks of a serious global slowdown, or even a deep recession are rising. A full-scale trade war remains a real possibility.
Now, the Gold/Silver ratio is approaching 100 and nearing the 1.5 standard deviation line. It remains unclear whether this represents a powerful pair trade opportunity—"sell gold, buy silver"—or a structural breakout where the ratio stays elevated for an extended period. In either case market is showing that this is one of the rare turning point of global economy.
Likely bottom values-SUB 30 SILVER at 100 GSR-BACK THE TRUCKStocks are pulling the entire market, every sector, down, as it approaches a final 4 year cycle low. Here are the criteria most probable to be met in anticipating a bottom

SPY/QQQ Plan Your Trade Update For 4-8 : Absolute PerfectionThank you. Thank you to all of you who follow my videos and believe in my research.
The last few days/weeks have been absolutely incredible.
My SPY Cycle Patterns, on average, are about 70-80% accurate over a 12-month span of time. There are things, like news and big events (elections, outside forces, big news) that can disrupt any market trend and completely invalidate my SPY Cycle Patterns.
But, when the markets are generally left to their own accord, the SPY Cycle Patterns play out almost perfectly.
Yes, traders need to learn to adopt a PLAN A vs. PLAN B mentality with my SPY Cycle Patterns.
If Brad is right - this will happen. And if Brad is wrong, the opposite will likely happen.
But, the comments I've been receiving over the past 20+ days have been incredible.
Thank you.
Knowing that I'm reaching a larger group of people now (than when I started doing these videos about a year ago) and knowing that some of you are really seeing some BIG GAINS following my research is simply incredible.
I started doing these videos to prove my research and tools were incredible solutions for traders. But, at the same time, I started doing this to combat some of the scammers that are out there.
In my world, watching people (or hearing from them) after they've been scammed a couple of times is heartbreaking.
Most people put a lot of time and effort into trying to become skilled traders. I get it.
That's why I'm doing this - to show you the right path and to show you that price is the ultimate indicator.
Again, thank you from the bottom of my heart. Keep sending me those success stories and...
GET SOME.
#trading #research #investing #tradingalgos #tradingsignals #cycles #fibonacci #elliotwave #modelingsystems #stocks #bitcoin #btcusd #cryptos #spy #gold #nq #investing #trading #spytrading #spymarket #tradingmarket #stockmarket #silver

SPY/QQQ Plan Your Trade Update 4-8 : Counter Trend Bottom/RallyThis video was created to help you better understand why it is important to WAIT for the SPY Cycle Patterns to setup efficiently.
It is critically important that all of you learn the three basic rules of trading.
1. Never try to force a position/trade. If your research tells you some type of price event/trend is likely - don't jump into the trade too early. Wait for confirmation and wait for price to confirm your analysis is correct.
2. Start with a small position. Never GO BIG on your initial trade. If you are wrong, you can manage the trade with a small win/loss. If price moves in the direction you expect, you can add more once you get confirmation the trend will continue (potentially).
3. BOOK PROFITS early and keep BOOKING PROFITS as the trend continues higher. You can always get back into the trade with CALL/PUT options - but if you don't learn to BOOK PROFITS EARLY (20-30% profits in the trade), then you'll very likely FAIL to build your account efficiently.
(Trust me, #3 is VERY IMPORTANT)
Beyond these three simple concepts, one of the most important aspects of trading with my SPY cycle patterns is to learn to WAIT for the pattern to setup efficiently.
Today is a great example.
The BOTTOM/Rally Start pattern was in Counter-trend mode. Thus, I expected it to be INVERTED - turning it into a TOP/Selloff Start pattern.
In order for that pattern to play out, we needed to see the markets open higher (and potential trend higher for a bit of time), then roll over into a top pattern. After that tops pattern setup, the markets should continue to move into a moderate selloff trend (downward).
Think about it. Were you smart trying to SELL INTO the rally this morning or were you smart to wait for the ROLLOVER and sell into the breakdown trend?
IMO, smart traders waited for the top to setup/confirm and started selling as we got into the breakdown trend phase.
Again, I'm trying to help you learn to become a better trader.
I hope this video helps.
Get some.
#trading #research #investing #tradingalgos #tradingsignals #cycles #fibonacci #elliotwave #modelingsystems #stocks #bitcoin #btcusd #cryptos #spy #gold #nq #investing #trading #spytrading #spymarket #tradingmarket #stockmarket #silver

SPY/QQQ Plan Your Trade For 4/8 : Bottom/Rally Start - CounterFirst off, today's pattern is in a COUNTER TREND mode. Think of that as the pattern being INVERTED to the current price trend.
Next, the Bottom/Rally Start pattern is usually a base/bottom type of pattern that prompts a fairly strong bullish/rally phase in price.
This time, because it is inverted (in Counter-trend mode) and is forming within the broad consolidation phase of the current EPP pattern, I believe this Bottom/Rally Start pattern will really be a Top/Selloff start type of pattern.
Where price will find resistance in early trading, form a rollover top, and start to move back downward towards the 500-505 level on the SPY.
I don't believe this downward price move will attempt to break below 480-485 today. I believe today's move will be a moderate pullback in the trend.
Although any BIG news could disrupt the current support near $480, so be aware that any big news event could crush the markets (again) and send the SPY trying to retest the $480 support level.
Gold and Silver appear to be basing - perfect. I'm watching for Metals to really start to reflect the FEAR in the markets and rally above $3200 (Gold)/$39 (Silver).
BTCUSD appears trapped in the breakdown stage of the current EPP Consolidation phase and the new CRADLE pattern. No matter how I try to identify if I'm wrong with BTCUSD, I keep seeing the breakdown as the more dominant trend.
Get some.
#trading #research #investing #tradingalgos #tradingsignals #cycles #fibonacci #elliotwave #modelingsystems #stocks #bitcoin #btcusd #cryptos #spy #gold #nq #investing #trading #spytrading #spymarket #tradingmarket #stockmarket #silver

SPY/QQQ Plan Your Trade EOD Review : POP PatternToday's pattern played out perfectly.
I'm really amazed that the SPY rallied up to my resistance level ($520-525) and stalled/bottomed exactly near my $480 support.
Absolutely PERFECT reflection of the data I presented this morning and from my research over the weekend.
Now, if my analysis is correct, we move into a sideways consolidation pattern for the next 3+ weeks where price will attempt to establish a range (moving slightly downward in trend) before we get to the late-June breakdown (setting up the July 2025 low), then another big breakdown in October 2025.
I can't tell you how pleased I am with the comments and messages I get every day. Some of you are KILLING IT and I'm so happy to be able to help.
Remember, we are all trying to find the best way to profit from these market trends. So remember to share your success with others and let them know how to find the best tools for trading (on TradingView).
Now, let's get busy trying to get ready for the next phase of this market trend (which will come in June).
I'll keep you updated.
Get some.
#trading #research #investing #tradingalgos #tradingsignals #cycles #fibonacci #elliotwave #modelingsystems #stocks #bitcoin #btcusd #cryptos #spy #gold #nq #investing #trading #spytrading #spymarket #tradingmarket #stockmarket #silver

SPY/QQQ Plan Your Trade For 4-7 : POP In Counter Trend ModeToday's POP pattern in Counter Trend mode suggests the markets will find support and attempt to POP upward a bit.
I expect the SPY to attempt to reach levels above 505 today. Possibly trying to peak near 510.
The same thing will happen with the QQQ - a potential rally (POP) higher targeting the 420-425 level.
Watch this video TWICE if you really want to understand what is taking place in the markets right now.
The tariff issue will settle over the next 15+ days. The SPY/QQQ are moving into the EPP Consolidation Phase (just like I've been telling you for months now).
BTCUSD is moving into a BREAKDOWN phase and will likely target $63k over the next 30+ days.
Gold and Silver reacted to the breakdown of the SPY/QQQ as they always do - PANIC SELLING.
Now that the panic selling pressure appears to be subsiding, Gold and Silver should build a base and begin an explosive move higher - targeting $4200-4500 for gold and targeting $41-44 for silver.
We live in exciting times and I still believe the US markets will DOUBLE or TRIPLE over the next 5-10+ years.
Get Some.

SPY/QQQ Plan Your Trade For 4-4 : Breakaway PatternToday is a very interesting day because my MRM investment model turned BEARISH on the Daily chart. That means we have broken through major support because of this tariff war and the markets are not OFFICIALLY (based on my models) into a Daily BEARISH trend (or a Daily Broad Pullback Phase).
What that means is we need to start thinking of the markets as OVERALL BEARISH and trying to identify support - or a base/bottom in the near future.
This is no longer a BULLISH market - everything seems to have flipped into a BEARISH primary trend (OFFICIALLY).
So, watch this video to understand how Fibonacci price levels will likely play out as the SPY targeting the 500-505 level (possibly lower) and where the same Fibonacci price levels will prompt the QQQ to target 395-400.
BUCKLE UP. This is a BIG CHANGE related to overall market trend.
Gold is holding up much better than Silver. But I still believe this is a PANIC selling phase in Gold/Silver and they will both base/recovery and RALLY much higher.
The funny thing about the cycles in Gold/Silver is this:
In 2007-08, just after the major expansion phase completed, the Global Financial Crisis hit - prompting a large downward price rotation in metals.
Maybe, just maybe, this forced tariff war issue is a disruption that will "speed up" the process of metals rallying above $5000++ over the next 60+ days.
I see this move as PHASES and it appears the tariff disruption may prompt a faster Phase-Shift for metals over the next few months. We'll see.
BTCUSD seems to be in SHOCK. It's really going nowhere on very low volume.
If BTCUSD is a true hedge or alternate store of value - I would think it would have an upward reaction to this selling.
We'll see how this plays out.
Get some.
#trading #research #investing #tradingalgos #tradingsignals #cycles #fibonacci #elliotwave #modelingsystems #stocks #bitcoin #btcusd #cryptos #spy #gold #nq #investing #trading #spytrading #spymarket #tradingmarket #stockmarket #silver

SPY/QQQ Plan Your Trade For 4-3 : GAP Breakaway PatternFirst off, thank you for all the great comments and accolades related to my calling this breakdown (nearly 60+ days ago).
Did I get lucky having these new tariffs announced, causing the markets to break downward? Probably.
Did my research suggest the markets were going to break downward anyway? YES.
Did my research predict these tariffs? NO.
My research is specifically price-based. You'll notice I don't use many indicators, other than my proprietary price pressure and momentum indicators.
The purpose of what I'm trying to teach all of you is that price is the ultimate indicator. You can use other indicators if you find them helpful. But, you should focus on the price chart and try to learn as much as you can from the price chart (without any indicators).
Why, because I believe price tells us everything we need to know and we can react to price more efficiently than getting confused by various technical indicators.
At least, that is what I've found to be true.
Today's pattern suggests more selling is likely. After the markets open, I suggest there will be a bunch of longs that will quickly be exited and shorts that will be exited (pulling profits). Thus, I believe the first 30-60 minutes of trading could be extremely volatile.
My extended research suggests the markets will continue to try to move downward (over the next 60+ days) attempting to find the Ultimate Low. But, at this point, profits are profits and we all need to BOOK THEM if we have them.
We can always reposition for the next breakdown trade when the timing is right.
Gold and Silver are moving into a PANIC selling phase. This should be expected after the big tariff news. Metals will recover over the next 3-5+ days. Get ready.
BTCUSD is really not moving on this news. Kinda odd. Where is BTCUSD as a hedge or alternate store of value? I don't see it happening in price.
What I do see is that BTCUSD is somewhat isolated from this tariff news and somewhat isolated from the global economy. It's almost as if BTCUSD exists on another planet - away from global economic factors.
Still, I believe BTCUSD will continue to consolidate, attempting to break downward over the next 30+ days.
Remember, trading is about BOOKING PROFITS and moving onto the next trade. That is what we all need to focus on today.
Get Some.
#trading #research #investing #tradingalgos #tradingsignals #cycles #fibonacci #elliotwave #modelingsystems #stocks #bitcoin #btcusd #cryptos #spy #gold #nq #investing #trading #spytrading #spymarket #tradingmarket #stockmarket #silver

Using The CRADLE Pattern To Time/Execute TradesThis simple video highlights one of my newest pattern definitions - the Cradle Pattern.
In addition to the many other patterns my technology identified, this Cradle Pattern seems to be a constant type of price construct.
I'm sharing it with all of you so you can learn how to identify it and use it for your trading.
Ideally, this pattern represents FLAGGING after a trend phase.
It is a consolidation of price within a flag after a broad trending phase.
It usually resolves in the direction of the major trend, but can present a very solid reversal trigger if the upper/lower pullback range is broken (see the examples in this video).
Learn it. Use it.
Price is the ultimate indicator.
Learn to read price data more efficiently to become a better trader.
Get some.
#trading #research #investing #tradingalgos #tradingsignals #cycles #fibonacci #elliotwave #modelingsystems #stocks #bitcoin #btcusd #cryptos #spy #gold #nq #investing #trading #spytrading #spymarket #tradingmarket #stockmarket #silver

SPY/QQQ Plan Your Trade Update Update For 4-2 : ConsolidationThis quick update shows why I believe the SPY/QQQ will struggle to make any big move as long as we stay within the 382-618 "Battle Zone".
The SPY continues to rally up into this zone and stall out. If the SPY stays within this zone, I believe the markets will simply roll around in a tight range and go nowhere today.
Thus, I published this article to warn traders not to expect any big trends until we breakout - away from this Fibonacci "Battle Zone".
You can't kick the markets to make it go anywhere. And, unless you are trading very short-term swings in price - you are probably better off sitting on the sidelines waiting for a broad market trend to establish.
This is a warning. As long as we stay in the Fibonacci "Battle Zone", price will struggle to build any major trend.
So, play your trades accordingly - or just take a break from trading while you wait for the markets to roll out of the "Battle Zone".
Get some.
#trading #research #investing #tradingalgos #tradingsignals #cycles #fibonacci #elliotwave #modelingsystems #stocks #bitcoin #btcusd #cryptos #spy #gold #nq #investing #trading #spytrading #spymarket #tradingmarket #stockmarket #silver
