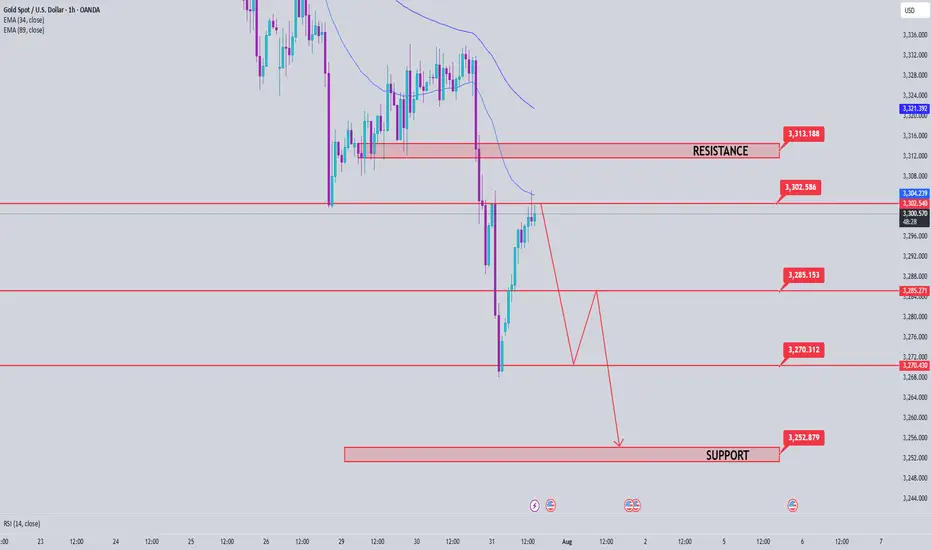
Gold price analysis July 31XAUUSD – Bearish pressure still prevails, watch for SELL in the direction of the trend
Yesterday's session witnessed a strong decline when the D1 candle closed with selling pressure up to 60 prices, forming a key candle that shapes the trend. When the market forms a main candle, the 25% and 50% candle body areas are often important price areas to continue trading in the direction of the main trend.
In the current context, the priority strategy will be to sell in the direction of the downtrend when the price rebounds to the resistance areas and there is a rejection signal.
🔹 Important resistance areas:
3301 – 3312 – 3333
🔸 Target support areas:
3285 – 3270 – 3250
🎯 Trading strategy:
Prioritize SELLing at the resistance area of 3301–3312 when there is a price reaction (rejection).
Target: 3250
BUY only considered when 3313 area is broken decisively.
Staying disciplined and sticking to the reaction price zone will be key in the context of the market moving in a clear trend.
Gold-trading
Gold’s Next Move: Bounce or Breakdown?Gold is pulling back after breaking the 3,360 USD resistance on the 6-hour chart. Price is currently testing the nearest fair value gap (3,370–3,380), but upside momentum is stalling, partly due to unfilled supply zones above.
A retest of the lower FVG near 3,340 will be key. Holding above this level could trigger renewed buying, while a break below may invalidate the bullish structure.
Traders should closely monitor whether downside gaps continue to fill and how price behaves near support zones. Lack of strong liquidity could lead to a false breakout.

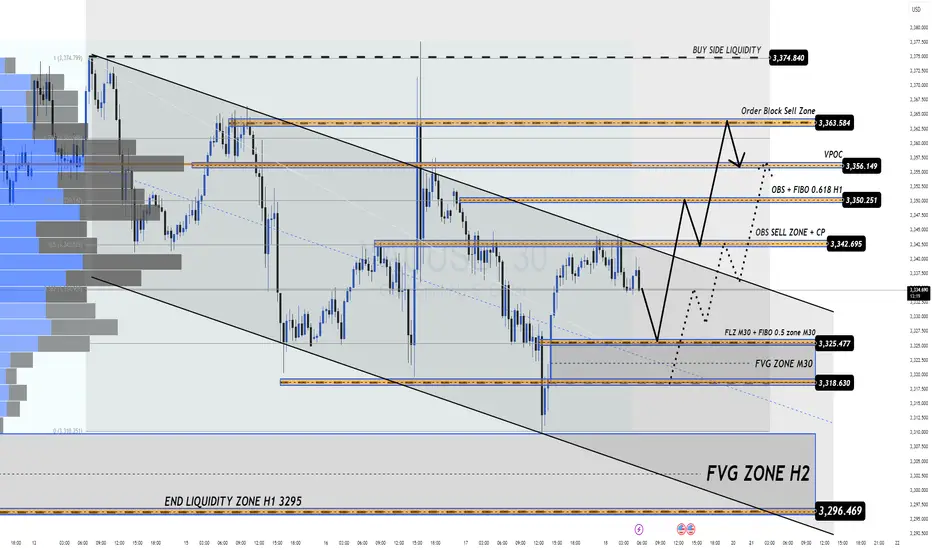
18/07 Gold Outlook Market Tensions Mount Liquidity Zones in Play Gold Outlook – Market Tensions Mount, Liquidity Zones in Play
Price action heats up as we enter the final trading day of the week. Are you ready to ride the wave or get caught in the liquidity sweep?
🔍 Market Sentiment & Global Highlights
Gold rebounded strongly after dropping on better-than-expected US data. However, several macro risks are keeping gold buyers in the game:
Buy-the-dip activity emerged amid concerns that Trump’s tariff policies may fuel inflation.
Rate cut expectations remain strong as US core inflation shows no signs of cooling.
Geopolitical risks intensified as Israel conducted fresh airstrikes on Syria.
EU threatens $84B in tariffs on US goods should trade talks break down.
💡 These tensions are giving gold strong support — especially as traders prepare for potential volatility into the weekend.
📈 Technical Overview – Liquidity Zones at Play
Yesterday's bounce from FLZ H2 (3310) — a critical demand and liquidity zone — triggered a clean reversal. Sellers took profit, volume shifted, and buyers regained control. Price has since pushed up to retest the OBS SELL ZONE + CP Pattern near the 334x area with a sharp reaction.
For today, price is likely to revisit lower liquidity pockets (M30–H2) before making the next directional move.
🔑 Key Levels to Watch
🟢 BUY ZONE: 3318 – 3316
Stop Loss: 3312
Take Profits: 3322 – 3326 – 3330 – 3335 – 3340 – 3345 – 3350 – 3360+
⚡ BUY SCALP ZONE: 3326 – 3324
Stop Loss: 3320
Take Profits: 3330 – 3335 – 3340 – 3345 – 3350 – 3360
🔴 SELL ZONE: 3363 – 3365
Stop Loss: 3370
Take Profits: 3360 – 3355 – 3350 – 3346 – 3342 – 3338 – 3335 – 3330
⚠️ Final Notes
Today’s session has no major news releases, but as it’s the end of the week, we may see liquidity grabs and unexpected volatility. Stay disciplined, stick to your plan, and always respect TP/SL.
🔔 Follow the key zones carefully – volatility loves indecision.
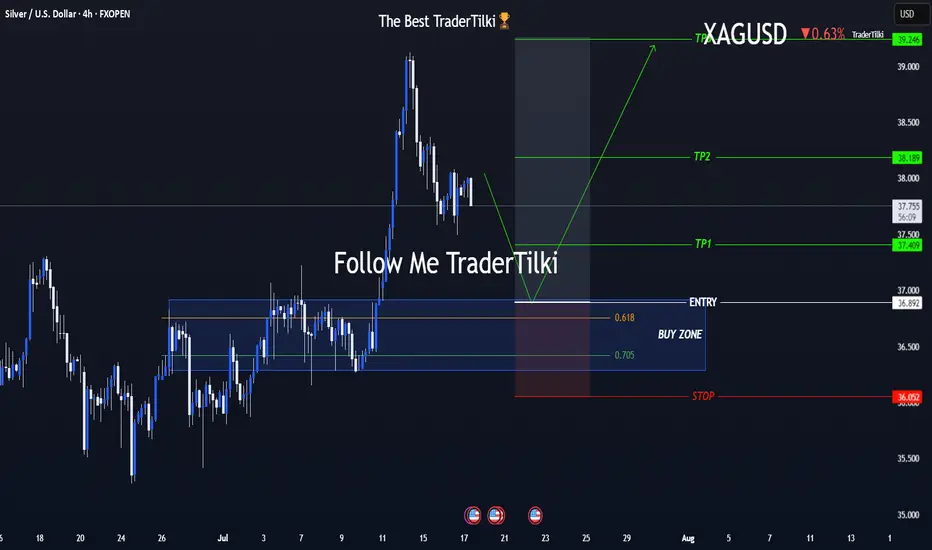
One Shot, Clear Strategy – Silver Buy Zone in SightHey everyone 👋
📌 BUY LIMIT ORDER / XAGUSD-SILVER Key Levels
🟢 Entry: 36,892
🎯 Target 1: 37,409
🎯 Target 2: 38,189
🎯 Target 3: 39,246
🔴 Stop: 36,052
📈 Risk/Reward Ratio: 2,79
I double-checked the levels and put together a clean, focused analysis just for you. Every single like seriously boosts my motivation to keep sharing 📈 Your support means the world to me! Huge thanks to everyone who likes and backs this work 💙 Our goals are crystal clear, our strategy is solid. Let’s keep moving forward with confidence and smart execution!
Smart 15-Min Entry on USDJPY – Clear Plan with 2.33 R/R📢 Hey Guys;
I've placed a buy limit order on USDJPY at a key support level.
🔵 Entry: 145.956
🔴 Stop Loss: 145.743
🟢 Targets:
• TP1: 146.069
• TP2: 146.232
• TP3: 146.468
📐 Risk/Reward Ratio: 2.33
-------
Your likes and support are what keep me motivated to share these analyses consistently.
Huge thanks to everyone who shows love and appreciation! 🙏

GOLD SELL M15Gold (XAU/USD) 15-Min Chart Analysis – July 9, 2025
The price is currently trading around the 3,295 level, after a recent Change of Character (CHoCH) and Break of Structure (BOS) indicating a shift from bullish to bearish momentum.
The market has formed a consolidation zone (highlighted in purple), suggesting a possible bearish continuation setup. Price is expected to retest the supply zone and then move lower.
Sell Setup Details:
Entry Zone: Inside the purple consolidation range (~3,295–3,297)
Stop Loss (SL): 3,305
Target (TP): 3,282
Key Support Levels:
3,292.16
3,288.16
3,282.39 (Main Target Zone)
This setup anticipates a bearish move after a rejection from the supply area, aiming for the liquidity zone near 3,282.

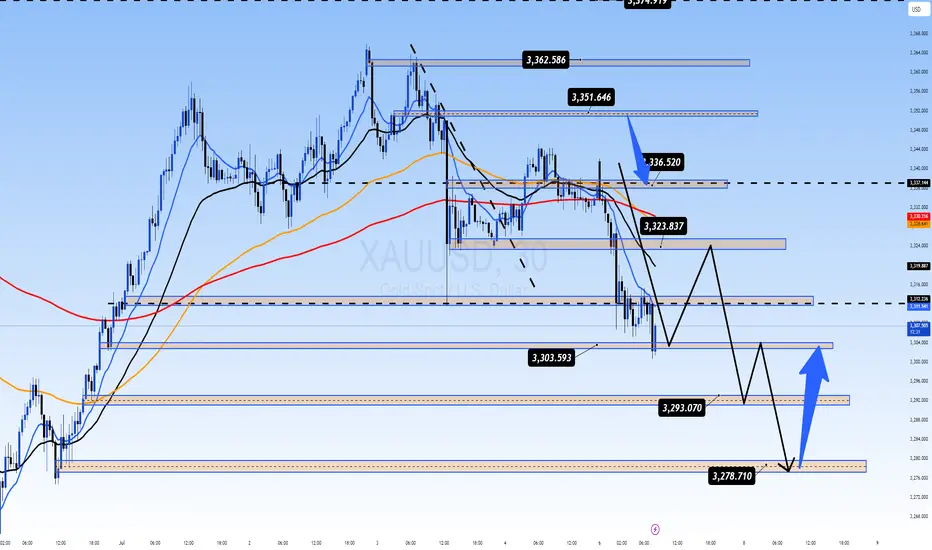
XAUUSD Below 3300 – Buying Opportunity or Trap? Gold Breaks Below 3300 – A Buying Opportunity or Sign of Deeper Correction?
🧭 Weekly Kickoff: Is the Sell-off Really That Dangerous?
At the start of the week, gold experienced a sharp drop to 3306 USD, breaking through the psychological 3300 support level and testing the 329x region. However, this isn't necessarily a sign of a sustainable downtrend — it's more likely a liquidity sweep before the market consolidates again for a bigger move.
🌐 Macro Updates Impacting Gold:
US inflation continues to ease, providing space for the Fed to loosen policy if needed.
FOMC minutes due soon — markets will be closely watching for clues about possible rate cuts.
Tensions in Gaza de-escalate temporarily, leading to a slight reduction in demand for safe-haven assets.
Trump's new tax bill has been passed, adding pressure to US public debt.
US–China trade war may be delayed — reducing short-term geopolitical pressure.
In summary, we are in a consolidation phase, with a high probability of a breakout in the coming days.
📉 Technical Analysis – CP Pattern in Focus
We are seeing a Continuation Pattern (CP), which generally signals that the current correction is a pause before the trend continues.
After rejecting resistance at 3336, gold fell, breaking through the 3323 support and quickly testing the 3303 zone, a key short-term support.
If gold breaks below 3293, the next target will be the 3278 USD liquidity zone, where strong buying could emerge.
📌 Key Trading Plan – 04 July
🔵 BUY ZONE
3294 – 3292
Stop Loss: 3288
Take Profit: 3298 → 3302 → 3306 → 3310 → 3315 → 3320 → 3330
🔴 SELL SCALP
3324 – 3326
Stop Loss: 3330
Take Profit: 3320 → 3316 → 3312 → 3308 → 3304 → 3300
🔴 SELL ZONE
3350 – 3352
Stop Loss: 3356
Take Profit: 3346 → 3340 → 3335 → 3330 → 3320
🧠 Market Sentiment Today
The market is currently in a consolidation phase, likely trading sideways between 3320 and 3340. A breakout seems likely once the liquidity from the US holiday subsides.
✅ Primary Bias: Look to buy dips into support zones.
⚠️ Alternative View: Only consider selling if price clearly rejects key resistance levels.
💬 What’s Your View on Gold Today?
Do you think gold will break through 3390 soon, or is there more room for a deeper correction towards 3270?
👇 Share your thoughts and analysis in the comments below!
Missiles in the Middle East, Headwinds on Nasdaq: NAS100 onHey There;
The trend line on the NAS100 has been broken to the downside. My target level after this breakout is 21,299.47. If the price moves towards this level, I think it will reach my target in line with fundamental analysis due to the broken trend line and Iran-Israel war tensions.
I meticulously prepare these analyses for you, and I sincerely appreciate your support through likes. Every like from you is my biggest motivation to continue sharing my analyses.
I’m truly grateful for each of you—love to all my followers💙💙💙

Small Stocks vs. GoldThis index represents small caps minus big caps, divided by gold. A good representation of how small companies in USA are doing related to gold (hard asset). You could argue that this is more representing of real economy and it's health.

GOLD: Absolute Price Collapse Ahead! Short!
My dear friends,
Today we will analyse GOLD together☺️
The recent price action suggests a shift in mid-term momentum. A break below the current local range around 3,292.92 will confirm the new direction downwards with the target being the next key level of 3,284.27 and a reconvened placement of a stop-loss beyond the range.
❤️Sending you lots of Love and Hugs❤️

Gold Loses 3,220 – Will It Fall Further?Gold has just broken through the 3,220 support and closed the H4 candle at $3,213/ounce. The strong red candle with volume shows that the sellers are still in control. I saw the EMA34 cut down to the EMA89 early and maintained a negative slope – confirming a clear downtrend.
I am watching the 3,180 – 3,200 zone as the next target. If the price rebounds but does not surpass 3,240, I will continue to sell. The current situation is not suitable for buying against the trend, especially when the USD is still strong and the safe-haven sentiment is decreasing.

Is gold about to break $3200 support?Gold has been trending lower amid growing risk appetite with stocks surging higher.
With no big bearish catalyst in sight for stocks, the market mood is optimistic and that means the pressure on gold is growing for a drop. The big macro driver has been a thaw in US-China trade tensions. With tariff rollbacks on both sides and negotiations showing real progress, investors are getting more comfortable. What’s more, Tuesday’s softer-than-expected US inflation print added fuel to the fire — calming nerves that Trump's trade tariffs would trigger a fresh inflation wave.
So, for now, sellers are in control of defensive plays like gold and yen, while the tech sector, especially chipmakers, is the main beneficiary.
Gold could potentially break THIS key support area around $3200 after making lower highs and lower lows on the intra-day charts. While the long-term trend is still bullish, I wouldn't be surprised if the bearish momentum continued for a few more days.
The first downside target is at 3136, followed by 3073 and then - the big level - 3,000. Could we see a drop to these levels in the coming days?
By Fawad Razaqzada, market analyst with FOREX.com

Gold breaks through 3,300 – Selling pressure has not stoppedGold price plummeted from 3,325 to 3,237 USD/ounce after the US and China reached a temporary agreement to reduce taxes. The stock market is up, the USD is strong, money flows out of gold. I see selling pressure clearly dominating.
On H1, the price is still below EMA34 and EMA89, recovering weakly around 3,260. H4 confirms the downtrend that has been formed before. If it does not surpass 3,270, I am inclined to believe that gold will continue to fall to 3,200 – 3,180.

Gold Breaks Support Level – The Downtrend May Not StopAfter peaking at $3,500/ounce in April, gold is in a clear correction phase. On the H4 chart, the price has broken through both the EMA34 and EMA89, indicating that a short-term downtrend has been established. The most recent session closed at $3,223, losing nearly $130 in just a few sessions.
The sharp decline appeared after a long rally and the peak was rejected many times. The break through the EMA89 support has triggered technical selling pressure, reflecting the psychology of profit-taking after failing to surpass the old peak.

Gold falls after FED news, cautious buying powerWorld gold prices retreated to $3,370/ounce, down more than $25 from last night's peak. The H4 chart shows a sharp decline that broke through the EMA34, currently testing the EMA89 - a signal that profit-taking pressure is increasing after the previous strong bounce.
The FED kept interest rates unchanged in the 4.25% - 4.5% range, as expected. However, Chairman Jerome Powell's "wait and see" statement made investors pause buying gold due to concerns that prolonged high interest rates will continue to put pressure on non-yielding assets like gold. In addition, the rise in international stocks and China's money pumping policy have reduced the attractiveness of this safe haven.

Gold surges thanks to China buying goods, waiting for FED waveInternational gold prices jumped to 3,332 USD/ounce, up more than 72 USD compared to the bottom of last night's session. The main driving force came from the wave of gold buying in China, when concerns about the weakening economy caused people to massively turn to gold as a safe haven. The H4 chart shows a strong increase, EMA34 has crossed EMA89, establishing a clear short-term uptrend. If gold surpasses 3,340 USD, it is likely to head towards the old peak around 3,420–3,500 USD.
Crude oil prices are still fluctuating strongly around 57.2 USD/barrel, creating an unstable foundation for the commodity market. The FED will announce its policy in the early morning of May 8. Although it is expected to not change interest rates, any statement can move the market. This will be the next big catalyst for gold.

Gold price suddenly accelerates, approaching the 3,300 USD/ounceAfter two consecutive weeks of decline, the world gold price is showing strong signs of recovery when it skyrocketed to 3,266 USD/ounce - an increase of 25 USD in just one session. Although still quite far from the peak of 3,500 USD/ounce, the increase this morning shows that investor sentiment has begun to change direction.
The increase occurred at the beginning of the session despite previous negative forecasts, reflecting the sensitivity of gold to geopolitical and economic information such as US-China trade negotiations or the strength of the USD. The daily chart shows that gold has bounced strongly from the EMA34 support zone and returned to the resistance zone around 3,320–3,340 USD, opening up an opportunity to retest the 3,400 USD mark if the current increase is maintained.

Gold recovers after deep fallWorld gold prices recovered to 3,238 USD/ounce on the morning of May 2 after hitting a bottom of 3,205 USD/ounce last night. The reason came from the sell-off when the Chinese market was on a long holiday, causing a lack of physical buying power.
However, investors quickly took advantage of this opportunity to buy, amid expectations that the FED would lower interest rates and central banks would continue to collect gold as a safe haven asset. The 4-hour chart shows that the price has bounced back from EMA89, heading towards the EMA34 resistance zone - a positive sign for a short-term recovery.

Gold continues to lose value, pressured by USD and China dataWorld gold prices fell to $3,279/ounce, down $31 from the previous session's peak. The USD increased slightly along with the decline of crude oil and US stocks, making gold less attractive.
In addition, weak economic data from China raised concerns about falling physical gold demand - contributing to the price decline. On the daily chart, gold is falling from the peak, approaching the EMA34, warning of the risk of a deeper correction if it fails to hold this support level.

Gold weakens under pressure from USD and bondsOn the morning of April 30, the world gold price fell to 3,318 USD/ounce, down 20 USD compared to the same time the previous day. The strong increase in USD and high US bond yields at 4.23% made gold lose its appeal in the eyes of investors.
The recovery of US stocks and the decline in oil prices further depressed market sentiment. On the H4 chart, gold has not yet escaped the sideways zone around EMA34 - a sign that buying power is weakening.

Gold falls below $3,300International gold prices are currently trading around $3,290/ounce, down $40 from last week and far from the record high of $3,500. The bearish structure still prevails as gold is below the EMA34 and EMA89, while failing many times to regain the $3,300 mark.
Strong profit-taking pressure, a recovering USD and rising bond yields are dragging gold prices down, despite the previous optimistic expectations from the Kitco survey. If gold continues to weaken below $3,300, it could head towards $3,250, deeper into the $3,200–$3,220 range. Conversely, only when it surpasses $3,320 will the downtrend be challenged.
Short-term strategy: Prioritize selling when gold recovers weakly.

GOLD WEEKLY - Key Events to Watch: ADP, Core PCE, Non-Farm📌 Weekly Gold Outlook – Key Events to Watch: ADP, Core PCE, Non-Farm Payrolls 📉📈
🌍 Fundamental Overview
Last week, gold faced heavy selling pressure after failing to sustain its rally above the $3,450 level. Easing concerns over the US–China trade tensions and a stronger US Dollar — supported by stronger-than-expected Durable Goods Orders — triggered a sharp correction in Price.
The US Federal Reserve (Fed) continues to adopt a cautious stance, awaiting clearer economic data before adjusting its monetary policy. Meanwhile, recent figures from both the US and China show signs of economic resilience, reducing safe-haven demand for gold in the short term.
Key Events This Week:
ADP Non-Farm Employment Change
Core PCE Price Index m/m
Non-Farm Payrolls (NFP)
Volatility is expected to rise sharply as these major economic indicators are released.
📊 Technical Analysis – XAU/USD 2H Chart
Gold is currently undergoing a corrective phase after its strong rally earlier this month. Price is forming a descending channel and consolidating around critical support and resistance zones.
Immediate Resistance: 3,325 – 3,377
Immediate Support: 3,275 – 3,235
As long as Price remains capped below 3,325, the bearish bias will remain dominant.
🧩 Main Scenarios for This Week
Short-Term Rebound:
Price may retest the 3,275–3,277 area before sellers regain control.
Medium-Term Bearish Pressure:
If Price fails to reclaim the 3,325 resistance zone, it could break lower toward 3,235, 3,197, and potentially deeper into the 3,108 or 3,066 liquidity zones.
Bullish Reversal Scenario:
A sustained breakout and close above 3,377 would invalidate the bearish outlook and suggest a move toward the 3,420 target.
🔍 Key Price Zones for This Week
Resistance: 3,325 → 3,377 → 3,420
Support: 3,275 → 3,235 → 3,197 → 3,108 → 3,066
🧠 Suggested Trading Strategy
Prefer short positions when Price retraces toward the 3,275 – 3,325 resistance zone, aiming for downside targets at 3,235 and 3,197.
Be cautious with long positions: only consider buying if Price drops deeply into 3,108 or 3,066 and shows strong support reaction.
⚡ Note:
Given the upcoming releases of ADP, Core PCE, and Non-Farm Payrolls, the market is expected to experience significant volatility.
Stay disciplined and await detailed intra-week updates around key event times.

Gold Retreats After Trump Confirms China Talks 📌 Gold Retreats After Trump Confirms China Talks – Political Noise Drives Volatility 🧨📉
Gold (XAU/USD) saw a sharp intraday drop following comments from President Trump, who confirmed that trade talks with China are “ongoing” — despite China denying any official negotiations had taken place. The market interpreted this as a signal of de-escalation, prompting a short-term price correction.
Gold had previously rallied past $3,500/oz, supported by a weaker USD and strong demand from bargain hunters after last week’s sharp decline. However, the current political contradictions and tariff headlines are creating erratic moves across all asset classes.
🌍 Fundamental Context
The USD weakened, stocks lost momentum, and risk sentiment shifted after a confusing round of statements from the US and China.
Meanwhile, US jobless claims rose slightly, reflecting a resilient labour market amid tariff-related headwinds.
Today’s Core Retail Sales data in the US could add more volatility heading into the weekly candle close.
It’s Friday — expect possible liquidity sweeps and aggressive price spikes as the market prepares for weekend risk-off moves.
📊 Trading Outlook – 26 April
We're seeing signs of a tactical pullback, but long setups should be delayed until political headlines stabilise. Focus on intraday reaction zones — not aggressive positioning.
🔻 SELL ZONES
3384 – 3386
• SL: 3390
• TP: 3380 → 3376 → 3372 → 3368 → 3364 → 3360 → ???
3406 – 3408
• SL: 3412
• TP: 3400 → 3396 → 3392 → 3388 → 3384 → 3380 → 3370 → 3360
🟢 BUY ZONES
3288 – 3286
• SL: 3282
• TP: 3292 → 3296 → 3300 → 3304 → 3310
3270 – 3268
• SL: 3264
• TP: 3274 → 3278 → 3282 → 3286 → 3290
🛡️ Final Notes & Strategy
Avoid rushing BUY entries — allow Price to complete its corrective phase and wait for structure and confirmation.
Today’s Core Retail Sales (US) could trigger a fresh wave of volatility.
It’s also weekly close Friday, so prepare for potential false breaks and stop hunts.
✅ Stick to your TP/SL. Protect your capital first — clarity will come when the dust settles.
💬 Are you watching for a short-term bounce or planning to fade strength near resistance? Let us know in the comments below! 👇👇👇
