XAU/USD Update: Ready for a 12% Surge?Welcome back, traders, it’s Skeptic! 😎 Is XAU/USD about to explode or crash?
We’ve formed a symmetrical triangle pattern , and its breakout triggers could deliver solid profits for longs or shorts. Let’s dive into the details with the Daily timeframe to see the big picture.
✔️ Daily Timeframe: Our HWC is strongly bullish. After hitting $ 3,497.80 , we entered a secondary retracement phase, forming a symmetrical triangle. If we break resistance at $ 3,444.18 , my targets are the next ceiling at $ 3,494.50 and, long-term, $ 3,796.64 . But if we break support at $ 3,796.64 , it could signal a major trend change from uptrend to downtrend, opening shorts. Next supports are $ 3,206.32 and $ 3,019.31 —use these as your targets.
📊 Key Insight : Risk management is key to surviving financial markets. Stick to max 1%–2% risk per trade to stay safe.
📉 Market Context: Markets are predicting a major recession in the U.S. economy. If it happens, Gold will be the only safe-haven asset. So, I personally favor riding Gold’s uptrend.
This historic drop screams one thing: global markets are losing faith in U.S. monetary and fiscal policies, big time.
And that’s a loud wake-up call for investors: It’s time to bulletproof your portfolio. What’s that mean?
Your stocks, real estate, cash, bonds , you name it...
They’re slowly but surely turning to Gold .
💬 Let’s Talk!
Which Gold trigger are you eyeing? Hit the comments, and let’s crush it together! 😊 If this update lit your fire, smash that boost—it fuels my mission! ✌️
Gold

XAUUSD: Market analysis and strategy on July 14Gold technical analysis
Daily chart resistance 3412, support below 3339
Four-hour chart resistance 3400, support below 3349
One-hour chart resistance 3390, support below 3353
Gold news analysis: In the Asian market on Monday, spot gold hit a high of 3374, a new high since June 23. Trump announced last weekend that he would impose a 30% tariff on goods imported from the European Union from August 1, further heating up the market's concerns about international trade and providing momentum for gold prices to rise. Gold prices rose 1% last Friday, closing at 3357, as investors sought safe-haven assets after US President Trump announced multiple tariff measures. Analysts said the uncertainty premium has returned to the market again. Last week, Trump stepped up his tariff offensive against Canada, saying that the United States would impose a 35% tariff on Canadian imports in August and planned to impose a comprehensive tariff of 15% or 20% on most other trading partners. Trump also announced last week that he would impose a 50% tariff on imported copper and a 50% tariff on Brazilian goods.
Gold operation suggestions:
From the current trend analysis, the support below focuses on the four-hour level 3349--53 range support, and the upper pressure focuses on the suppression near the 3400-3412 range. The short-term long and short strength dividing line is 3350. If the four-hour level stabilizes above this position, continue to buy on dips.
Buy: 3350near
Buy: 3356near

XAUUSD (Gold) - Future Outlook (as of mid-July 2025)In continuation :-
The future outlook for Gold (XAUUSD) is a complex interplay of various macroeconomic factors, geopolitical developments, and market sentiment. As of mid-July 2025, several key themes are likely to shape its trajectory:
Monetary Policy and Interest Rate Expectations (Central Bank Actions):
Impact: Gold is a non-yielding asset. Therefore, its attractiveness is highly sensitive to interest rate movements. Higher interest rates (or expectations of them) tend to increase the opportunity cost of holding gold, as investors can earn more from interest-bearing assets like bonds. Conversely, lower rates or a more dovish stance from central banks (like the U.S. Federal Reserve, ECB, BoJ) reduce this opportunity cost, making gold more appealing.
Current Context: As of mid-2025, markets are closely watching central bank rhetoric regarding potential rate cuts. If inflation continues to moderate, leading to clearer signals or actual rate cuts, this would likely be a positive catalyst for gold prices. However, if inflation proves stickier or central banks maintain a "higher for longer" policy, gold could face headwinds.
Inflation Outlook:
Impact: Gold has historically been considered a hedge against inflation and a store of value during periods of rising prices.
Current Context: If inflation remains elevated or shows signs of re-accelerating, demand for gold as an inflation hedge could increase, providing support to prices. If inflation falls back significantly to central bank targets, this traditional appeal might lessen somewhat, unless other safe-haven drivers emerge.
U.S. Dollar Strength:
Impact: Gold is primarily priced in U.S. dollars. A stronger U.S. dollar makes gold more expensive for international buyers holding other currencies, potentially dampening demand. A weaker dollar has the opposite effect, making gold cheaper and generally supportive of higher gold prices.
Current Context: The dollar's strength is heavily influenced by U.S. interest rate differentials and the relative economic performance of the U.S. versus other major economies. A "risk-off" environment can also lead to dollar strength (as a safe-haven itself), which can create a counteracting force for gold.
Geopolitical Risks and Economic Uncertainty:
Impact: Gold is a classic "safe-haven" asset. In times of increased geopolitical tension, economic instability, financial market turmoil, or escalating conflicts, investor demand for gold typically surges as a store of value.
Current Context: Global geopolitical landscape remains complex, with ongoing regional conflicts, trade disputes, and political uncertainties. Any escalation in these areas would likely contribute to increased safe-haven demand for gold. Similarly, if there are growing concerns about a global economic slowdown or recession, gold's appeal as a safe haven could strengthen.
Central Bank Gold Demand:
Impact: Central banks globally have been significant buyers of gold in recent years, diversifying their reserves away from the U.S. dollar. Their sustained buying provides a structural floor to gold demand.
Current Context: Continued strong buying by central banks, particularly from emerging economies, is expected to remain a supportive factor for gold prices in the medium to long term.
Overall Future Outlook (Mid-July 2025 Perspective):
The outlook for Gold (XAUUSD) appears cautiously bullish in the medium term, with potential for continued appreciation.
Positive Drivers: The primary drivers are the increasing likelihood of future interest rate cuts (even if gradual), potentially persistent underlying inflation concerns, and the ongoing elevated geopolitical risks and global economic uncertainties. Continued strong central bank demand further underpins this outlook.
Potential Headwinds: A significantly stronger-than-expected U.S. dollar (e.g., due to a major global "risk-off" event that drives dollar demand, or robust U.S. economic outperformance leading to delayed rate cuts) could provide a counteracting force. Rapid disinflation could also temper some of gold's appeal.
In summary, Gold is likely to remain an important asset in investor portfolios, acting as both an inflation hedge and a safe haven. Its price action will be particularly sensitive to central bank policy shifts and global stability.
⚠️ Disclaimer: This post is educational content and does not constitute investment advice, financial advice, or trading recommendations. The views expressed here are based on technical analysis and are shared solely for informational purposes. The stock market is subject to risks, including capital loss, and readers should exercise due diligence before investing. We do not take responsibility for decisions made based on this content. Consult a certified financial advisor for personalized guidance

Gold Bullish Above 3342 – Watching 3365 BreakoutGold Futures Rise on Trade & Geopolitical Tensions
Gold continues to gain as renewed tariff threats from the U.S. and rising geopolitical risks weigh on market sentiment.
While markets have become somewhat desensitized to Trump’s recurring trade rhetoric, concerns remain that resolutions may be delayed.
Technical Outlook:
As long as the price holds above 3342, the bullish trend is likely to continue toward 3355 and 3365.
A stable close above 3365 would open the way to 3395.
However, a 1H close below 3342 may trigger a pullback to 3329.
Pivot: 3342
Resistance: 3355, 3365, 3395
Support: 3329, 3319, 3309

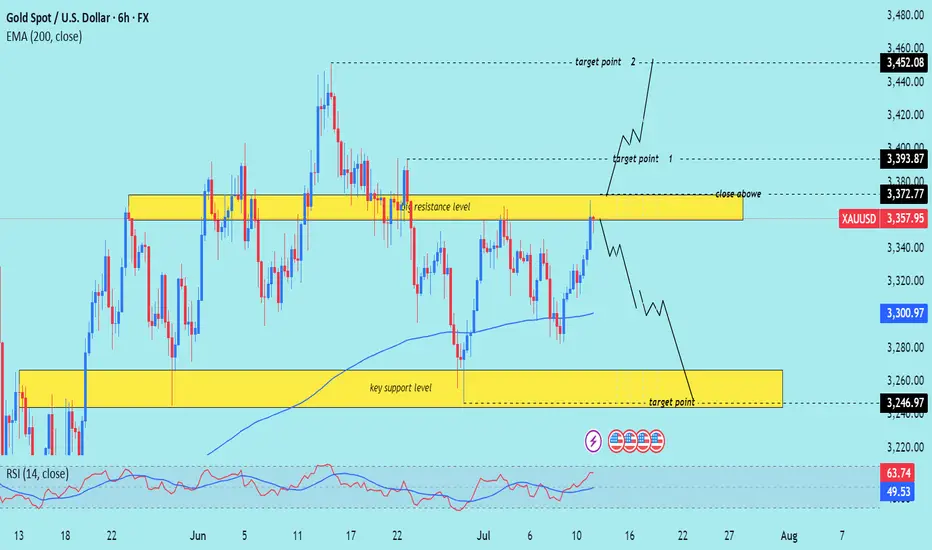
XAU/USD technical analysis setup Read The captionSMC trading point update
Technical analysis of (XAU/USD) on the 6-hour timeframe, focusing on a key resistance zone that could trigger either a bullish breakout or a bearish reversal.
---
Analysis Summary
Current Price: $3,357.95
Trend Context: Price is testing a strong resistance zone with a possible breakout or rejection in play.
---
Scenario 1 – Bullish Breakout
1. Resistance Zone: $3,357–$3,372
Multiple previous rejections.
A confirmed close above $3,372.77 signals bullish strength.
2. Upside Targets:
Target 1: $3,393.87
Target 2: $3,452.08
3. Indicators:
RSI at 63.74, approaching overbought but still with room to rally.
EMA 200 is trending upward, supporting bullish bias.
---
Scenario 2 – Bearish Rejection
1. If price fails to close above $3,372.77, a rejection from resistance is likely.
2. Downside Targets:
Reversal projected toward the key support zone at $3,246.97
EMA 200 at $3,300.97 may provide temporary support before breakdown.
---
Trade Ideas
Direction Entry Level Stop-Loss Target 1 Target 2
Bullish Close above $3,372 Below $3,346 $3,393.87 $3,452.08
Bearish Rejection from $3,357–$3,372 Above $3,380 $3,300 → $3,246.97
Mr SMC Trading point
---
Summary
This is a critical decision point for Gold. A breakout above resistance can propel price to $3,450, while rejection could drive price back to $3,246. The reaction at the current zone will dictate the next major swing.
Please support boost 🚀 this analysis)
Short position profit, focus on 3355-3345 support📰 News information:
1. Focus on tomorrow's CPI data
2. Bowman's speech at the Federal Reserve
3. Tariff information outflows and countries' responses to tariff issues
📈 Technical Analysis:
The short-term bears have successfully hit the TP to realize profits, and the trading strategy is still valid. Continue to pay attention to the 3355-3345 support during the day. If effective support is obtained here, you can consider going long. For the rebound, the first TP can focus on the 3365 line. If the gold price breaks through 3380 in the future, it will not be far from 3400. If it falls below, pay attention to the support of 3330-3320 below. It is expected that this is the limit position of short-term bearishness. The impact of tariffs is still there, and the bullish trend remains optimistic in the short term, unless Europe, Japan and other countries have a new solution to tariffs.
🎯 Trading Points:
BUY 3355-3345
TP 3365-3380-3400
In addition to investment, life also includes poetry, distant places, and Allen. Facing the market is actually facing yourself, correcting your shortcomings, facing your mistakes, and exercising strict self-discipline. I share free trading strategies and analysis ideas every day for reference by brothers. I hope my analysis can help you.
OANDA:XAUUSD PEPPERSTONE:XAUUSD FOREXCOM:XAUUSD FX:XAUUSD TVC:GOLD FXOPEN:XAUUSD

Early Week Pullback Ahead of Key Economic ReleasesGold Outlook – 14 July | Early Week Pullback Ahead of Key Economic Releases
🌍 Market Sentiment & Macro Overview
Gold has started the week with a sharp retracement after filling prior liquidity gaps (FVG) from the past two weeks.
This early weakness signals a risk-off tone as traders adopt a cautious stance ahead of a heavy macroeconomic calendar and geopolitical trade discussions.
This week’s high-impact events include:
📌 US CPI (Inflation Data)
📌 US PPI (Producer Prices)
📌 Unemployment Claims
📌 Retail Sales Figures
These data points will likely set the tone for price action through the second half of the week, with potential for sharp moves in gold.
📉 Technical Snapshot – M30 Chart Structure
Price swept minor liquidity above recent highs
Pulled back by more than $15 from the short-term top
Currently trading below the intraday VPOC (~3358), suggesting short-term bearish momentum
If the selling pressure holds, we may see a move toward:
⚠️ 333x zone — initial liquidity pool
❗ 332x zone — deeper liquidity grab before any bullish reversal
🧭 Trading Plan – Key Zones and Setup
📥 Buy Setup: 3331 – 3329 (Zone of Interest)
Stop Loss: 3325
Target Levels:
TP1: 3335
TP2: 3340
TP3: 3344
TP4: 3350
TP5: 3360 – 3370
✅ A highly reactive zone — ideal for intraday long setups if price sweeps into this area and shows bullish confirmation (e.g., volume spike or rejection wick).
📤 Sell Setup: 3393 – 3395 (Resistance Re-Test)
Stop Loss: 3399
Target Levels:
TP1: 3390
TP2: 3386
TP3: 3382
TP4: 3378
TP5: 3374 – 3370 – 3360
📉 Potential scalp zone if price retests resistance with signs of exhaustion. Monitor closely for bearish structure confirmation.
📊 Key Support & Resistance Levels
Resistance Zones:
3358
3368
3374
3394
Support Zones:
3349
3340
3331
3318
These zones remain relevant for both momentum trades and reversion setups.
⚠️ Strategy Considerations
At the time of writing, gold is trading indecisively around the M30 VPOC. No clear breakout has occurred yet.
⏳ Wait for volume confirmation during the London session
🚫 Avoid impulsive entries based on emotions or FOMO
✅ Stick to your risk parameters and let price come to your level
🧠 Summary & Bias
Gold is experiencing an early-week technical correction after recent strength.
The market is in "wait-and-see" mode, with macro drivers likely to dictate direction from mid-week onwards.
📍 Watch the 3331–3329 zone closely — it remains the most attractive level for long setups.
📍 The 3393–3395 zone is a key area to fade strength if price struggles at resistance.
Patience and precision are key this week. Let the market reveal its intention, and trade accordingly.
Volatile Times for GBPJPY: What’s Going On Behind the Moves?Good morning, Guys,
I’m anticipating a new short opportunity on GBPJPY once the pair reaches my sell zone level. From there, my target is set at 197.934.
Every like from you is what truly motivates me to keep sharing these insights.
Massive thanks to everyone who shows love and support!

Gold 30Min Engaged ( Two Bullish Entry's Detected )Time Frame: 30-Minute Warfare
Entry Protocol: Only after volume-verified breakout
🩸Bullish Reversal 3311 Zone
🩸Bullish Break 3343 Zone
➗ Hanzo Protocol: Volume-Tiered Entry Authority
➕ Zone Activated: Dynamic market pressure detected.
The level isn’t just price — it’s a memory of where they moved size.
Volume is rising beneath the surface — not noise, but preparation.
🔥 Tactical Note:
We wait for the energy signature — when volume betrays intention.
The trap gets set. The weak follow. We execute.

Market Structure & Technical Context 14 July 20241. Price Action & Market Structure
Gold has broken recent swing highs above ~$3,360, marking a bullish Break of Structure (BOS) and signaling upward momentum continuity
Recent pullback zones around $3,350–$3,340 formed a clear Higher Low (Change of Character) — textbook price action confirmation.
2. Fibonacci Retracement / Extension
Measuring from the last swing low near ~$3,326 to swing high ~3,374:
38.2% retracement at ~$3,352 coincides with the current bounce zone.
50% retracement at ~$3,350 aligns with key structure support.
Upside extension targets: 1.272 at ~$3,396, 1.618 at ~$3,425 — overlapping major resistance zones
3. ICT & Smart Money Concepts (SMC)
Order Blocks (OBs) identified near $3,340–$3,342 (prior resistance turned support) — ideal demand zone.
A recent Buy-side liquidity grab eclipsed above $3,360, sweeping stops and gathering liquidity before the breakout — classic ICT setup .
A Fair Value Gap (imbalance) lies around $3,345–$3,350 — zone to expect value-driven retracement.
Higher timeframe has clear SMC alignment: BOS above 3,360 with CHoCH already formed.
4. Major Supply / Demand & Support / Resistance Zones
Demand: $3,340–$3,352 (OB + Fib + BOS confluence).
Supply: $3,380–$3,385 (intraday swing high resistance), followed by zone at $3,396–$3,400.
Key resistance at $3,360–$3,362 — confirmed supply pocket that needs to be reclaimed
5. Moving Average Confirmation
The 4‑hour SMA/EMA 100–200 band is sloping up just below current price (~$3,340–$3,350), reinforcing the bullish context .
1‑Hour Intraday Setups (Aligned with HTF Bullish Bias)
Setup A: Pullback into 4‑Hour OB / Fair Value Gap
Entry: Limit buy at $3,345–$3,350.
Stop: Below $3,335 (below imbalance & BOS).
TP1: $3,362 (former resistance).
TP2: $3,380 (next supply block).
Setup B: Breakout Retest of 3,360
Entry: Buy on retest of broken resistance at $3,360.
Stop: Below $3,356.
TP1: $3,380.
TP2: $3,396 (Fib extension confluence).
Setup C: Momentum Continuation Fresh Breakout
Entry: Market buy on clear H1 BOS above $3,365.
Stop: Below breakout candle low (~$3,360).
TP: $3,396 (1.272 Fib) – extend to $3,425 if momentum strong.
The Golden Setup:
Setup A—buy from $3,345–$3,350—has strong confluences:
4‑hour demand OB + fair value gap,
38.2–50% Fib retracement,
SMC BOS/imbalance alignment,
ICT-style order block zone.
This offers high edge with confluence clusters.
✔ Summary Report: Direction & Key Zones
Directional Bias:
Medium-term (4H): Bullish, confirmed by BOS above 3,360, higher lows, OB and Fibonacci alignment.
🔹 Primary Buy Zones:
$3,345–$3,350 — 4H OB + fair value gap + Fib.
$3,360 on retention — breakout retest zone.
Momentum entry >$3,365.
🔹 Key Target Zones:
First resistance: $3,360–$3,362.
Next supply: $3,380–$3,385.
Extension target: $3,396 (1.272 Fib), then $3,425 (1.618 Fib).
🔻 Watchdownside Risk:
Daily invalidation if drop below $3,335 (4H OB break).
Next support at $3,326–$3,330.
📋 Consolidated Table: Setups at a Glance
Setup Entry Zone Stop Targets
Golden $3,345–$3,350 $3,335 TP1: $3,362 / TP2: $3,380
Breakout Pullback $3,360 retest $3,356 $3,380 → $3,396
Momentum BOS >$3,365 (H1 BOS) < $3,360 $3,396 → $3,425
Final Thoughts
On the 4‑hour chart, price is firmly in a bullish regime, supported by price structure, SMC, ICT concepts, and Fibonacci confluence. The $3,345–$3,350 zone is the highest‑probability entry for buyers, offering excellent risk/reward. The Golden Setup targets ~$3,380 and beyond, combining structure, gap fill, and liquidity strategy.
Gold trend forecast for next week, continue to go longAfter the gold broke through on Friday, we started to turn long, and gold rose strongly. Gold finally rose as expected, and the gold bulls are still strong. If there is no major change in the news over the weekend, the decline next week will not be large, and we can continue to buy. The gold 1-hour moving average continues to cross upward and the bulls are arranged and diverge. The strength of gold bulls is still there, and the gold moving average support has also moved up to around 3330. After gold broke through 3330 yesterday, gold fell back to 3330 and stabilized and rose twice. The short-term gold 3330 has formed a strong support. Gold will continue to buy on dips when it falls back to 3330 next week.

The impact of tariffs continues, shorting is expected to retrace📰 News information:
1. Focus on tomorrow's CPI data
2. Bowman's speech at the Federal Reserve
3. Tariff information outflows and countries' responses to tariff issues
📈 Technical Analysis:
During the weekend, the Trump administration's tariff information continued to come out, causing a large amount of funds to flow into the safe-haven market, triggering an escalation of market risk aversion. Although the collapse in the previous tariff remarks did hit the market's buying enthusiasm to a certain extent, the strong rise on Friday also stimulated the market's buying enthusiasm again. This, whether it is on the way down or on the way up, has attracted retail investors to a certain extent. As we judged on gold on Friday and the weekend, short-term bulls are undoubtedly strong. However, I think it is very dangerous to continue to chase long positions at high levels. Therefore, I tend to short-term and then consider continuing to chase long positions after the market retreats to the support level.
First of all, the CPI data will be released tomorrow. With inflation in the United States currently heating up, the Federal Reserve is undoubtedly resisting a rate cut in July. This has, to some extent, dampened the enthusiasm of bulls. Secondly, it is necessary to pay attention to the response of Europe and Japan to the tariff issue. Due to the timeliness, the current market expectations are undoubtedly limited.
In the short term, the RSI indicator is already seriously overbought. For today's operation arrangement, it is recommended to short at the rebound of 3365-3375. If the gold price continues to maintain a strong trend in the short term and breaks through this resistance area, it is time to stop loss. First of all, we should pay attention to whether 3355-3345 can be broken. Once it falls below the support of 3355-3345, we will need to see the 3330 line below, and it may even fall below 3300. Therefore, we also need to take precautions and follow up.
🎯 Trading Points:
SELL 3365-3375
TP 3355-3345
In addition to investment, life also includes poetry, distant places, and Allen. Facing the market is actually facing yourself, correcting your shortcomings, facing your mistakes, and exercising strict self-discipline. I share free trading strategies and analysis ideas every day for reference by brothers. I hope my analysis can help you.
FXOPEN:XAUUSD TVC:GOLD FX:XAUUSD FOREXCOM:XAUUSD PEPPERSTONE:XAUUSD OANDA:XAUUSD
GOLD BULLISH SENTIMENTAfter the bearishretracement, the bears lost the momentum when the price couldn't break lower than 3230's . Bullish path leads us to 3390's and could break above 3400
Further market updates would be given as the market gains momentum
New Week on Gold! Will the Bullishness continue?I was bullish on gold and price ended up doing as expected last week and looking for it to continue this week. But i have to sit on hands for now to see how they want to play Monday. Will they move to create a Low for the week first? or will they break out to start early on new highs? I have to see some type of confirmation first. Then we can get active.

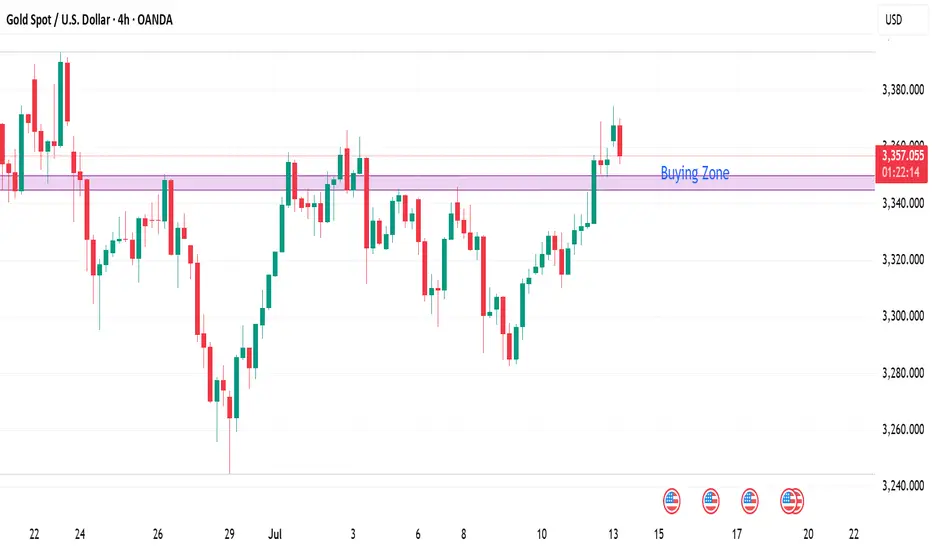
XAUUSD 4Hour TF - July 13th, 2025XAUUSD 7/13/2025
XAUUSD 4 hour Long Idea
Monthly - Bullish
Weekly - Bullish
Daily - Bullish
4hour - Bullish
Gold is looking pretty bullish this week as we saw a significant push above our 3,320.000 resistance zone. Looking to ride that same trend through this next week.
Bullish continuation - After a nice rally last week gold looks primed for another long setup. Ideally, price action goes for the retest of 3,320.000 and forms a higher low. This would confirm bullish structure and we can begin targeting higher toward major levels of resistance.
Bearish Reversal - For us to consider bearish setups we would first need to see a break back below 3,320.000 followed by a confirmed lower high. If this happens we can consider short positions and look to target lower toward major levels of support.

Gold | Oil | Dollar | Silver | Natural Gas July 2025 Forecast.Gold | Oil | Dollar | Silver | Natural Gas July 2025 Forecast.
NYMEX:NG1! COMEX:GC1! COMEX:SI1! NYMEX:CL1!

Heading into Fibonacci confluence?XAU/USD is rising towards the resistance level, which is a pullback resistance aligning with the 127.2% Fibonacci extension, the 71% Fibonacci retracement, and the 100% Fibonacci projection. A reversal from this level could lead to our take profit
Entry: 3,392.02
Why we like it:
There is a pullback resistance that lines up with the 127.2% Fibonacci extension, the 71% Fibonacci retracement and the 100% Fibonacci projection.
Stop loss: 3,451.74
Why we like it:
There is a pullback resistance.
Take profit: 3,338.86
Why we like it:
There is a pullback support.
Enjoying your TradingView experience? Review us!
Please be advised that the information presented on TradingView is provided to Vantage (‘Vantage Global Limited’, ‘we’) by a third-party provider (‘Everest Fortune Group’). Please be reminded that you are solely responsible for the trading decisions on your account. There is a very high degree of risk involved in trading. Any information and/or content is intended entirely for research, educational and informational purposes only and does not constitute investment or consultation advice or investment strategy. The information is not tailored to the investment needs of any specific person and therefore does not involve a consideration of any of the investment objectives, financial situation or needs of any viewer that may receive it. Kindly also note that past performance is not a reliable indicator of future results. Actual results may differ materially from those anticipated in forward-looking or past performance statements. We assume no liability as to the accuracy or completeness of any of the information and/or content provided herein and the Company cannot be held responsible for any omission, mistake nor for any loss or damage including without limitation to any loss of profit which may arise from reliance on any information supplied by Everest Fortune Group.

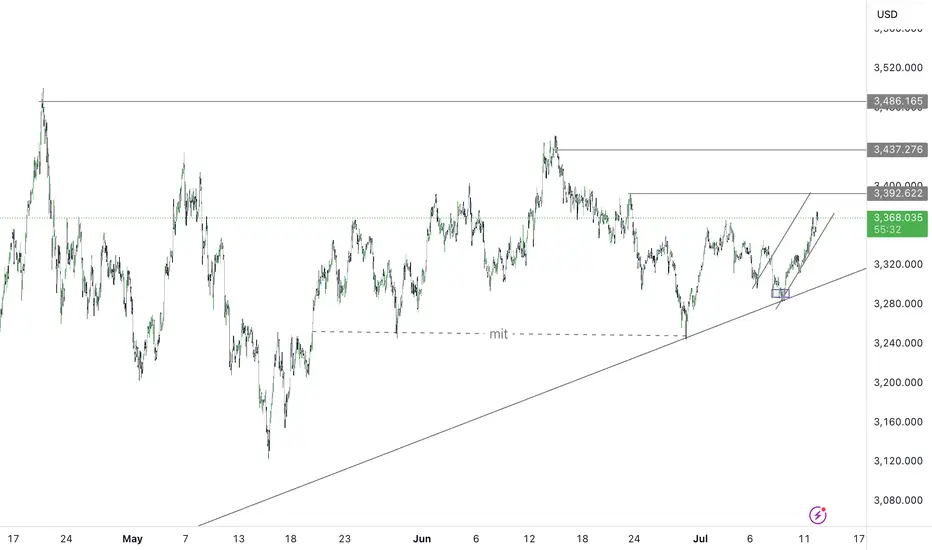
Looking for catalysts - Gold Outlook July 7 - July 11, 2025All about last week you can find here:
FX_IDC:XAUUSD Gold is currently seeking fresh catalysts this week. 🧐
While the economic calendar appears light for this time of year, a lack of economic data doesn't mean nothing is happening. Geopolitical events, especially tariff wars or other flashpoints, remain significant. Are there increasing signs for peace in the Middle East between Israel and Hamas? 🕊️
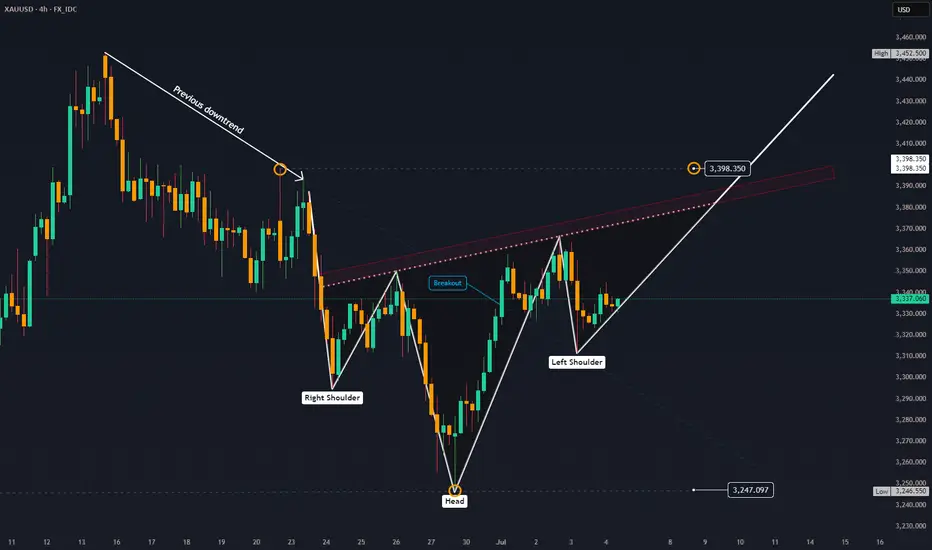
This week Gold could take advantage from an exisiting reversal head and shoulders pattern and painting pitchfork in the chart shows possibillities for Upside targeting $3400.
## Geopolitical News Landscape 🌍📰
Israel / Iran ⚔️🛑☢️
After fierce clashes in June, a **ceasefire** began June 24. 🇮🇷 Iran's Supreme Leader reappeared July 6, claiming victory 🎤. Tehran has now **banned IAEA inspectors** ❌🔍. Over 900 Iranians reportedly killed ⚰️.
🔮 Outlook: ⚠️ Nuclear tensions growing, diplomacy frozen 🧊. Regional powers remain on high alert 🚨.
India / Pakistan 🗻🔫🕌
Tense calm in Kashmir 😐. India launched its sacred **Amarnath Yatra** 🕉️ under heavy security 🛡️. Pakistan killed 30 militants near the Afghan border ⚔️, while China 🐉 admitted sharing intel 📡.
🔮 Outlook: Diplomatic track stays open 🕊️, but **border flare-ups** and water disputes 💧 remain volatile 🔥.
Gaza Conflict 💣🏘️🕊️
Israel launched deadly airstrikes ✈️, including one on a beach café ☕🏖️ killing 22. Dozens more died 💔. IDF admitted accidental strikes on aid sites 🚚❌. U.S.-led talks seek a **60-day truce** 🤝.
🔮 Outlook: Ceasefire possible 🛑, but **humanitarian crisis** worsening 🚨🩺. Trust remains fragile 💔.
Russia / Ukraine ⚔️
Zelenskyy 🇺🇦 and Trump 📞 discussed new air defense aid 🎯. Russia answered with **massive drone strikes** on Kyiv 🚁🔥. NATO boosts arms shipments 🔫 and backs Ukraine’s domestic weapons production 🏭.
🔮 Outlook: War grinds on ⚙️. No peace in sight, with **global stakes** rising 📈.
U.S. / China Trade War 💼📦🔥
With new tariffs looming 📆💣, Treasury said “multiple deals” are near 🤝. Trump claimed a **partial deal with China** 🐉, though tariffs remain high 📊.
🔮 Outlook: More piecemeal deals 🍰, but a **full-scale trade reset** looks unlikely before elections 🗳️.
🌍 Global Trade War 📉🚢💸
Trump’s shifting tariffs 🎯 hurt global growth 🌐. Markets hit record highs 📈 but investment chills ❄️. The 💵 dollar had its sharpest 6-month drop 📉 in decades.
🔮 Outlook: Businesses remain cautious ⚠️. **Supply chains** reroute 🔄. No global rebound without clarity 🔍.
Trump vs. Powell 💥🏛️📉
Trump demanded Powell’s resignation ❌📉, accusing him of weak rate policy 📊. Powell held firm 🧊, citing inflation risks 📈. Trump eyes replacements 👀🪑.
🔮 Outlook: Fed independence 🏛️ under fire 🔥. **Rate policy** may get politicized ahead of 2025 elections 🗳️.
📈 U.S. Inflation 🛒💰🧾
Inflation slowed to 0.1% 🐢, but tariffs raised prices on appliances 🔌 (+4.3%) and toys 🧸. Fed projects 3% inflation by year-end 📊.
🔮 Outlook: As **tariffs bite** 🦷, inflation likely to climb 📈. Fed stays cautious 🧐 on cuts.
Technical View 📐📈
Analysis Period: May 25 - June 6, 2025 | Forecast: June 7-11, 2025
1. ICT (Inner Circle Trader) Methodology Analysis 🧠
Market Structure
Higher Timeframe Bias: The chart shows a clear bullish market structure with higher highs and higher lows from the major low around 3,250. 🐂
Current Structure: Price is in a consolidation phase after reaching highs near 3,370, showing potential distribution. ⚖️
Key ICT Concepts Identified:
Fair Value Gap (FVG): Multiple gaps visible during the strong rally from 3,250 to 3,370. 💨
Order Blocks: Significant demand zone around 3,250-3,260 level (major accumulation area). 📦
Liquidity Zones:
Buy-side liquidity above 3,370 (recent highs). 💸
Sell-side liquidity below 3,320 (recent consolidation lows). 📉
Market Maker Models: Classic accumulation-manipulation-distribution pattern visible. 🔄
Session Analysis:
London Session: Shows strong directional moves. 🇬🇧
New York Session: Continuation of trends with increased volatility. 🗽
Asian Session: Consolidation and range-bound behavior. 🌏
2. Gann Analysis 🧙♂️
Gann Angles & Time Cycles:
Primary Trend: 1x1 angle supporting the bullish move from 3,250. ↗️
Resistance Angles: 2x1 and 3x1 angles providing resistance around current levels. 🚧
Time Cycles:
7-day cycle showing completion around June 2-3. 🗓️
14-day cycle suggesting potential reversal window June 7-9. ⏳
Gann Price Levels:
Major Support: 3,250 (1/8 level). 🛡️
Current Resistance: 3,370 (7/8 level). 🛑
Next Target: 3,400 (full octave completion). 🎯
Geometric Relationships:
Price squared relationship suggests 3,380-3,400 as natural resistance. 📐
Time-price balance indicates consolidation period before next major move. 🕰️⚖️
3. Fibonacci Analysis ✨
Retracement Levels (from 3,250 low to 3,370 high):
23.6%: 3,341.6
38.2%: 3,324.2
50.0%: 3,310.0
61.8%: 3,295.8
78.6%: 3,265.6
Extension Levels:
127.2%: 3,402.6
161.8%: 3,444.2
200.0%: 3,490.0
Current Analysis:
Price has respected the 23.6% retracement level multiple times. ✅
Strong support confluence at 38.2% level (3,324). 💪
Extension targets suggest potential move to 3,402-3,444 range. 🚀
4. Institutional Levels Analysis 🏦
Psychological Levels:
3,300: Major round number providing support. 💯
3,350: Mid-level resistance. 📊
3,400: Next major psychological target. 🎯
Institutional Order Flow:
Accumulation Zone: 3,250-3,280 (heavy institutional buying). 💰
Distribution Zone: 3,350-3,370 (profit-taking area). 💸
Breakout Target: 3,400+ (next institutional objective). ⬆️
Volume Analysis:
High volume on the initial move up from 3,250. 📈
Decreasing volume during consolidation (typical distribution pattern). 📉
Volume expansion needed for breakout confirmation. 💥
5. Cycle Timing Analysis ⏰
Short-Term Cycles:
3-day cycle: Currently in compression phase. 🤏
7-day cycle: Completed around June 2-3. ✅
14-day cycle: Due for completion June 7-9. ⏳
Medium-Term Cycles:
Monthly cycle: Bullish momentum phase. ⬆️
Quarterly cycle: In expansion phase. 🌟
Cycle Projection:
Next major cycle turn expected June 7-9. 🔄
Potential for either breakout or correction during this window. 🤞
6. FORECAST: June 7-11, 2025 🔮
Primary Scenario (60% probability): Bullish Breakout 🚀
Target 1: 3,400-3,410
Target 2: 3,440-3,450
Catalyst: Break above 3,370 with volume. 💥
Timeline: June 7-9 initial move, June 10-11 extension.
Secondary Scenario (35% probability): Corrective Pullback ⬇️
Target 1: 3,320-3,325 (38.2% Fibonacci)
Target 2: 3,300-3,310 (psychological support)
Catalyst: Failure to break 3,370 resistance. 🚫
Timeline: June 7-8 decline, June 9-11 consolidation.
Low Probability Scenario (5% probability): Deep Correction 📉
Target: 3,280-3,290 (61.8% Fibonacci)
Catalyst: Major risk-off sentiment. 😱
Timeline: Extended throughout the week.
7. Key Assumptions & Risk Factors 🤔
Bullish Assumptions:
Continued institutional accumulation at current levels. 🏦
Breakout above 3,370 with confirming volume. ⬆️
Favorable macroeconomic backdrop for gold. 🌍
Weakness in USD supporting gold prices. 💵
Geopolitical tensions maintaining safe-haven demand. 🕊️
Bearish Risk Factors:
Profit-taking at psychological 3,400 level. 🤝
Stronger USD due to economic data. 💹
Reduced safe-haven demand. 📉
Technical failure at key resistance levels. 🚧
Central bank policy shifts. 🏛️
8. Trading Recommendations 💡
Entry Strategies:
Bullish Setup: Buy on pullback to 3,340-3,345 with stop below 3,320. 🎯
Breakout Play: Buy break above 3,372 with stop below 3,350. 🚀
Conservative: Wait for retest of 3,324 support area. patiently 🧘
Risk Management:
Position Size: Limit to 2-3% of portfolio per trade. 📏
Stop Loss: Always use stops below key support levels. ⛔
Take Profit: Scale out at Fibonacci extension levels. 💰
Key Levels to Watch:
Immediate Resistance: 3,365-3,370 🛑
Support: 3,340-3,345 🛡️
Breakout Level: 3,372 🚀
Major Support: 3,320-3,325 💪
9. Conclusion ✅
The XAUUSD chart presents a constructive bullish setup with multiple confluences supporting higher prices. The completion of various cycles around June 7-9 suggests a potential catalyst for the next major move. While the primary bias remains bullish targeting 3,400+, traders should remain alert to the possibility of a corrective pullback to test lower support levels. 🧐
The institutional accumulation pattern, combined with favorable Gann angles and Fibonacci projections, supports the bullish thesis. However, proper risk management is essential given the potential for volatility around key psychological levels. ⚠️
Please take the time to let me know what you think about this. 💬
-------------------------------------------------------------------------
This is just my personal market idea and not financial advice! 📢 Trading gold and other financial instruments carries risks – only invest what you can afford to lose. Always do your own analysis, use solid risk management, and trade responsibly.
Good luck and safe trading! 🚀📊
Gold Looks Bullish: technical and fundamentalHi Guys!
Gold is starting to flash major bullish signals, and this time, it’s not just about the chart. The technical setup is clean, but we’re also seeing fundamental tailwinds that could fuel a bigger move.
Let’s break it down
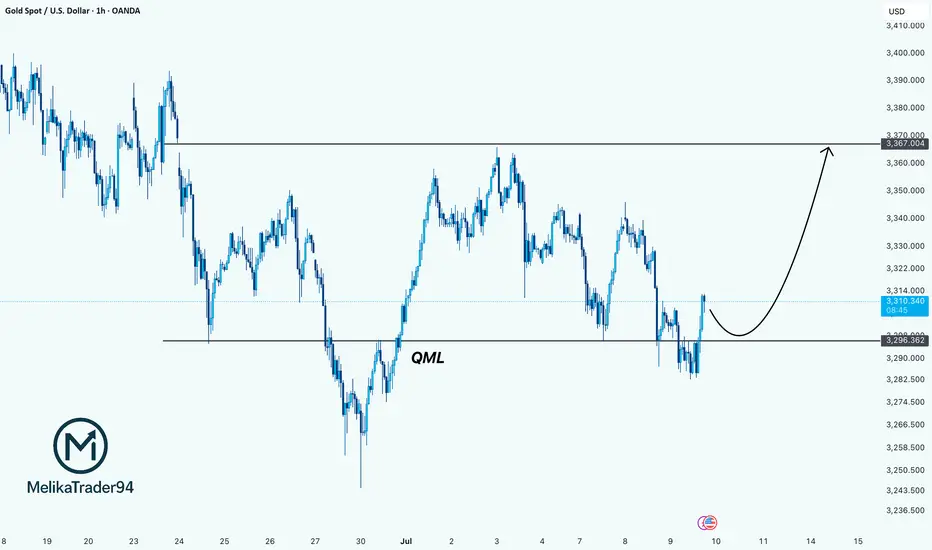
1. Technical Setup: The QML Reversal Is In Play
On the 1H chart, Gold is showing a textbook Quasimodo (QML) reversal pattern. Price made a lower low, then reversed up to break structure, and now it’s pulling back and respecting the key QML zone around $3,296.
This zone has turned into strong support. As long as we stay above it, the structure suggests a continuation toward $3,367 — a clean upside liquidity target and the previous high.
Strategy: Look for pullbacks into $3,296 for potential long entries with targets around $3,367 or higher.
2. Fundamental Tailwinds: Why Gold Is Gaining Strength
The fundamentals are stacking up in Gold’s favor right now. Here’s what’s fueling the move:
- Weakening USD & Rate Cut Expectations
With the Fed increasingly signaling rate cuts by late 2025, the US dollar is losing steam. Lower interest rates reduce the opportunity cost of holding non-yielding assets like Gold, making it more attractive to investors. Traders are already pricing this in.
- Softening Economic Data
Recent U.S. data, including weaker-than-expected job growth and declining manufacturing numbers, points to a slowing economy. That puts more pressure on the Fed to pivot dovish, which historically sends Gold higher.
- Central Bank Demand
Global central banks (especially in Asia) continue to accumulate physical Gold as part of their long-term reserve strategy. That institutional demand provides strong support at lower levels.
Technical + Fundamental = Strong Bullish Bias
We’re seeing a solid confluence here:
Chart says long (QML + bullish structure)
Macro says long (dovish Fed + weaker dollar + safe haven demand)
Drop your thought here!
GOLD - GC | Weekly Recap & Plan 13.07.2025🟡 GOLD (GC) Weekly Recap & Outlook
Symbol: GC1!
Date: Week of July 8–12, 2025
Timeframes Used: 4H, Daily, Weekly, HTF structure
🔍 What Happened Last Week?
Gold saw a strong rejection from a confluence of two HTF trendlines, signaling resistance.
But that move was absorbed by:
🟦 Daily Demand (blue zone)
🔵 Daily Swing Liquidity (blue line)
This builds a bullish structure on the daily chart.
🧭 Scenarios I'm Watching
Scenario 1 — Minor Pullback:
🔹 Price may revisit the Daily Gap (pink line) and find support for continuation.
Scenario 2 — Deeper Pullback:
🟣 Price could retrace into the HTF bullish trendline (purple) before resuming upside.
🗞️ Bonus Macro Scenario: Powell Resignation?
There are growing rumors that Fed Chair Powell might resign this week.
📈 If that happens, I expect strong bullish momentum in Gold —
→ very limited retracement, and
→ potential straight breakout into new highs.
🎯 Targets for the Week:
✅ 1st Target:
W C DOL (purple line) → acts as a primary take profit area.
✅ 2nd Target (Expansion):
EQHs / DOL (extended purple levels)
Game Plan:
Watch for LTF confirmation on both retracement zones.
Maintain bullish bias unless Daily Demand fails.
If Powell resigns, be ready for breakout setups.

GOLD MARKET ANALYSIS AND COMMENTARY - [Jul 14 - Jul 18]This week, OANDA:XAUUSD opened at $3,342/oz, dropped to $3,282/oz, but then rebounded sharply to close at $3,355/oz. The recovery was mainly driven by former President Trump's announcement of new tariffs ranging from 20% to 50% on imports from 22 countries, effective August 1st. Particularly, a 35% tariff on Canadian goods — a key U.S. trading partner — raised concerns about global trade stability and supply chains.
Trump also proposed 15–20% tariffs on most other trading partners, reigniting fears of global trade disruptions. At the same time, ongoing conflict between Israel and Hamas continued to weigh on sentiment, despite U.S. diplomatic efforts showing little progress.
However, analysts note that gold still lacks strong momentum for a breakout. Trump's tariff threats may be more about negotiation leverage than triggering a full-blown trade war. Meanwhile, with the labor market recovering and inflation rising, the Fed is expected to maintain its neutral monetary policy, limiting short-term gold price movements.
Although geopolitical tensions remain (e.g., Russia-Ukraine, Israel-Hamas), the ceasefire between Israel and Iran has reduced gold’s geopolitical risk premium.
Looking ahead, key U.S. economic data next week — including CPI, PPI, and retail sales — will be closely watched. A strong June core CPI (0.4% or higher) could reduce the likelihood of a Fed rate cut in September, strengthening the USD and pushing gold lower. Conversely, weaker inflation data could boost expectations of a rate cut, supporting gold prices.
📌In terms of technical analysis, gold prices next week may continue to adjust and accumulate. Accordingly, if they surpass the 3,370 USD/oz mark, gold prices next week will challenge the 3,400-3,450 USD/oz range. On the contrary, gold prices next week will adjust down to 3,285 USD/oz, or even 3,245 USD/oz.
Notable technical levels are listed below.
Support: 3,350 – 3,310 – 3,300USD
Resistance: 3,371 – 3,400 – 3,430USD
SELL XAUUSD PRICE 3435 - 3433⚡️
↠↠ Stop Loss 3439
BUY XAUUSD PRICE 3329 - 3331⚡️
↠↠ Stop Loss 3326

XAUUSD Daily Sniper Plan – July 14, 2025Hey team 👋 and welcome to a fresh new week on the charts!
We’re starting this Monday without any major news — just pure price action, clean zones, and structure doing all the talking. No distractions. No excuses. Let’s lock in our focus and let the market show us where the edge is.
🔸 Bias: Bearish while below 3390
Last week’s rejection from the H1 premium zone (around 3375) created clear signs of exhaustion. Price is now forming lower highs and lower lows, with clean CHoCHs on both H1 and M15. Until we reclaim 3390, we remain bearish — waiting for the next lower high to form.
🔽 Sniper Sell Zones (above current price)
3360–3370 → H1 premium FVG + CHoCH OB + EMA5 cap
3380–3390 → Inducement zone + internal imbalance + RSI divergence
🔼 Sniper Buy Zones (below current price)
3310–3320 → Discount FVG + BOS base + HL support
3280–3290 → Final HL structure zone + fib 61.8% + OB + RSI oversold
🟡 Decision Zone:
3330–3340 → Neutral zone
→ Wait for break and retest or rejection confirmation.
→ No setup = no trade.
🧠 Battle Plan – Execution Scenarios:
🔴 Scenario A – Bearish Setup Active:
If price returns to 3360–3370 or 3380–3390 and shows M15/M30 rejection → enter short.
Target: 3330 → 3310.
If 3390 is broken and held → cancel short bias.
🟢 Scenario B – Bullish Setup Activated:
If price sweeps 3320 or 3290 and reacts with strong bullish PA (engulfing or CHoCH) → enter long.
Target: 3340 → 3360.
No confirmation = stay flat, do not anticipate.
🟡 Scenario C – No Reaction / Choppy Flow:
If price consolidates between 3330–3340 without clean rejection or break → wait.
Let price show its hand. Today is Monday — we need clarity, not emotion.
Every level in this plan was drawn with purpose — no shortcuts, no borrowed zones.
If you value structure, discipline, and originality in your trading, you’re in the right place.
Your support means everything — I see every 🚀 and every comment, and I appreciate this community deeply.
Let’s keep growing, with real work and real structure.
Follow GoldFxMinds — we stay sharp, we stay true. 💛
📎 Trade Nation Disclaimer
Chart and structure based on Trade Nation broker feed on TradingView. For educational purposes only — not financial advice.

Ethereum (ETH/USD) on the 2-hour timeframe.Ethereum (ETH/USD) on the 2-hour timeframe, here's the analysis and target level:
---
🟦 Chart Observations:
ETH is in a rising channel.
Price is respecting Ichimoku Cloud support.
A bullish breakout pattern is forming (consolidation above the cloud).
My clearly marked "TARGET 3300" at the top.
---
🎯 Target Level:
Primary Target: $3,300
This is the next major resistance and aligns with the top of the projected ascending channel.
Confirmed by your chart annotation.
---
📍 Current Price:
$2,964.3 (Sell) / $2,964.5 (Buy) — as shown in the screenshot.
---
📈 Strategy Suggestion:
Entry: On break above local consolidation / wedge (~$2,980–3,000).
Target: $3,300
Stop-Loss: Below Ichimoku cloud or lower channel (~$2,850 or tighter).
Support Levels to watch:
$2,815 (highlighted on the chart)
$2,700 (lower channel zone)
---
Would you like me to prepare a full trade plan or backtest this setup?
