XAUUSD Daily Outlook – July 14, 2025Happy Sunday, traders. Gold opens the week inside a compressed range under key premium resistance, with CPI and FOMC speakers loading the macro agenda. Let’s break down today’s structure and expectations.
🔸 D1 Structure Overview:
Bias: Neutral with bearish pressure building
Trend: Still technically bullish, but compressing between LH OB and mid-range FVG
Current Position:
Price is trapped below 3395, inside a lower high structure
No clear BOS yet — but bearish CHoCH already formed
EMAs are tightening and RSI is neutral → signs of indecision
🧭 Key Daily Zones:
Zone Type Price Range Confluences
🔼 Supply Zone 3448–3465 Daily OB + FVG + Weak High trap + EMA divergence
🔼 LH OB 3385–3395 Structure cap + internal supply + EMA21 rejection
🔽 Mid FVG Demand 3328–3310 Daily FVG + fib midpoint + prior reaction
🔽 Strong OB Support 3260–3245 Unmitigated OB + fib 61.8% + sweep low base zone
Fibonacci: Pullback toward 3310 = mid-retracement of last bullish impulse
EMA 5/21/50: Bearish crossover confirmed, but no strong divergence yet
RSI: Flat, suggesting reactive play — confirmation must come from PA
📊 Macro Outlook:
Core CPI data drops today → key for market expectations on inflation
Multiple FOMC members will speak — high potential for whipsaw moves
Gold may remain volatile and range-bound until post-CPI structure resolution
📌 Trade Scenarios:
Bearish case: Reject from 3385 → continuation toward 3310 or deeper into 3245
Bullish case: Clean break & retest above 3395 → short-term pump into 3460 liquidity
Confirmation matters — follow the reaction at each zone, don’t rush reversals.
✅ I appreciate every 🚀, comment, and follow I see on my plans.
If this breakdown brought you clarity, show some love below.
I post pure structure, no noise — every day.
Keep following GoldFxMinds for sniper insights, real levels, and full transparency on XAUUSD.
Let’s grow sharp, consistent, and fearless — together. 💛
📎 Disclaimer:
Chart and analysis based on Trade Nation broker feed on TradingView.
This is a technical outlook for educational purposes and not financial advice.
Gold

Weekly XAUUSD Outlook (July 14–19, 2025)Hey team — we're entering a decisive week on gold as macro tensions heat up and price dances inside a key premium range. Let’s dive into what the chart is telling us.
🔸 HTF Bias: Weekly Structure Breakdown
Bias: Bullish with exhaustion signs
Current candle: Bearish rejection forming after last week's lower high inside the premium range
Trend: Still bullish overall, but stalling inside a distribution-like pattern
Weekly structure:
Confirmed CHoCH in early 2023 launched the bullish leg
Break of structure toward Higher High (HH) continues but weak high was created near 3500
We’re currently inside a weekly premium range, rejecting the upper quadrant
🔸 Key Weekly Confluences:
Zone Type Price Level Confluences
🔼 Resistance 3490–3500 Weak High + Premium zone + FVG + RSI divergence
🔼 Upper Range 3450–3470 Historical imbalance fill + EMA5 overextension
🔽 Support 3355–3320 Weekly OB + Discount side of premium leg + FVG
🔽 Deep Support 3200–3170 Last strong demand + BOS origin + RSI oversold risk zone
Fibonacci Range: 3500 = top of the bullish extension; 50% retracement sits around 3250
RSI (Weekly): Starting to curve down from overbought territory — watch for structure cracks
EMAs (5/21/50): Strong upside lock remains but a flattening 5EMA hints short-term slow-down
🗓 Macro + News Context:
This week is loaded with high-impact U.S. data and a parade of FOMC speakers:
Core CPI (Monday) and Retail Sales (Thursday) = critical for short-term inflation outlook
FOMC members speaking throughout the week = high chance of volatility spikes
Pre-G20 positioning (Friday–Saturday) could lead to risk-off flows or safety bids on gold
Watch Crude Oil Inventories and Building Permits for risk sentiment impact
The combination of CPI, retail sales, and continuous Fed commentary could cause abrupt sentiment swings — especially if inflation surprises to the upside again.
⚠️ What to Watch This Week:
Any weekly close above 3470 = potential sweep into weak high (3500)
Failure to hold 3355 zone = opens the door to revisit the deeper OB around 3200
Look for a lower high inside premium to confirm bearish weekly intent — otherwise we remain bullish
Any bounce from 3320 must show strong volume + FVG reaction to confirm continuation
✅ Final Notes:
This week is all about patience. We’re in a premium exhaustion phase, and with heavy macro catalysts on the table, gold is primed for a decisive breakout — up or down.
Stay flexible. Let price show its hand around the major zones. We’ll refine sniper entries on H4 and H1 once the weekly opens fully.
—
📌 If this breakdown helped, hit 🚀🚀🚀 follow @GoldFxMinds🔔 for daily updates as this structure develops and drop a comment:
Will gold sweep 3500 or collapse toward 3200? 👇
📢 Disclosure:
This analysis is based on the Trade Nation TradingView feed. I’m part of their Influencer Program and receive a monthly fee.
⚠️ Educational content only — not financial advice.

GOLD 1H CHART ROUTE MAP UPDATE & TRADING PLAN FOR THE WEEKHey Everyone,
Please see our updated 1h chart levels and targets for the coming week.
We are seeing price play between two weighted levels with a gap above at 3381 and a gap below at 3353. We will need to see ema5 cross and lock on either weighted level to determine the next range.
We will see levels tested side by side until one of the weighted levels break and lock to confirm direction for the next range.
We will keep the above in mind when taking buys from dips. Our updated levels and weighted levels will allow us to track the movement down and then catch bounces up.
We will continue to buy dips using our support levels taking 20 to 40 pips. As stated before each of our level structures give 20 to 40 pip bounces, which is enough for a nice entry and exit. If you back test the levels we shared every week for the past 24 months, you can see how effectively they were used to trade with or against short/mid term swings and trends.
The swing range give bigger bounces then our weighted levels that's the difference between weighted levels and swing ranges.
BULLISH TARGET
3381
EMA5 CROSS AND LOCK ABOVE 3381 WILL OPEN THE FOLLOWING BULLISH TARGETS
3416
EMA5 CROSS AND LOCK ABOVE 3416 WILL OPEN THE FOLLOWING BULLISH TARGET
3439
BEARISH TARGETS
3353
EMA5 CROSS AND LOCK BELOW 3353 WILL OPEN THE FOLLOWING BEARISH TARGET
3328
EMA5 CROSS AND LOCK BELOW 3328 WILL OPEN THE FOLLOWING BEARISH TARGET
3305
EMA5 CROSS AND LOCK BELOW 3305 WILL OPEN THE SWING RANGE
3288
3259
As always, we will keep you all updated with regular updates throughout the week and how we manage the active ideas and setups. Thank you all for your likes, comments and follows, we really appreciate it!
Mr Gold
GoldViewFX

GOLD 4H CHART ROUTE MAP UPDATE & TRADING PLAN FOR THE WEEKHey Everyone,
Please see our updated 4h chart levels and targets for the coming week.
We are seeing price play between two weighted levels with a gap above at 3364 and a gap below at 3297. We will need to see ema5 cross and lock on either weighted level to determine the next range.
We will see levels tested side by side until one of the weighted levels break and lock to confirm direction for the next range.
We will keep the above in mind when taking buys from dips. Our updated levels and weighted levels will allow us to track the movement down and then catch bounces up.
We will continue to buy dips using our support levels taking 20 to 40 pips. As stated before each of our level structures give 20 to 40 pip bounces, which is enough for a nice entry and exit. If you back test the levels we shared every week for the past 24 months, you can see how effectively they were used to trade with or against short/mid term swings and trends.
The swing range give bigger bounces then our weighted levels that's the difference between weighted levels and swing ranges.
BULLISH TARGET
3364
EMA5 CROSS AND LOCK ABOVE 3364 WILL OPEN THE FOLLOWING BULLISH TARGETS
3429
EMA5 CROSS AND LOCK ABOVE 3429 WILL OPEN THE FOLLOWING BULLISH TARGET
3499
EMA5 CROSS AND LOCK ABOVE 3499 WILL OPEN THE FOLLOWING BULLISH TARGET
3561
BEARISH TARGETS
3297
EMA5 CROSS AND LOCK BELOW 3297 WILL OPEN THE SWING RANGE
3242
3171
EMA5 CROSS AND LOCK BELOW 3171 WILL OPEN THE SECONDARY SWING RANGE
3089
3001
As always, we will keep you all updated with regular updates throughout the week and how we manage the active ideas and setups. Thank you all for your likes, comments and follows, we really appreciate it!
Mr Gold
GoldViewFX

GOLD DAILY CHART ROUTE MAPHey Everyone,
Daily Chart Follow Up – Structure Still in Full Control
Just a quick update on our daily structure roadmap. Price continues to respect our Goldturn levels with surgical precision.
After the previous bounce off 3272, we’ve now seen over 800 pips of upside follow through. That level once again proved its weight, holding beautifully as support and launching price firmly back toward the upper boundary.
We now have a clear gap overhead at 3433, which sits right near the channel top a familiar rejection zone. With that in play, we’re expecting a range bound dynamic to develop between 3272 and 3433 in the short term.
Here’s what we’re focusing on next:
Range scenario active:
Until price breaks out cleanly, we anticipate swings between 3433 resistance and 3272 support to play out. This is the working range for now.
EMA5 cross and lock:
Watch for a clean EMA5 break and lock, this will be our technical confirmation for whether we’re breaking out of this range or just ping ponging inside it.
Structure remains intact:
No EMA5 breakdown off 3272 during the recent test means buyers remain in control. Until that changes, dips into 3272 continue to offer structured long setups.
Key Levels This Week
Support 3272 Proven bounce zone. As long as this holds, the structure favours upside.
Resistance 3433 Open gap + channel top confluence; expect reaction and potential fade unless we break cleanly with EMA5 confirmation.
As always, we continue to let structure guide the way, measured, deliberate, and data-driven.
Thanks again for all the continued support, every like, comment, and follow is truly appreciated.
Wishing you all a focused and profitable week ahead!
Mr Gold
GoldViewFX

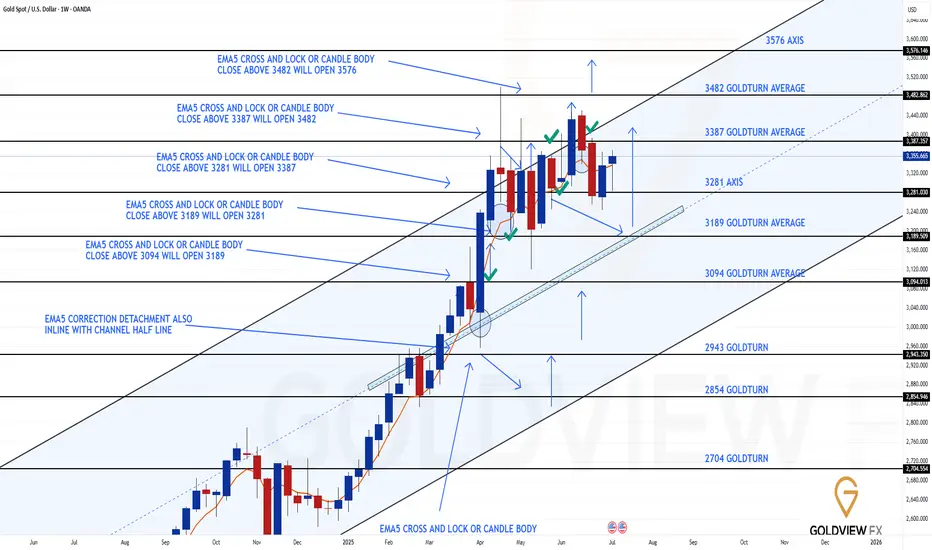
GOLD WEEKLY CHART MID/LONG TERM ROUTE MAPHey Everyone,
Please see update on our weekly chart idea.
Price delivered the rejection at the channel top, so our longer range gap at 3482 remains open overhead. The pullback rejection from channel top extended to 3281 axis precisely where buying interest stepped in, just before the rising channel mid-line, which is edging higher in tandem with price and keeping the broader structure intact.
Key take aways from the latest swing:
Support confirmed:
3281 held on a weekly closing basis, giving us the springboard we needed.
Bounce in motion:
We’ve already reclaimed the prior pivot zone and are now working on the 3387 gap fill; this is the near-term magnet before any attempt at the larger 3482 imbalance.
Structure unchanged:
The channel is still orderly, the EMA5 has curled but hasn’t locked bearishly, and the mid-line continues to ascend beneath price, favouring a measured, step wise climb.
Updated Levels to Watch:
Immediate Support 3281 Proven axis support
Resistance 1 3387 Gap fill target in progress; expect reaction.
Resistance 2 3482 Long standing weekly gap remains the bigger picture objective.
Plan: While 3281 holds, bias remains for a grind higher toward 3387 and ultimately 3482. Should 3281 fail, we reassess at the mid-line for the next structured long setup.
We remain patient and continue reacting to clean structure backed opportunities.
Mr Gold
GoldViewFX
GOLD (XAUUSD): Another Bullish Pattern
Gold perfectly respected a rising trend line on a daily and
bounce from that, as I predicted earlier.
I see a strong bullish pattern on that now.
The price formed a cup & handle pattern and closed
on Friday, testing its neckline.
The next bullish confirmation that you should look for is its breakout.
Daily candle close above 3367 level will provide a breakout validation.
A bullish continuation will be expected then.
❤️Please, support my work with like, thank you!❤️
I am part of Trade Nation's Influencer program and receive a monthly fee for using their TradingView charts in my analysis.

Gold Market Update and Recommended Strategy bulls/bears📉 Gold Holds Steady ~$3,354/oz
Moderate USD strength and tariff-driven safe‑haven buying have kept gold anchored in the $3,330–$3,360 zone.
🤝 Trade & Tariff Influence
Tariff headlines—from Canada’s 35% rate to broader threats—have supported gold by boosting safe‑haven demand heading into U.S. CPI.
📊 Technical Watch
Testing resistance at $3,360; full breakout above $3,342–$3,360 opens path to $3,400–$3,500.
Support sits at $3,330–$3,322 (20‑day EMA); breach risks pickup in short‑term bearish momentum.
💼 U.S. Macro & Fed Cues
Inflation data (June CPI due July 15) and Fedspeak ahead of the July blackout window are set to define next directional moves.
🌍 Central Bank Insight
World central banks are stockpiling gold at record rates, creating a bullish backdrop.
⚖ Range‑Bound Outlook
Expect gold to drift between $3,330–$3,360 near‑term, with upside if tariff/CPI triggers materialize.
📉 Short‑Term Bias
Neutral‑to‑bullish; momentum indicators are calm but could shift quickly on macro surprises.
📈 Med‑Term Outlook Bullish
Ongoing central bank demand, trade dynamics, and macro fundamentals still favor a gradual move toward $3,500+.
⭐ Updated Strategy Recommendations
Accumulate on dips near $3,330–$3,320.
Watch resistance at $3,360–$3,400 for profit‑taking or breakout buying opportunities.
Bears may focus on selling rallies near the upper range.
Overtrading – The Silent Threat to Consistent PerformanceTrader Psychology | Part 1: Overtrading – The Silent Threat to Consistent Performance
In trading, more does not mean better. One of the most common and damaging psychological pitfalls traders fall into is overtrading — executing too many trades, often without clear setups, simply to stay active in the market.
It’s subtle, it feels productive… but it quietly erodes both your capital and your discipline.
💡 What Is Overtrading?
Overtrading occurs when a trader opens excessive positions, often outside of their strategy or plan. It’s driven by emotions rather than logic, and usually shows up in one of the following forms:
Taking trades without confirmation
Trying to "make back" previous losses (revenge trading)
Forcing trades during low-volume market conditions
Trading simply out of boredom or anxiety about missing out
It’s not just about the number of trades — it’s about why you’re taking them.
⚠️ How to Know You're Overtrading
You're entering trades that don’t meet your criteria
You feel uncomfortable not having an active position
You trade aggressively after a loss
You switch strategies frequently
Your trading feels more like activity than decision-making
You’re losing more in fees/spread than on price movement
🧠 Why Overtrading Happens
🔹 The Need to Be "Active"
Traders often equate activity with productivity. But the truth is, patience is a trading skill — doing nothing is sometimes the most profitable move.
🔹 Pressure to Perform Daily
Some traders feel they must generate daily profits. This mindset leads to forcing trades during uncertain or low-probability conditions.
🔹 Overconfidence After Wins
A short winning streak can create the illusion of control, pushing traders to increase frequency and risk — usually without real setups to back it up.
🔻 The Cost of Overtrading
Rapid Drawdowns: Frequent small losses and transaction costs add up quickly
Emotional Fatigue: Decision-making becomes reactive instead of rational
Loss of Trust in Your System: Not because the system failed — but because it wasn’t followed
Increased Costs: Spreads, commissions, and swaps eat into your margin
Overtrading doesn’t just hurt your balance. It damages your confidence, focus, and mental capital.
✅ How to Stop Overtrading – Practical Fixes
1. Set a Daily Trade Limit
Commit to a maximum number of trades per session (e.g., 2–3 trades). This forces you to wait for the best opportunities.
2. Track Your Trades in a Journal
Log each trade: the setup, your reasoning, emotions, and outcome. Over time, this reveals emotional patterns and helps you regain discipline.
3. Trade Only During Key Market Hours
Avoid trading during illiquid sessions. Focus on London and New York overlaps, where structure and volatility are present.
4. Accept That Flat Is a Position
Not being in a trade is often a smart decision. Staying out preserves capital and prepares you for higher-probability setups.
🎯 Final Thoughts
Overtrading is not a technical flaw — it’s a psychological leak.
If you want longevity in this game, you must master more than charts — you must master yourself.
“The market doesn’t reward activity. It rewards patience, precision, and emotional control.”
Next time you feel the urge to trade "just because" — pause, breathe, and ask yourself: Is this trade part of my edge?
📌 Coming Up Next:
Trader Psychology | Part 2: FOMO – Why Fear of Missing Out Can Destroy Good Traders
🔔 Follow this profile to be notified when the next chapter is live.

Canadian Venture index --- Inverse head & shouldersGold has reached unprecedented heights, approaching the $3000 mark—a prediction we made with precision. Now is the moment to turn our attention to silver and the mining sector.
To start, let's examine the Canadian venture index, which is displaying a promising inverse head and shoulders pattern. I am confident that the logarithmic projection will be achieved without much difficulty.

Silver to $38The move from March 2020 to August 2020
Was a measured move that played out to the Tee.
We have a similar structure building that projects to the High 30's
Suggesting #Gold move beyond ATH's and #Silver the beta play to move faster in an attempt to catch up, and move towards it's high's again.

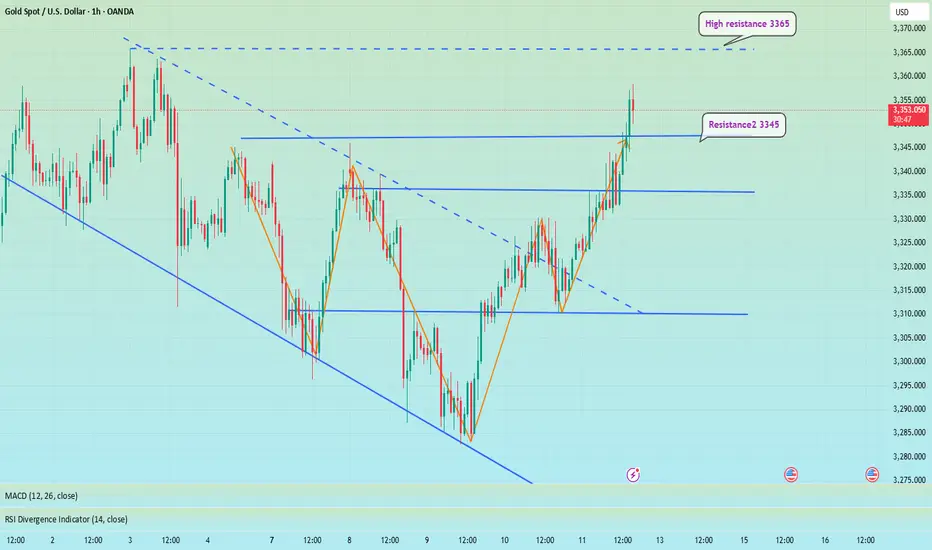
GOLD → Retest of consolidation resistance. Breakout?FX:XAUUSD is consolidating in a symmetrical triangle pattern. The price is stabilizing amid a falling dollar and uncertainty...
Gold is recovering after falling to $3,283 thanks to a weaker dollar and lower bond yields amid concerns over Trump's new tariff threats. The announced tariffs against seven countries, including Brazil and the Philippines, have heightened tensions, partially offsetting the Fed's hawkish signals. Markets are now awaiting new data from the US and speeches by Fed officials, which could influence the further dynamics of gold.
Technically, gold is squeezed between the resistance and support of a symmetrical triangle. The price is being aggressively pushed away from support within a bullish trend, but at the same time, gold is testing resistance for the fifth time, which only increases the chances of a breakout.
Resistance levels: 3330, 3345, 3358
Support levels: 3308, 3295
If gold continues to storm the local resistance at 3330 and the triangle resistance during consolidation, we will have a good chance of catching the breakout and growth. An additional scenario could be growth after a shake-up of the triangle support and the global trend.
Best regards, R. Linda!

Gold Potential UpsidesHey Traders, in today's trading session we are monitoring XAUUSD for a buying opportunity around 3,330 zone, Gold is trading in an uptrend and currently is in a correction phase in which it is approaching the trend at 3,330 support and resistance area.
Trade safe, Joe.
Gold 30Min Engaged ( Bullish Entry Detected )Time Frame: 30-Minute Warfare
Entry Protocol: Only after volume-verified breakout
🩸Bullish Break : 3305
➗ Hanzo Protocol: Volume-Tiered Entry Authority
➕ Zone Activated: Dynamic market pressure detected.
The level isn’t just price — it’s a memory of where they moved size.
Volume is rising beneath the surface — not noise, but preparation.
🔥 Tactical Note:
We wait for the energy signature — when volume betrays intention.
The trap gets set. The weak follow. We execute.

Gold - This is the official top!Gold - TVC:GOLD - might top out soon:
(click chart above to see the in depth analysis👆🏻)
Since Gold confirmed its rounding bottom in 2019 it rallied more than +200%. Especially the recent push higher has been quite aggressive, squeezing all bears. But now Gold is somehow unable to create new all time highs, which could constitute the a top formation.
Levels to watch: $3.500, $3.000
Keep your long term vision🙏🙏
Philip (BasicTrading)

Update on: "XAU USD a little & nice BUY set up" 11-07-2025Quick update : I did "collect" a bit earlier (Unlucky I haven't got possibility to monitor trade all the way down today ), TP @ 3365.405.... Like I said earlier, a little & nice trade!
Also, did hit TP around - 3367.188 as promised ! AAA+ trade !
All analysis is based on technical analysis only...
Short & clear without any "BS"...
I do not believe in fundamental analysis (& if you are desperate for it, then... gold is never going to get cheaper in a very long term & it is a good investment for the next 50-100+ years, if you are happy with "preserving" your wealth, but if you are looking get paid this or next week, then...trading is a way. )
All of you have a lovely weekend ( with a nice profit in the pocket ! )

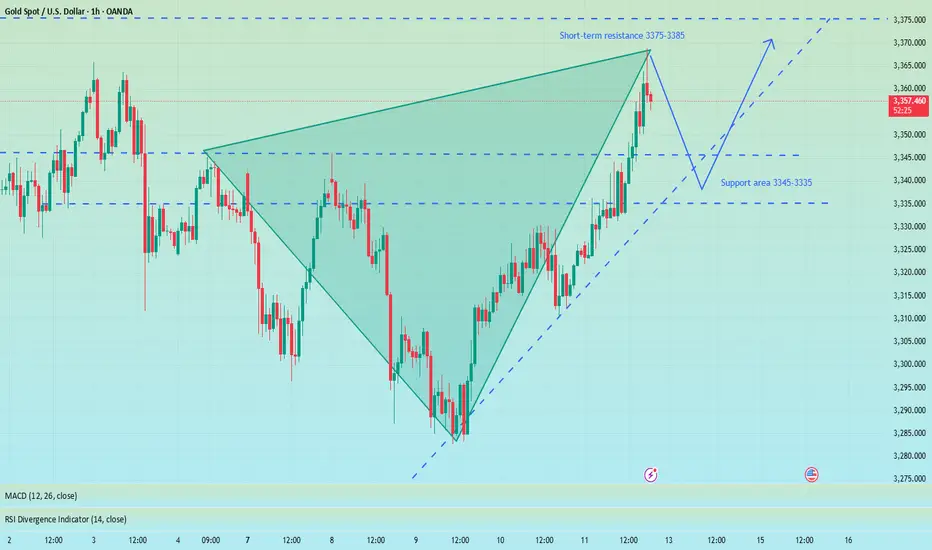
Precisely look at 3365 and pay attention to the pullback chanceAt present, gold has risen as expected and reached the highest level near 3368. The upper 3375-3385 constitutes a short-term resistance level. At present, the bullish momentum is still relatively strong, and the short-term support structure below has been formed. I still maintain the views of the previous transaction and wait for a second trading opportunity when it pulls back below. Although the 1H chart shows that the current trend remains strong and the retracement is small, it is necessary to remain cautious - even if the market is strong, it is not recommended to chase long easily, and the risk of a deep correction in the gold price must be guarded against. First, pay attention to the support area of 3345-3335 below. If it falls back to this level, you can consider going long with a light position.
OANDA:XAUUSD
XAUUSDSELL Plan XAUUSD
GOLD rejecting from 4h resistance zone book partial profits risk free once yuo got 1:1
Best of luck

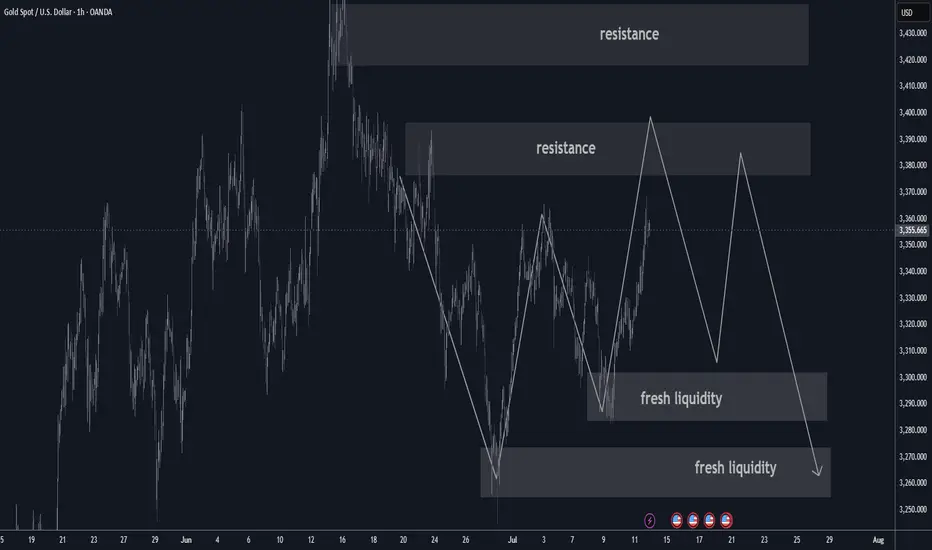
Gold. The plan for the next few days.The nearest resistance zones are where it's interesting to look for purchases. We are waiting for a reaction and looking for an entry point.
The post will be adjusted if there are any changes.
Don't forget to click on the Rocket! =)

GOLD Rising Support Ahead!
HI,Traders !
#GOLD made a sharp
And sudden move down
And the pair is oversold
So after it retest the rising
Support line we will be
Expecting a local bullish
Correction and a move up !
Comment and subscribe to help us grow !

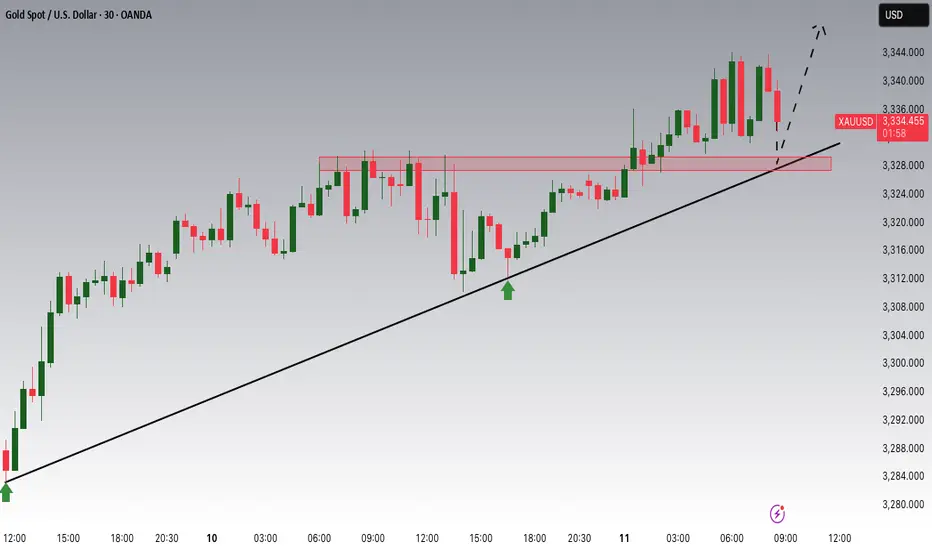
GOLD ROUTE MAP UPDATEHey Everyone,
Great finish to the week!!!
After completing our Bearish targets throughout the week, we got the swing perfectly, like we analysed and was waiting for our Bullish target to be complete.
- We got the Bullish target at 3358 HIT perfectly completing this range!!
BULLISH TARGET
3358 - DONE
BEARISH TARGETS
3330 - DONE
EMA5 CROSS AND LOCK BELOW 3330 WILL OPEN THE FOLLOWING BEARISH TARGET
3306 - DONE
EMA5 CROSS AND LOCK BELOW 3306 WILL OPEN THE SWING RANGE
3283 - DONE
We will now come back Sunday with a full multi timeframe analysis to prepare for next week’s setups, including updated views on the higher timeframes, EMA alignments, and structure expectations going forward.
Thanks again for all your likes, comments, and follows.
Wishing you all a fantastic weekend!!
Mr Gold
GoldViewFX

The idea remains unchanged, NY3360-3365 is emptyThe idea remains unchanged during the NY period. Although gold has currently reached a high of around 3348, it has not stabilized above it. If gold successfully breaks through 3350 in the short term, it may reach 3360 or 3365. In the 4H cycle, it presents a step-by-step upward pattern. The K-line is temporarily fluctuating sideways near the upper track. At the same time, 3345 has formed a double top pattern. Combined with Thursday's low of 3310, an inverted triangle oscillation range of 3345-3310 is formed in the short term. This week's trend needs to pay close attention to the breakthrough direction of this range. Short-term long positions can be taken after the trend is confirmed.
XAUUSD@3330-3320 long TP 3345-3365
OANDA:XAUUSD

Breaking through 3350, the bullish trend remains unchanged📰 News information:
1. Pay attention to the impact of Trump administration tariffs
📈 Technical Analysis:
Possible interest rate cuts and tariffs in the fall continue to stimulate risk aversion. Currently, the 3300-3285-3310 points form a head and shoulders bottom pattern. The bullish momentum is relatively strong in the short term. Our short trade near 41 has hit the stop loss. As I wrote before, gold may continue to rise to 3360 or 3365 after breaking through 3350. The current RSI indicator is seriously oversold, so be cautious when operating in a unilateral trend in the short term. The safe way is to wait for a pullback to 3345-3340 to go long
🎯 Trading Points:
BUY 3345-3340
TP 3360-3370-3400
In addition to investment, life also includes poetry, distant places, and Allen. Facing the market is actually facing yourself, correcting your shortcomings, facing your mistakes, and exercising strict self-discipline. I share free trading strategies and analysis ideas every day for reference by brothers. I hope my analysis can help you.
TVC:GOLD FXOPEN:XAUUSD