GOLD - SHORT TO $2,800 (UPDATE)Another beautiful, bearish rejection from our resistance zone on Gold. Our 1st resistance zone of $3,350 is still holding.
If buyers take out this level, another zone to watch out for is the $4,006 - $4,022 zone as there is a lot of pending liquidity sitting around that zone.
Gold

Gold 1H Intra-Day Chart 07.07.2025Option 1: Gold rejects from CMP & drops towards $3,286.
Option 2: Gold keeps moving higher into another strong demand zone of $3,416.
Which scenario do you find more likely?

GOLD - SHORT TO $2,800 (UPDATE)Gold has started the week extremely bearish, down 450 PIPS since last night at market open. This puts our 'Sell Trade' in 480 PIPS profit so far. Great start to the week.

GOLD 4H CHART ROUTE MAP UPDATEHey Everyone,
Please see update on our 4H Chart route map, also playing out perfectly with our levels being respected, as analysed.
We have our bearish target hit at 3295 and currently testing for support and bounce. Ema5 cross and lock below this level will open the swing range and failure to lock will see price reject and head up for the Bullish target. The 1h chart route map from yesterdays update also has the swing range open, which we need to keep in mind when planning to buy dips.
We will keep the above in mind when taking buys from dips. Our updated levels and weighted levels will allow us to track the movement down and then catch bounces up.
We will continue to buy dips using our support levels taking 20 to 40 pips. As stated before each of our level structures give 20 to 40 pip bounces, which is enough for a nice entry and exit. If you back test the levels we shared every week for the past 24 months, you can see how effectively they were used to trade with or against short/mid term swings and trends.
The swing range give bigger bounces then our weighted levels that's the difference between weighted levels and swing ranges.
BULLISH TARGET
3364
EMA5 CROSS AND LOCK ABOVE 3364 WILL OPEN THE FOLLOWING BULLISH TARGETS
3429
EMA5 CROSS AND LOCK ABOVE 3429 WILL OPEN THE FOLLOWING BULLISH TARGET
3499
EMA5 CROSS AND LOCK ABOVE 3429 WILL OPEN THE FOLLOWING BULLISH TARGET
3499
EMA5 CROSS AND LOCK ABOVE 3499 WILL OPEN THE FOLLOWING BULLISH TARGET
3561
BEARISH TARGETS
3295 - DONE
EMA5 CROSS AND LOCK BELOW 3295 WILL OPEN THE SWING RANGE
3242
3171
EMA5 CROSS AND LOCK BELOW 3171 WILL OPEN THE SECONDARY SWING RANGE
3089
3001
As always, we will keep you all updated with regular updates throughout the week and how we manage the active ideas and setups. Thank you all for your likes, comments and follows, we really appreciate it!
Mr Gold
GoldViewFX

Macro Moves & Market Reversals: BTC-Metals-Tech-Dollar & more! 🤖📊 Macro Moves & Market Reversals: Bitcoin, Metals, Tech, Dollar & DAX Breakdown 🔥💹
Hey beautiful people,
FXPROFESSOR here with a massive market update to kick off the week. This one’s for my serious traders—those of you ready to read the market like a pro 📚💡
We’re in a critical transition. The Trump–Powell standoff, rate cut games, tariff escalations, and a surprising shift in risk appetite across bonds, metals, and equities are reshaping the entire trading landscape.
Let’s get into the full breakdown 👇
🧠 MACRO FIRST – THE FUNDAMENTAL PULSE
🟢 Interest Rates:
The Fed is keeping rates steady at 4.25%–4.50%, citing strong jobs data. 147K jobs added, unemployment at 4.1%. The market wanted bad news for rate cuts... didn’t get it.
🗓 September remains the most likely cut, but the Fed isn’t rushing. Strong labor = slow policy change.
⚠️ Tariffs Heating Up:
Trump just slapped 25–40% tariffs on imports from Japan, Korea, and others – effective August 1.
➡️ If no political resolution by July 9, prepare for a volatility wave.
Tariffs = supply chain risks + cost-push inflation.
💣 Geopolitics:
Middle East tensions remain background noise, but no major disruptions for now. Still, oil remains sensitive.
📈 Risk Appetite (Bonds):
U.S. Treasuries still lagging, but junk bonds and quality credit (LQD) have pumped. That’s a big clue: risk appetite is returning, even without a Fed pivot.
📉 DOLLAR INDEX (DXY) – "THE YEAR OF THE NORMALIZED DOLLAR"
We’ve followed this dollar short all year.
🔻 From rejection at 100.965, DXY dropped straight into our long-term 94–95 target zone.
📌 Now what? This level is MAJOR. A bounce could trap dollar bears.
🧭 No new short from me unless we re-tag 100+. The juice is squeezed.
Key takeaway:
The dollar already priced in rate cuts, and we didn’t even get them. That’s telling me the next macro move might not be so predictable.
💰 BITCOIN – STILL THE KING
📍 BTC at $115K resistance – a level I’ve charted for years, not weeks.
Three hits:
1️⃣ First rejection
2️⃣ Second rejection
3️⃣ And now... a decisive moment
🚨 Break 115K → BTC flies.
📉 Fail here → we could revisit $64K, yes, seriously. I’m ready for both outcomes.
This is not the time for hopium. It’s 50/50.
🪙 BTC DOMINANCE – THE ALTCOIN SWITCH
BTC.D is now above 65%. That means:
✔️ Capital flowing back into BTC
❌ Altcoins not ready yet
We don’t chase alts until BTC.D hits 71.3–72.9%. That’s the real “altseason trigger zone.”
🔒 I’m personally turned off from alts for now—too much noise, too many memes, not enough macro support.
🔩 PRECIOUS METALS – SHINING BRIGHT
💛 Gold (XAU/USD):
Reached near $3,500 highs
Now stalling
🛑 Taking profits here – caution warranted.
🤍 Silver (XAG/USD):
13-year high
Holding $36+ well
Potential breakout pending global inflation data
💿 Platinum (the sleeper):
+47% YTD
Beautiful long setup played out exactly as planned
Still bullish above $1,400 if supply squeeze continues
💡 ETFs in metals are seeing inflows – more institutions hedging as dollar weakens.
🚗🔌 TECH STOCKS – NVDA, TSLA & THE NASDAQ
📈 NVIDIA (NVDA)
Best trade of the year for me
Clean re-entry, now hitting ATH levels
AI demand + tight supply = rocket fuel
⚡ Tesla (TSLA)
Bounce off 4H trendline
Still lagging slightly – political tensions (Trump vs. Musk) not helping
But levels are working like a charm
📊 NASDAQ (QQQ)
Hit our “max pain” zone perfectly
Rebounded with textbook precision
Momentum intact – watching for new highs
🇩🇪 DAX INDEX – CHARTS DON’T LIE
All-time high. Boom. Called it weeks ago.
Despite:
No Russian energy
Industrial drag
ECB policy constraints
📌 But what worked?
➡️ Simple chart structure.
➡️ Market psychology.
➡️ Pure TA.
Now at resistance again. Watch carefully – support below is clearly defined.
🧾 FINAL THOUGHTS – THE PROFESSOR'S NOTES
🔹 The market’s narrative can change fast, especially with Trump in the mix. He’s Mr. Volatility.
🔹 Powell holds the real power – and right now, he’s not flinching.
🔹 Risk appetite is back – but not evenly. Bitcoin is leading, altcoins are lagging, metals are maturing.
🔹 If rate cuts materialize in September, expect massive rotation across all risk assets.
💭 Until then, I’m playing level-to-level. No FOMO. Just charts and logic. That’s how we survive, and thrive.
Let me know which chart you want next – and thank you for staying sharp 💪📚
One Love,
The FXPROFESSOR 💙
Disclosure: I am happy to be part of the Trade Nation's Influencer program and receive a monthly fee for using their TradingView charts in my analysis. Awesome broker, where the trader really comes first! 🌟🤝📈

GOLD: Move Up Expected! Long!
My dear friends,
Today we will analyse GOLD together☺️
The market is at an inflection zone and price has now reached an area around 3,298.60 where previous reversals or breakouts have occurred.And a price reaction that we are seeing on multiple timeframes here could signal the next move up so we can enter on confirmation, and target the next key level of 3,312.65.Stop-loss is recommended beyond the inflection zone.
❤️Sending you lots of Love and Hugs❤️

XAU/USD : Gold is falling , When it Stops? (READ THE CAPTION)By analyzing the gold chart on the 4-hour timeframe, we can see that, in line with our latest analysis, the bearish momentum has continued—and even more strongly than expected. Gold has broken below the key $3300 level and is currently trading around $3294.
Given the strong momentum, further downside is likely. The next bearish targets are $3289, $3276, $3262, and $3254.
All key supply and demand zones are clearly marked on the chart.
(And if you're looking for more precise trading levels, just drop a comment and I'll guide you.)

US tariff deadline, GOLD expected to fluctuate very stronglyInvestors will be keeping an eye on tariff news from Washington this week as the temporary suspension of punitive import duties is set to expire. If trade tensions do not escalate further after Wednesday’s deadline, that could be good for the market, while downside risks are also a negative for OANDA:XAUUSD in particular.
News Around US Tariffs
To avoid higher tariffs, negotiators from more than a dozen major US trading partners are racing against time to negotiate with the Trump administration, trying to reach a deal before July 9. Trump and his team have continued to apply pressure in recent days.
Trump announced a deal with Vietnam to lower the 20% tariffs he had promised on many Vietnamese exports, while talks with Japan, the United States’ most important ally in Asia and sixth-largest trading partner, appeared to be stalled, even as Washington hinted it was close to a deal with India.
In data
Nonfarm payrolls data released Thursday showed the U.S. added 147,000 jobs in June, beating market expectations, and the unemployment rate fell to 4.1%.
Despite the slowdown in private-sector hiring, the overall strong report prompted markets to lower expectations for a Federal Reserve rate cut in July.
According to the CME FedWatch Tool, the probability of a rate cut has dropped sharply from 24% to 4.7%. Fed Chairman Powell reiterated that the central bank will not ease its stance until there are more signs of cooling in employment and inflation.
Personal Comments
The market is following a number of factors:
On the one hand, there is a countdown to Trump's "final blow" on tariffs, and on the other hand, the non-farm data has poured cold water once again. As the Fed's stance fluctuates, the US Dollar faces a tug-of-war between long and short positions, while gold continues to stabilize technically or has had significant price increases. July 9 of this month could be a key moment to really test the sustainability of gold in this recovery.
Technical Outlook Analysis OANDA:XAUUSD
Gold has recovered significantly over the past week, since finding support from the $3,250 area, but the temporary recovery is still limited by the EMA21 followed by the 0.236% Fibonacci retracement level.
However, sustained price action above the $3,300 raw price point should be viewed as a positive signal as it helps gold stabilize within the price channel.
If gold rises and breaks above the 0.236% Fibonacci retracement level, it will be eligible to continue rising with a short-term target of around $3,400 rather than a horizontal resistance of $3,430.
The indecision sentiment is shown by the RSI activity, which is mostly moving around the 50 level. RSI above 50 is considered a positive signal, while RSI below 50 is considered a negative signal, but gold is currently in the middle of this point.
Overall, gold has not yet had a short-term trend, but in the long-term, gold prices are still in an upward trend, which is noted by the price channel.
Finally, the notable positions will be listed as follows.
Support: 3,300 – 3,292 – 3,250USD
Resistance: 3,350 – 3,371 – 3,400USD
SELL XAUUSD PRICE 3334 - 3332⚡️
↠↠ Stop Loss 3338
→Take Profit 1 3326
↨
→Take Profit 2 3320
BUY XAUUSD PRICE 3275 - 3277⚡️
↠↠ Stop Loss 3271
→Take Profit 1 3283
↨
→Take Profit 2 3289

The shock continues, and the retracement continues to go long📊 Gold Day Trading Strategy (Recommendation index ⭐️⭐️⭐️⭐️⭐️)
📰 News information:
1. The lasting impact of new tariffs
2. The impact of geopolitical conflicts
3. The Fed’s interest rate cut
📈 Technical Analysis:
From the hourly chart, gold has formed a head and shoulders bottom. At present, 3320 below has formed a certain support in the short term. For now, the daily line still cannot close below 3320. If the daily line closes below 3320, the decline may open further. On the contrary, the current upper suppression position of gold is near 3350. If the daily line stands above 3350 again, it will be a bull-dominated trend and may test 3380-3390 above. In the short term, pay attention to the support line of 3325-3315 below. If it retreats to the support level, you can consider going long. Look to the resistance range of 3340-3350 above, and pay special attention to the suppression line of 3365-3370. At the same time, if the European session is always suppressed below 3345 and sideways, there is no performance, so you should consider selling it, and there may be further retreat in the evening.
🎯 Trading Points:
BUY 3330-3325-3315
TP 3340-3350-3365
In addition to investment, life also includes poetry, distant places, and Allen. Facing the market is actually facing yourself, correcting your shortcomings, facing your mistakes, and exercising strict self-discipline. I share free trading strategies and analysis ideas every day for reference by brothers. I hope my analysis can help you.
TVC:GOLD OANDA:XAUUSD FXOPEN:XAUUSD FX:XAUUSD FOREXCOM:XAUUSD PEPPERSTONE:XAUUSD

Gold Finds Supports – Is the Rebound About to Begin?Gold ( OANDA:XAUUSD ) declined to the Support zone($3,312-$3,290) and Support lines as I expected in the previous idea .
Gold is currently trading in the Support zone($3,312-$3,290) and near a set of support lines .
In terms of Elliott Wave theory , it seems that Gold has completed the Zigzag Correction(ABC/5-3-5 ) and we should wait for the next 5 impulse waves . One of the confirmation signs of the end of these corrective waves could be the break of the resistance line .
I expect Gold to trend higher in the coming hours and rise to at least $3,343 AFTER breaking the Resistance line .
Second Target: $3,364
Note: Stop Loss (SL) = $3,287
Gold Analyze (XAUUSD), 1-hour time frame.
Be sure to follow the updated ideas.
Do not forget to put a Stop loss for your positions (For every position you want to open).
Please follow your strategy; this is just my idea, and I will gladly see your ideas in this post.
Please do not forget the ✅ ' like ' ✅ button 🙏😊 & Share it with your friends; thanks, and Trade safe.

GOLD: Long Signal Explained
GOLD
- Classic bullish setup
- Our team expects bullish continuation
SUGGESTED TRADE:
Swing Trade
Long GOLD
Entry Point - 3311.9
Stop Loss - 3305.4
Take Profit - 3324.3
Our Risk - 1%
Start protection of your profits from lower levels
Disclosure: I am part of Trade Nation's Influencer program and receive a monthly fee for using their TradingView charts in my analysis.
❤️ Please, support our work with like & comment! ❤️

GOLD - SHORT TO $2,800 (UPDATE)Gold once again last night came back to test our resistance zone, after huge bullish momentum all yesterday. But again we saw a bearish rejection from our ‘supply zone’, pushing price back down 300 PIPS.
Being extremely careful here, as Gold is currently at a make or break sort of area.

Gold Recovers on Safe-Haven Flows Amid U.S. Trade UncertaintyFX:XAUUSD – Market Overview
Fundamental Outlook:
Gold has recovered from prior losses, stabilizing on the back of renewed safe-haven demand amid escalating global trade tensions.
Analysts point to growing concerns over a broader U.S.-led trade war, which has pushed investors toward gold as a defensive asset. While President Trump has delayed the reimplementation of tariffs until August 1 to allow for negotiation, markets remain cautious, and volatility is expected to persist.
Technical Outlook:
Gold is currently trading above the pivot level at 3320, which has a consolidation within 3320 - 3342 range
Stability above 3342 would likely extend the rally toward 3365, with 3356 as an intermediate resistance.
However, a 1H candle close below 3320 could shift momentum back to bearish, targeting 3297 and 3281.
Support Levels: 3312 / 3297 / 3281
Resistance Levels: 3342 / 3356 / 3365

GBP/USD : Get Ready for Another Fall!By analyzing the GBP/USD chart on the 4-hour timeframe, we can see that after reaching 1.36800—filling the targeted FVG as expected—the price faced selling pressure once again and has since dropped to around 1.35690.
The first target at 1.35630 is now within reach. After collecting liquidity below this level and a possible short-term bounce, we can expect another bearish continuation on GBPUSD.
Key supply zones to watch are 1.36180–1.36465 and 1.36940.
Key demand zones are located at 1.35630, 1.35100, and 1.34880.
THE MAIN ANALYSIS :

Gold Rebounds Toward $3,350Gold (XAU/USD) rebounded from a five-day low of $3,297, climbing toward $3,350 after Trump announced 25% tariffs on Japan and South Korea effective August 1, with 12 more countries receiving similar tariff warnings ranging between 25% and 40%. The rising risk of a global trade war fueled safe-haven demand, though gold’s gains were capped by simultaneous US Dollar strength.
Resistance is at $3,365, while support holds at $3,300.
80k BTC On The Move - WHAT It Means 80,000 BTC Wallet Movement (2011 Miner)
• Source: 8 wallets containing 10,000 BTC each — mined in 2011, dormant for 14 years
• Total Value: Over $8.6 billion USD
• Timing: Moved on July 4, 2025 — largest dormant BTC transfer in history
• New Addresses: Funds moved to modern SegWit wallets
• Probable Owner: Likely a single early miner with 200k+ BTC history
Possible Reasons for the Move
• Key Rotation: Upgrading to modern wallets for better security
• Recovered Access: Private keys may have been recently recovered
• Market Strategy: Positioning for profit-taking or major sell-off
• Yield Farming: Preparing COINBASE:BTCUSD for use in DeFi/lending platforms
• Collateral Use: Possibly for loans, stablecoin leverage, or RWAs
• Estate Planning: Legal restructuring or generational wealth setup
• OTC Transfer: Could be prepping for off-exchange institutional sale
• Psychological Warfare: Could be intended to spook or manipulate the market
• Regulatory Response: Aligning with new compliance or tax jurisdiction
Market Reaction
• COINBASE:BTCUSD Price Dip: Price briefly fell below $108,000 post-move
• ETF Context: Movement occurred despite record ETF inflows
Key Note: These wallets had not been touched since COINBASE:BTCUSD was worth ~$0.78. Their reactivation adds uncertainty and opportunity in a fragile macro environment.
• What to do????: Watch the orderbook to find these large bitcoin moves in case of exchange selling
Near term support & resistance
$106000 support
$109500 first resistance
👍 If this breakdown helped your trading, smash that Like and drop a comment below—let me know what you think will happen with the 80k COINBASE:BTCUSD . 👍
Best Reguards
MartyBoots, 17-year market trader

XAUUSD Trading Strategy – July 8, 2025Gold (XAUUSD) is trading around 3,331 USD as global markets react to a series of critical economic data releases. The recent rally has brought prices back to a key resistance zone, but selling pressure remains strong due to the following factors:
- The Dollar Index (DXY) TVC:DXY holds steady near 97, its highest level in five weeks. A strong USD continues to weigh on gold, a non-yielding asset.
- U.S. 10-year Treasury yields remain stable at 4.35%, reinforcing expectations that the Federal Reserve will maintain higher interest rates for longer to tame inflation.
- Robust U.S. labor market data and June’s Core PCE figures staying above the Fed’s 2% target further reduce the likelihood of a rate cut in Q3 or Q4.
- Geopolitical tensions remain muted, with no significant escalations in the Russia–Ukraine conflict or Middle East unrest, weakening gold’s safe-haven appeal.
➡ Collectively, these factors suggest that gold’s recent rebound could be a technical pullback within a broader downtrend, unless a new catalyst drives a breakout.
1. XAUUSD Technical Analysis – Daily Chart (D1)
Price is currently testing the 3,331 – 3,340 USD resistance zone, which includes:
A previous supply zone that has rejected multiple rallies.
- Fibonacci retracement 0.5–0.618 from the recent high at 3,405 USD.
- A key Change of Character (CHoCH) area, where trend reversals have previously occurred.
- EMA20 and EMA50 remain aligned downward, confirming the dominant bearish trend.
- RSI hovers around 50 with signs of mild bearish divergence, reflecting weakening bullish momentum.
➡ The current price action fits a classic “sell on rally” setup, with repeated rejections at technical resistance zones.
2. Key Price Levels to Watch
Technical Significance
- 3,340 – 3,331 Confluence resistance (Fibo 0.5–0.618 + supply + CHoCH)
- 3,310 – 3,300 Nearest support – role reversal zone
- 3,275 – 3,260 Short-term target support – June’s low
- 3,223 – 3,205 Strong medium-term support – April’s low + extended Fibo
3. Suggested XAUUSD OANDA:XAUUSD Trading Strategy
Primary Strategy: SELL if price rejects 3,340 – 3,345
Entry: 3,340 – 3,345
Stop Loss: 3,356
Take Profit 1: 3,335
Take Profit 2: 3,330
Take Profit 3: 3,325
Ps : Gold is trading at a critical price zone. If XAUUSD fails to break above the 3,340 USD resistance, there’s a high probability of a pullback toward the lower support levels. Selling at resistance and targeting support remains the preferred approach in the current macro environment, which continues to favor bearish momentum.
This strategy will be updated regularly – save it and follow to avoid missing upcoming opportunities.
Analysis by @Henrybillion

#OTHERS.D ~ Do you believe in Castles in the SKY?I believe that the Others dominance metric divided by an ounce of real money #Gold gives us a valuable insight into the fabled altseasons.
Because as this chart shows theres only been 4 in actuality
and you normal get a double bubble in a cycle.
So I believe we are at the cusp of turning things around as most people have given up on the concept of altcoins ever pumping again.
But it was just the business cycle #PMI that has depressed prices for the past few years.

GOLD BUY ZONES Gold Buy Zone We Have
Bullish Engulfing Area ( 3317 - 3311 )
Order Block Area ( 3304 - 3295 )
Target We Are Expect Previous High Lets Gooo

GOLD Is Very Bullish! Long!
Here is our detailed technical review for GOLD.
Time Frame: 4h
Current Trend: Bullish
Sentiment: Oversold (based on 7-period RSI)
Forecast: Bullish
The market is trading around a solid horizontal structure 3,324.35.
The above observations make me that the market will inevitably achieve 3,358.66 level.
P.S
The term oversold refers to a condition where an asset has traded lower in price and has the potential for a price bounce.
Overbought refers to market scenarios where the instrument is traded considerably higher than its fair value. Overvaluation is caused by market sentiments when there is positive news.
Disclosure: I am part of Trade Nation's Influencer program and receive a monthly fee for using their TradingView charts in my analysis.
Like and subscribe and comment my ideas if you enjoy them!

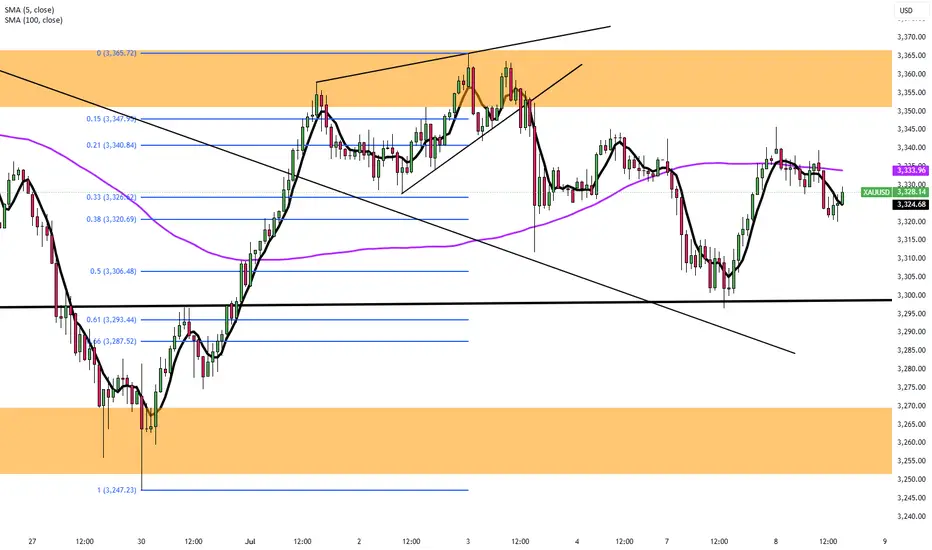
DeGRAM | GOLD rebound📊 Technical Analysis
● Price is coiling inside a contracting triangle whose base sits on the blue up-sloping support line (~3 312); successive higher reaction-lows signal buyers defending trend structure.
● A 1 h candle through the triangle top 3 330 would confirm breakout and allow a run to the June swing cap at 3 345, with the pattern’s measured move aligning with the channel mid-band at 3 389.
💡 Fundamental Analysis
● Powell’s testimony hinting at “better balance” in the labour market trimmed 2-yr real yields, while latest IMF data show central-bank gold buying expanding for a fourth month, underpinning spot demand.
✨ Summary
Long 3 312-3 330; breakout >3 330 targets 3 345 → 3 389. Bull view void on an H1 close below 3 300.
-------------------
Share your opinion in the comments and support the idea with a like. Thanks for your support!

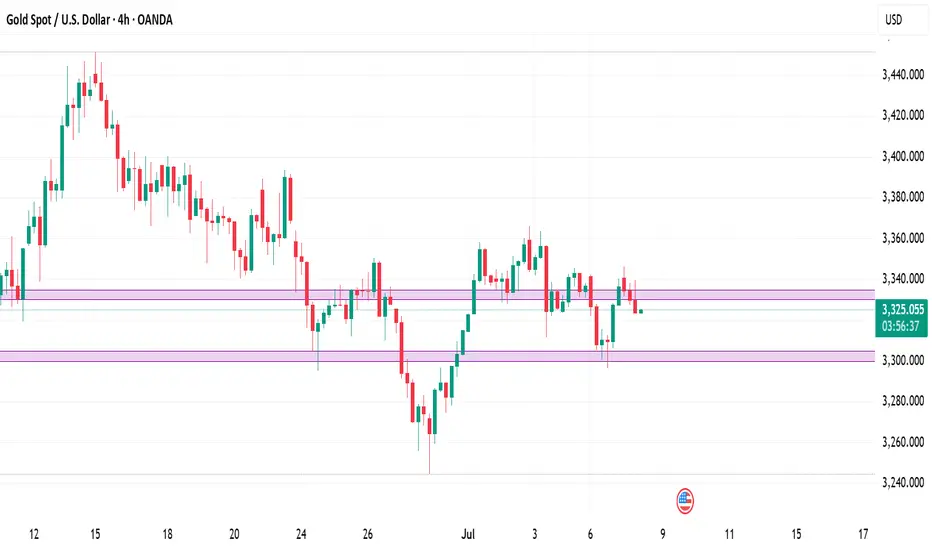
4‑Hour Technical Framework- 8th July 2025Current Price: ~$3,330
Timeframe Focus: 4‑Hour and 1‑Hour
Directional Bias: Neutral-to-Bearish
Methodologies Used:
✅ Price Action, Fibonacci Levels, Support & Resistance
✅ Supply & Demand Zones
✅ ICT / Smart Money Concepts (BOS, CHoCH, Liquidity, OB, FVG)
4‑Hour Market Structure Analysis
Gold has shifted into a neutral-to-bearish regime on the 4‑hour timeframe, after a decisive Break of Structure (BOS) below prior swing lows at ~$3,345 and a clear Change of Character (CHoCH) as bulls failed to sustain above the ~$3,350 level. Price currently hovers around ~$3,330, consolidating within a bearish Fair Value Gap (FVG) left by the recent impulsive drop.
Key Observations:
A liquidity grab above $3,349 (stop sweep) preceded a sharp reversal, validating this as a sell-side liquidity zone.
The 4H supply zone / bearish Order Block (OB) at $3,345–$3,350 remains unmitigated and likely to attract sellers.
Immediate downside is cushioned by a 4H demand zone & FVG at $3,300–$3,305, which has acted as support during the prior dip.
A deeper daily demand zone rests around $3,280–$3,290, which aligns with historical support and unmitigated buy‑side liquidity.
Key 4‑Hour Levels to Watch
Price Level Type Notes
$3,360–$3,365 Supply / Fib 61.8% Strong resistance
$3,345–$3,350 Supply / OB + 50% Fib Primary sell zone
$3,330–$3,334 Bearish FVG Active imbalance
$3,300–$3,305 Demand / FVG Primary buy zone
$3,280–$3,290 Demand (daily OB) Secondary buy zone
The neutral-to-bearish bias is reinforced by the fact that price has failed to reclaim prior support and continues to respect supply zones.
1‑Hour Intraday Trade Ideas
Zooming into the 1‑hour chart, we align intraday setups with the broader 4H directional bias: selling into supply and covering into demand.
Setup 1: Short at 4H Imbalance
Entry: ~$3,332–$3,334 (inside active FVG)
Stop-Loss: Above $3,335
Targets:
TP1: $3,305
TP2: $3,280
Confluences: BOS + CHoCH, 4H FVG, sell‑side liquidity above.
Setup 2: Short on Retracement
Entry: ~$3,345–$3,350 (50% Fib + OB)
Stop-Loss: Above $3,352
Targets: Same as Setup 1.
Setup 3: Aggressive Long (Countertrend)
Entry: ~$3,300–$3,305 (demand + FVG)
Stop-Loss: Below $3,295
Target: $3,327
Note: Only valid if strong bullish reaction occurs in demand.
The Golden Setup
Sell at ~$3,332–$3,334 (active 4H imbalance) with a target of $3,300.
This setup offers maximum confluence — bearish FVG, BOS, and supply rejection — with tight risk parameters and favorable reward/risk ratio.
Summary Table
Bias Levels of Interest
Directional Bias Neutral-to-Bearish
Strong Sell Zones $3,330–$3,334 and $3,345–$3,350
Strong Buy Zones $3,300–$3,305 and $3,280–$3,290
Closing Notes
Gold continues to respect Smart Money footprints on the 4‑hour chart, suggesting more downside unless bulls reclaim $3,350 decisively. Today’s focus remains on short opportunities at premium levels into supply and imbalances, targeting well‑defined demand areas below.
Watch price action closely in the $3,332–$3,334 zone for the highest‑probability short entry of the session — The Golden Setup.
XAUUSD Outlook: How Risk Sentiment Could Shape the Next MoveI’m currently analysing XAUUSD (Gold) 🟡, which has come under bearish pressure 📉, showing signs of downside momentum. In the video 🎥, we also explore the inverse correlation between Gold and risk assets like the NASDAQ 📊.
Keep a close eye on NASDAQ movements—if risk assets break bullish 🚀, we may see further weakness in Gold. On the other hand, if risk sentiment shifts and risk assets break bearish 🛑, Gold could attract safe-haven demand and gain strength 💪.
We also dive into the price action, market structure, and pull up the volume profile 🧩. Gold is currently trading around the Point of Control (POC) ⚖️—a key level where significant volume has accumulated. A clean break above or below this area could act as a technical trigger for the next move 📈📉.
As always, this is not financial advice ⚠️—just my market view.
