Gold corrective pullback support at 3268The Gold remains in a bullish trend, with recent price action showing signs of a corrective pullback within the broader uptrend.
Support Zone: 3268 – a key level from previous consolidation. Price is currently testing or approaching this level.
A bullish rebound from 3268 would confirm ongoing upside momentum, with potential targets at:
3345 – initial resistance
3365 – psychological and structural level
3386 – extended resistance on the longer-term chart
Bearish Scenario:
A confirmed break and daily close below 3268 would weaken the bullish outlook and suggest deeper downside risk toward:
3250 – minor support
3225 – stronger support and potential demand zone
Outlook:
Bullish bias remains intact while the Gold holds above 3268. A sustained break below this level could shift momentum to the downside in the short term.
This communication is for informational purposes only and should not be viewed as any form of recommendation as to a particular course of action or as investment advice. It is not intended as an offer or solicitation for the purchase or sale of any financial instrument or as an official confirmation of any transaction. Opinions, estimates and assumptions expressed herein are made as of the date of this communication and are subject to change without notice. This communication has been prepared based upon information, including market prices, data and other information, believed to be reliable; however, Trade Nation does not warrant its completeness or accuracy. All market prices and market data contained in or attached to this communication are indicative and subject to change without notice.
Gold

H4 Gold AnalysisThis is my set up,
this is what i look.
always DYOR
always protect your equity and use a risk management

Gold Under Pressure After NFP Beat – More Downside Ahead?Moments ago, the US Non-Farm Payrolls surprised to the upside at 147K (vs 111K forecast), while the Unemployment Rate dropped to 4.1% (vs 4.3% expected) .
This stronger-than-expected labor market data reinforces the idea that the Fed has no immediate reason to cut rates. As a result, the USD( TVC:DXY ) strengthened, and gold came under renewed selling pressure.
If the dollar momentum continues, Gold ( OANDA:XAUUSD ) may face further downside in the short term.
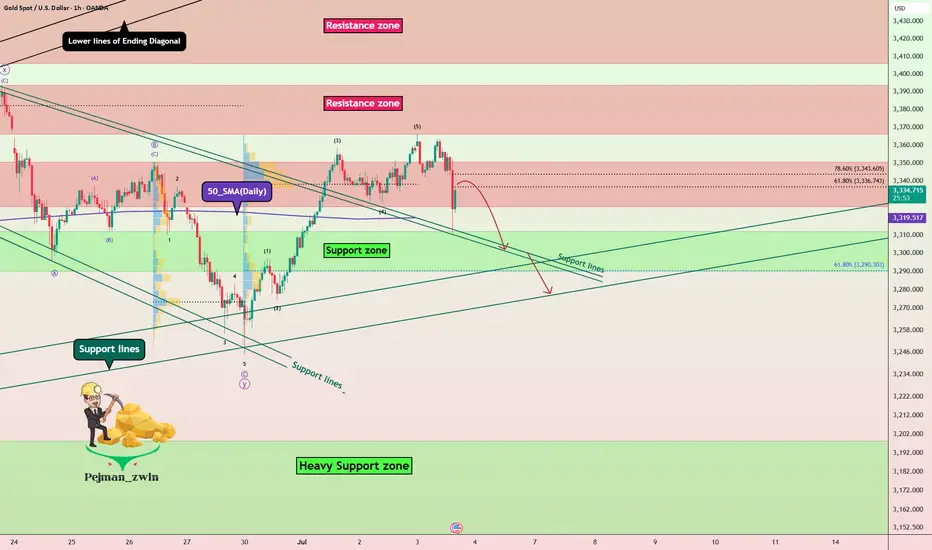
In terms of Technical Analysis , Gold fell below the Resistance zone($3,350-$3,326) again after the announcement of US indices and is currently moving near the Support lines and 50_SMA(Daily) .
In terms of Elliott wave theory , it seems that Gold has completed 5 impulsive waves in the one-hour time frame, and we should now wait for corrective waves .
I expect Gold to fall again after the upward correction , and the Support zone($3,312-$3,290) could be the target.
Note: Stop Loss (SL) = $3,365
Gold Analyze (XAUUSD), 1-hour time frame.
Be sure to follow the updated ideas.
Do not forget to put a Stop loss for your positions (For every position you want to open).
Please follow your strategy; this is just my idea, and I will gladly see your ideas in this post.
Please do not forget the ✅ ' like ' ✅ button 🙏😊 & Share it with your friends; thanks, and Trade safe.
On Swing Traders’ Radar: Gold Pattern Alert on the Daily Chart!Dear Traders,
In my daily gold analysis, I’m observing a Head and Shoulders pattern nearing completion. The neckline is currently positioned around the 3,247.00 level.
If this neckline breaks to the downside, gold could potentially drop toward the 3,150.00 area.
Since this is a one-day analysis—aligned with a swing trading style—it may take some time for the setup to fully play out.
I meticulously prepare these analyses for you, and I sincerely appreciate your support through likes. Every like from you is my biggest motivation to continue sharing my analyses.
I’m truly grateful for each of you—love to all my followers💙💙💙

DeGRAM | GOLD formed a declining peak📊 Technical Analysis
● Price has slipped back beneath the inner rising-channel median and is now riding a fresh descending channel; repeated failures at 3 355 have carved a lower-high sequence.
● A clean hourly close under 3 308 would confirm loss of the late-June support shelf and open the next structural pivots at 3 248 (mid-May swing) and 3 202 (channel base / former demand).
💡 Fundamental Analysis
● Firmer US payroll headline and another uptick in 2-yr real yields revived the dollar, while CFTC data show a second week of long liquidation in COMEX gold—dampening bid strength.
✨ Summary
Sell rallies ≤3 330; sustained trade below 3 308 targets 3 248 → 3 202. Bias void on an H4 close above 3 355.
-------------------
Share your opinion in the comments and support the idea with a like. Thanks for your support!

XAUUSD Below 3300 – Buying Opportunity or Trap? Gold Breaks Below 3300 – A Buying Opportunity or Sign of Deeper Correction?
🧭 Weekly Kickoff: Is the Sell-off Really That Dangerous?
At the start of the week, gold experienced a sharp drop to 3306 USD, breaking through the psychological 3300 support level and testing the 329x region. However, this isn't necessarily a sign of a sustainable downtrend — it's more likely a liquidity sweep before the market consolidates again for a bigger move.
🌐 Macro Updates Impacting Gold:
US inflation continues to ease, providing space for the Fed to loosen policy if needed.
FOMC minutes due soon — markets will be closely watching for clues about possible rate cuts.
Tensions in Gaza de-escalate temporarily, leading to a slight reduction in demand for safe-haven assets.
Trump's new tax bill has been passed, adding pressure to US public debt.
US–China trade war may be delayed — reducing short-term geopolitical pressure.
In summary, we are in a consolidation phase, with a high probability of a breakout in the coming days.
📉 Technical Analysis – CP Pattern in Focus
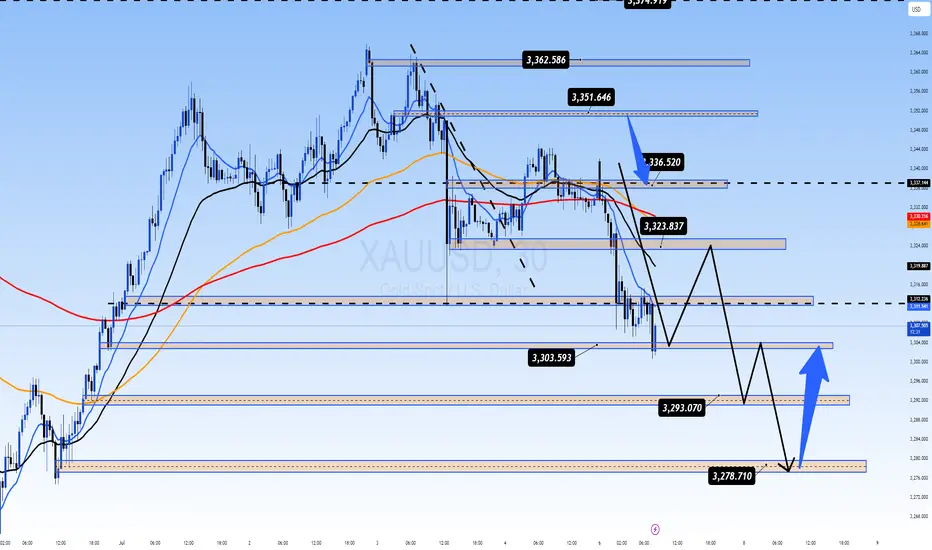
We are seeing a Continuation Pattern (CP), which generally signals that the current correction is a pause before the trend continues.
After rejecting resistance at 3336, gold fell, breaking through the 3323 support and quickly testing the 3303 zone, a key short-term support.
If gold breaks below 3293, the next target will be the 3278 USD liquidity zone, where strong buying could emerge.
📌 Key Trading Plan – 04 July
🔵 BUY ZONE
3294 – 3292
Stop Loss: 3288
Take Profit: 3298 → 3302 → 3306 → 3310 → 3315 → 3320 → 3330
🔴 SELL SCALP
3324 – 3326
Stop Loss: 3330
Take Profit: 3320 → 3316 → 3312 → 3308 → 3304 → 3300
🔴 SELL ZONE
3350 – 3352
Stop Loss: 3356
Take Profit: 3346 → 3340 → 3335 → 3330 → 3320
🧠 Market Sentiment Today
The market is currently in a consolidation phase, likely trading sideways between 3320 and 3340. A breakout seems likely once the liquidity from the US holiday subsides.
✅ Primary Bias: Look to buy dips into support zones.
⚠️ Alternative View: Only consider selling if price clearly rejects key resistance levels.
💬 What’s Your View on Gold Today?
Do you think gold will break through 3390 soon, or is there more room for a deeper correction towards 3270?
👇 Share your thoughts and analysis in the comments below!
GOLD BUY M15 Gold (XAU/USD) 15-Minute Chart Analysis – July 7, 2025
Trade Setup: The chart shows a bullish trade setup based on a potential reversal from a "Weak Low" support area around 3304. After forming a BOS (Break of Structure) and a small consolidation (highlighted box), price is expected to move higher.
Entry:
Long position initiated slightly above the consolidation zone.
Stop Loss (SL):
Set at 3304, just below the recent weak low support.
Target (TP):
Final target at 3326, where a key resistance level lies.
Key Levels:
Support Zone: 3304 (Weak Low)
Resistance Levels:
3317.5
3222.9
3326.2 (Final Target)
Market Structure Notes:
CHoCH (Change of Character) indicates potential shift to bullish momentum.
Price is expected to form higher highs and higher lows on its way to the target.

GOLD BEST PLACE TO BUY FROM|LONG
GOLD SIGNAL
Trade Direction: long
Entry Level: 3,312.57
Target Level: 3,353.45
Stop Loss: 3,285.24
RISK PROFILE
Risk level: medium
Suggested risk: 1%
Timeframe: 4h
Disclosure: I am part of Trade Nation's Influencer program and receive a monthly fee for using their TradingView charts in my analysis.
✅LIKE AND COMMENT MY IDEAS✅

Bearish reversal off pullback resistance?XAU/USD is rising towards the resistance level which is a pullback resistance that is slightly below the 38.2% Fibonacci retracement and could drop from this level too ur take profit.
Entry: 3,324.16
Why we like it:
There is a pullback resistance level that is slightly below the38.2% Fibonacci retracement.
Stop loss: 3,344.28
Why we like it:
There is an overlap resistance level that aligns with the 61.8% Fibonacci retracement.
Takeprofit: 3,295.40
Why we like it:
There is a pullback support level that aligns with the 61.8% Fibonacci retracement.
Enjoying your TradingView experience? Review us!
Please be advised that the information presented on TradingView is provided to Vantage (‘Vantage Global Limited’, ‘we’) by a third-party provider (‘Everest Fortune Group’). Please be reminded that you are solely responsible for the trading decisions on your account. There is a very high degree of risk involved in trading. Any information and/or content is intended entirely for research, educational and informational purposes only and does not constitute investment or consultation advice or investment strategy. The information is not tailored to the investment needs of any specific person and therefore does not involve a consideration of any of the investment objectives, financial situation or needs of any viewer that may receive it. Kindly also note that past performance is not a reliable indicator of future results. Actual results may differ materially from those anticipated in forward-looking or past performance statements. We assume no liability as to the accuracy or completeness of any of the information and/or content provided herein and the Company cannot be held responsible for any omission, mistake nor for any loss or damage including without limitation to any loss of profit which may arise from reliance on any information supplied by Everest Fortune Group.

GOLD BEARS GOLD has been showing a bearish. sentiment as July candle hedges around its formation.
Note that this bearish setup is merely a monthly retracement as gold is still bullish on the long term overview .The path of this bearish pullback leads to the 3200's as we're curreently at the 3310's and if we break past 3304 zone, we go for more lower liquidity.
POI- 3304, 3280, 3260
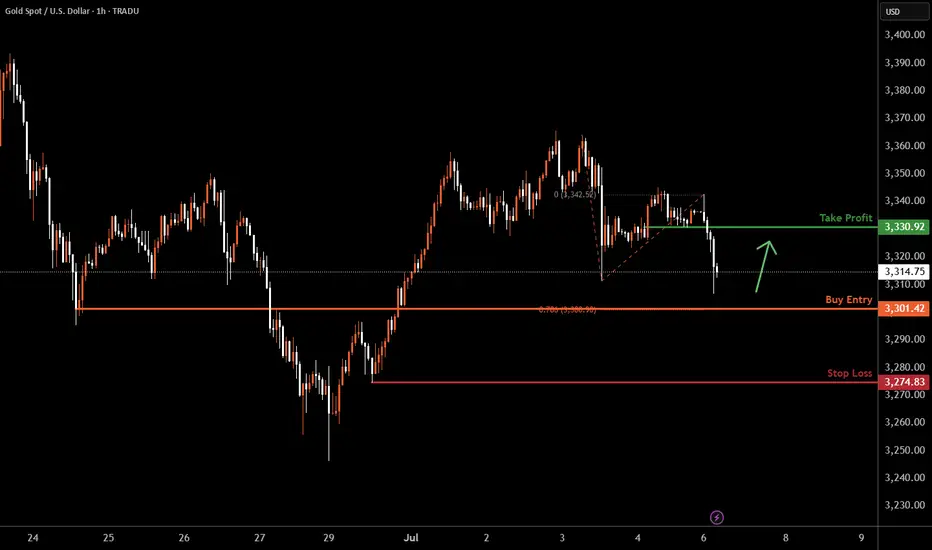
XAUUSD H1 I Bullish Bounce Off Based on the H1 chart analysis, the price is falling toward our buy entry level at 3301.42, a pullback support that aligns with the 78.6% Fib projection.
Our take profit is set at 3330.92, a pullback resistance.
The stop loss is placed at 3274.83, a swing low support.
High Risk Investment Warning
Trading Forex/CFDs on margin carries a high level of risk and may not be suitable for all investors. Leverage can work against you.
Stratos Markets Limited (tradu.com ):
CFDs are complex instruments and come with a high risk of losing money rapidly due to leverage. 63% of retail investor accounts lose money when trading CFDs with this provider. You should consider whether you understand how CFDs work and whether you can afford to take the high risk of losing your money.
Stratos Europe Ltd (tradu.com ):
CFDs are complex instruments and come with a high risk of losing money rapidly due to leverage. 63% of retail investor accounts lose money when trading CFDs with this provider. You should consider whether you understand how CFDs work and whether you can afford to take the high risk of losing your money.
Stratos Global LLC (tradu.com ):
Losses can exceed deposits.
Please be advised that the information presented on TradingView is provided to Tradu (‘Company’, ‘we’) by a third-party provider (‘TFA Global Pte Ltd’). Please be reminded that you are solely responsible for the trading decisions on your account. There is a very high degree of risk involved in trading. Any information and/or content is intended entirely for research, educational and informational purposes only and does not constitute investment or consultation advice or investment strategy. The information is not tailored to the investment needs of any specific person and therefore does not involve a consideration of any of the investment objectives, financial situation or needs of any viewer that may receive it. Kindly also note that past performance is not a reliable indicator of future results. Actual results may differ materially from those anticipated in forward-looking or past performance statements. We assume no liability as to the accuracy or completeness of any of the information and/or content provided herein and the Company cannot be held responsible for any omission, mistake nor for any loss or damage including without limitation to any loss of profit which may arise from reliance on any information supplied by TFA Global Pte Ltd.
The speaker(s) is neither an employee, agent nor representative of Tradu and is therefore acting independently. The opinions given are their own, constitute general market commentary, and do not constitute the opinion or advice of Tradu or any form of personal or investment advice. Tradu neither endorses nor guarantees offerings of third-party speakers, nor is Tradu responsible for the content, veracity or opinions of third-party speakers, presenters or participants.
Will The new Week kick off more bullish Pressure for GOLD?looking for more bullish activity this week but need to sit on my hands for now to see if they establish a Low for the week first. Once we see that and start to see HH's made then we can consider a entry to get in on the move. I cant rush it though. Have to be patient.

GOLD Short From Resistance! Sell!
Hello,Traders!
GOLD is weaker than we
Expected and failed to break
The key horizontal level
Around 3360$ and we are
Now seeing a bearish rejection
So we are locally bearish biased
And we will be expecting a
Further bearish move down
Sell!
Comment and subscribe to help us grow!
Check out other forecasts below too!
Disclosure: I am part of Trade Nation's Influencer program and receive a monthly fee for using their TradingView charts in my analysis.

Gold buying levels Hello everyone today Monday 7 july gold
Support 3330 level the price support this level if you plan for gold buy wait confirmation candle like bullish engulfing etc tp - 3343 sl - 3325 try at least 1:2 trade 1% risk overall captial

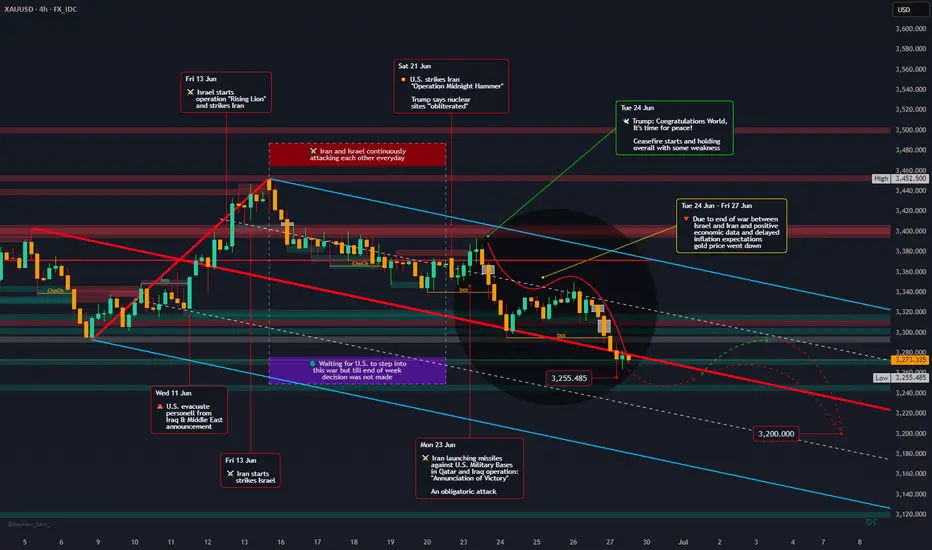
Down the road - Gold Outlook June 30 - July 24, 2025FX_IDC:XAUUSD
📰 The past weeks has been a wild ride for gold prices, caught between the fiery conflict in the Middle East and a deluge of crucial economic data from the U.S. 📈 Adding to this, a detailed technical analysis provides a deeper look into gold's immediate future.
**Geopolitical Drama Unfolds & Peace Prevails!** 🕊️ ceasefire negotiations.
Initially, gold was shrouded in uncertainty 🌫️ due to the Iran-Israel war, with markets bracing for potential U.S. involvement and a full-blown escalation. Daily tit-for-tat attacks between Iran and Israel kept everyone on edge, and the question of U.S. intervention remained a nail-biter 😬, though President Trump did announce a 14-day "timeout".
Then came the dramatic twist on June 21st: "Operation Midnighthammer" saw the U.S. unleash bunker-buster bombs on Iranian uranium enrichment facilities. 💥 Short time later, the U.S. declared mission accomplished, stating their goal of destroying these sites was achieved, and no further attacks would follow.
Iran's response, "Operation Annunciation of Victory," on the following Monday, involved missile strikes on U.S. military bases in Qatar and Iraq. 🚀 Interestingly, these attacks were pre-announced, allowing for safe evacuations and thankfully, no casualties. 🙏
The biggest surprise came from President Trump as he declared, "Congratulations world, it's time for peace!" 🎉 He then brokered a ceasefire between Israel and Iran, which, despite being fragile, largely held, leading to the war's end.🤝 Both nations, as expected, officially claimed victory – a common move to satisfy their citizens. 🏅
Personally, I was genuinely surprised that the U.S.President mediated ceasefire, actually brought the conflict to a close – but it's a welcome outcome! 🙏
**Economic Data & Fed's Steady Hand** 💹🏛️
The cessation of hostilities triggered a steady downward slide in gold prices from June 24th to 27th. ⬇️ This dip initially met some market resistance but it ultimately prevailed, especially with the release of mixed U.S. economic data, which, despite being varied, was generally interpreted positively by the market.
The spotlight also shone on the Federal Reserve, with several representatives speaking and Fed Chair Jerome Powell undergoing a two-day Senate hearing. 🎤👨⚖️ Powell meticulously explained the Fed's rationale for holding interest rates steady, despite market pressures. 🤷 However, recent whispers suggest the Federal Reserve might actually cut rates in September! 😮
## Geopolitical News Landscape 🌍📰
India / Pakistan
Pakistan rejected claims that it supported militant groups active in Indian Kashmir. India issued a formal protest but reported no fresh border clashes during the week.
Outlook 🔮: De-escalation is possible in the short term. However, unresolved disputes over water rights (Indus Treaty) could reignite tensions.
Gaza Conflict
Heavy Israeli airstrikes killed dozens in Gaza, including civilians near aid centers. The UN warned that U.S.-backed aid systems are failing. Humanitarian corridors remain blocked.
Outlook 🔮: Ceasefire talks may resume in July, but success depends on international pressure and safe humanitarian access.
Russia / Ukraine
Russia advanced 36 sq mi in eastern Ukraine, deploying outdated T-62 tanks. Ukraine reinforced defensive lines, aided by Western military packages.
Outlook 🔮: The front remains volatile. Sustained Western support will be key to halting further Russian gains.
U.S. – China Trade War
A breakthrough deal was signed for China to fast-track rare-earth exports to the U.S. Talks on tech transfer and tariffs continue behind closed doors.
Outlook 🔮: A phased de-escalation is possible, but deep trust issues linger, especially over semiconductors and AI.
🌐 Global Trade War
Several countries, including Brazil and Thailand, imposed fresh restrictions on Chinese imports, echoing the U.S. stance. Global supply chains remain fragmented.
Outlook 🔮: Trade blocs like the EU and Mercosur may take on greater importance as countries hedge against rising protectionism.
Trump vs. Powell
Fed Chair Powell resisted political pressure, stating rate cuts are unlikely before September. Trump called him “stubborn” and demanded immediate easing.
Outlook 🔮: The Fed’s independence is under strain. If Trump wins re-election, major policy shifts could follow.
📈 U.S. Inflation
Despite tariffs, core inflation remains elevated. Powell warned of persistent price pressures. Trump insists the Fed should cut rates to boost growth.
Outlook 🔮: A rate cut later in 2025 is possible—if labor market data weakens. Until then, inflation will remain politically explosive.
## Technical View 📐📈
**Current Market Context:** Gold plummeted to $3,273.67 USD/t.oz on June 27, 2025, marking a 1.65% drop from the previous day, which confirms the strong bearish momentum. The price action shows a significant retreat from recent highs around $3,400.
**ICT (Inner Circle Trader) Methodology Analysis:**
* **Market Structure:**
The trend is clearly bearish, with a definitive break of structure (BOS) to the downside.
* **Order Blocks:**
Several bearish order blocks have been identified at prior resistance levels, specifically in the $3,380-$3,400 range.
* **Fair Value Gaps (FVG):**
The aggressive sell-off has created multiple imbalances, particularly in the $3,350-$3,320 range.
* **Liquidity Pools:**
Buy-side liquidity above $3,400 has been swept. Sell-side liquidity is now accumulating below the $3,270 lows, which is the current target zone.
* **Session Analysis:**
The London session showed aggressive selling, followed by a continuation of bearish momentum in the New York session. The Asia session could see consolidation or further declines.
* **Smart Money Concepts:**
Heavy selling pressure suggests "smart money" distribution. There's been strong bearish displacement from $3,380 down to $3,270, indicating the market is currently in a "sell program" phase.
**Gann Analysis:**
* **Gann Angles & Time Cycles:**
The primary 1x1 Gann angle has been broken, pointing to continued weakness. Key price squares indicate resistance at $3,375 (25²) and support at $3,249 (57²). Daily cycles suggest a potential turning point around June 30-July 1, while weekly cycles indicate continued pressure through early July.
* **Gann Levels:**
* Resistance: $3,375, $3,400, $3,481 (59²)
* Support: $3,249, $3,136, $3,025
**Fibonacci Analysis:**
* **Key Retracement Levels (from recent swing high to low):**
* 78.6%: $3,378 (Strong resistance)
* 61.8%: $3,348 (Key resistance zone)
* 50.0%: $3,325 (Psychological level)
* 38.2%: $3,302 (Minor resistance)
* 23.6%: $3,285 (Current area of interest)
* **Fibonacci Extensions (Downside Targets):**
* 127.2%: $3,245
* 161.8%: $3,195
* 261.8%: $3,095
* **Time-Based Fibonacci:**
The next significant time cluster is July 2-3, 2025, with a major cycle completion expected around July 15-17, 2025.
**Institutional Levels & Volume Analysis:**
* **Key Institutional Levels:**
* Major Resistance: $3,400 (psychological + institutional)
* Secondary Resistance: $3,350-$3,375 (order block cluster)
* Primary Support: $3,250-$3,270 (institutional accumulation zone)
* Major Support: $3,200 (monthly pivot area)
* **Volume Profile Analysis:**
* High Volume Node (HVN): $3,320-$3,340 (fair value area)
* Low Volume Node (LVN): $3,280-$3,300 (potential acceleration zone)
* Point of Control (POC): Currently around $3,330
**Central Bank & Hedge Fund Levels:**
Based on recent COT data and institutional positioning, heavy resistance is seen at $3,400-$3,430, where institutions likely distributed. An accumulation zone for "smart money" re-entry is anticipated at $3,200-$3,250.
**Cycle Timing Analysis:**
* **Short-Term Cycles (Intraday):**
Bearish momentum is expected to continue for another 12-18 hours. A daily cycle low is likely between June 29-30, with a potential reversal zone on July 1-2 for the 3-day cycle.
* **Medium-Term Cycles:**
The current weekly cycle is in week 3 of a 4-week decline. The monthly cycle indicates a mid-cycle correction within a larger uptrend. For the quarterly cycle, Q3 2025 could see a major low formation.
* **Seasonal Patterns:**
July-August is typically a weaker period for gold ("Summer Doldrums"). September has historically been strong for precious metals ("September Effect"), setting up for a potential major move higher in Q4 2025 ("Year-End Rally").
**Trading Strategy & Levels:**
* **Bearish Scenario (Primary):**
* Entry: Sell rallies into the $3,320-$3,350 resistance zone.
* Targets: $3,250, $3,200, $3,150.
* Stop Loss: Above $3,380.
* **Bullish Scenario (Secondary):**
* Entry: Buy support at $3,250-$3,270 with confirmation.
* Targets: $3,320, $3,375, $3,400.
* Stop Loss: Below $3,230.
**Key Events to Watch:**
* **US PCE Data:**
Fresh downside risks could emerge ahead of the US Personal Consumption Expenditures (PCE) Price Index data release.
* **Fed Communications:**
Any hawkish rhetoric from the Federal Reserve could further pressure gold.
* **Geopolitical Developments:**
Ongoing global events could trigger safe-haven demand.
**Conclusion:**
The technical picture for gold suggests continued short-term weakness, with the metal testing its 2025 trend line at $3,290 following last week's rejection at the $3,430 resistance. However, the longer-term outlook remains constructive, given gold's robust performance year-to-date. Key support at $3,250-$3,270 will be crucial in determining the next significant price movement.
**Upcoming Week's Economic Calendar (June 29 - July 4, 2025):** 🗓️🌍
🗓️ Get ready for these important economic events (EDT)
* ** Sunday , June 29, 2025**
* 21:30 CNY: Manufacturing PMI (Jun) - Forecast: 49.6, Previous: 49.5
* ** Monday , June 30, 2025**
* 09:45 USD: Chicago PMI (Jun) - Forecast: 42.7, Previous: 40.5
* ** Tuesday , July 1, 2025**
* 05:00 EUR: CPI (YoY) (Jun) - Forecast: 2.0%, Previous: 1.9%
* 09:30 USD: Fed Chair Powell Speaks
* 09:45 USD: S&P Global Manufacturing PMI (Jun) - Forecast: 52.0, Previous: 52.0
* 10:00 USD: ISM Manufacturing PMI (Jun) - Forecast: 48.8, Previous: 48.5
* 10:00 USD: ISM Manufacturing Prices (Jun) - Forecast: 70.2, Previous: 69.4
* 10:00 USD: JOLTS Job Openings (May) - Forecast: 7.450M, Previous: 7.391M
* ** Wednesday , July 2, 2025**
* 08:15 USD: ADP Nonfarm Employment Change (Jun) - Forecast: 80K, Previous: 37K
* 10:30 USD: Crude Oil Inventories - Forecast: -5.836M
* ** Thursday , July 3, 2025**
* Holiday: United States - Independence Day (Early close at 13:00) 🇺🇸⏰
* 08:30 USD: Average Hourly Earnings (MoM) (Jun) - Forecast: 0.3%, Previous: 0.4%
* 08:30 USD: Initial Jobless Claims - Forecast: 239K, Previous: 236K
* 08:30 USD: Nonfarm Payrolls (Jun) - Forecast: 129K, Previous: 139K
* 08:30 USD: Unemployment Rate (Jun) - Forecast: 4.2%, Previous: 4.2%
* 09:45 USD: S&P Global Services PMI (Jun) - Forecast: 53.1, Previous: 53.1
* 10:00 USD: ISM Non-Manufacturing PMI (Jun) - Forecast: 50.3, Previous: 49.9
* 10:00 USD: ISM Non-Manufacturing Prices (Jun) - Forecast: 68.7
* ** Friday , July 4, 2025**
* All Day: Holiday - United States - Independence Day 🎆
**Gold Price Forecast for the Coming Week** 🔮💰
Given last week's market movements, there's a strong likelihood that the downward trend in gold prices will continue.🔽 However, fresh news can always flip the script! 🔄 As of now, I expect gold to dip further to $3255 by mid-next week. Yet, a brief rebound towards $3300 isn't out of the question before a potential drop to $3200 by week's end or early the following week. 🤞
Please take the time to let me know what you think about this. 💬
-------------------------------------------------------------------------
This is just my personal market idea and not financial advice! 📢 Trading gold and other financial instruments carries risks – only invest what you can afford to lose. Always do your own analysis, use solid risk management, and trade responsibly.
Good luck and safe trading! 🚀📊
Gold Futures (GC1!) – Accumulation Brewing? Major Move IncomingGold has been stuck in a tight range since April, and to me, this looks like a textbook accumulation zone forming on the daily chart.
Price is coiling within a defined box, showing signs of both strength and weakness — classic behavior before a manipulative move (fake breakout) followed by distribution (true direction). This is where many traders get trapped, chasing the first breakout — only to get caught before the actual move begins.
I’m not committed to a direction yet, but here’s my roadmap:
🧠 First breakout = likely trap (manipulation)
🧭 Wait for confirmation of rejection/failure, then prepare for the real move out of the range
This kind of price behavior often precedes explosive volatility, so I’m watching closely for:
False breakouts above or below the box
Volume spikes or traps
Shift in market structure on lower timeframes
📍 No trade for now, but I’ll be reacting — not predicting.
What’s your bias? Do you think the breakout will hold or fake out?

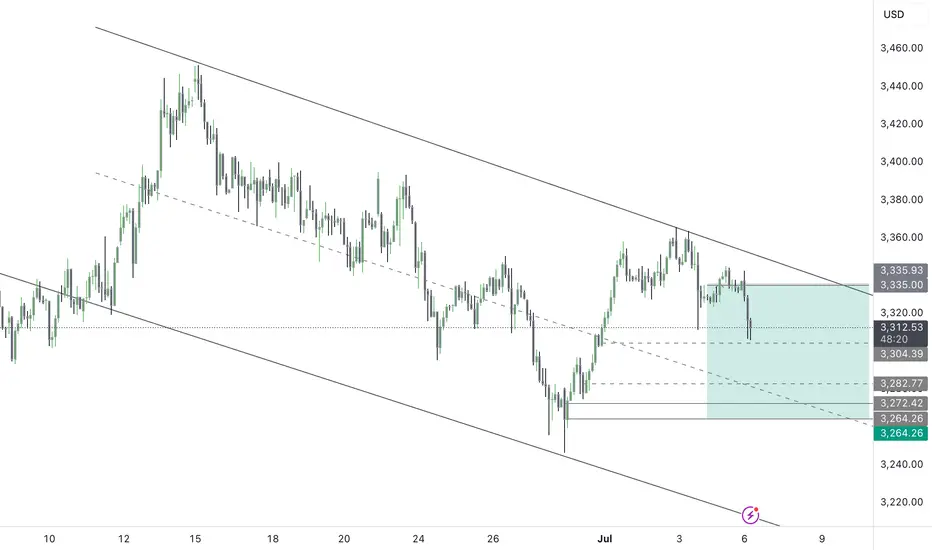
HelenP I. Gold can correct to trend line and then bounce upHi folks today I'm prepared for you Gold analytics. If we look at the chart, we can see that gold has formed a broadening wedge pattern with several touches of the trend line, which acts as a dynamic support. After a strong drop, the price found support near the 3295 level and rebounded, forming a local upward movement. However, bulls have not yet shown a strong impulse, and the price is still trading below the resistance zone between 3390 and 3400 points. Currently, the price is hovering just above the trend line, and appears to be testing this support again. I expect a short decline, possibly to the area around 3295 - 3285 points - that’s the key support zone. If this area holds and we see a bounce, it will confirm that buyers are still active and ready to push the price up again. In this case, we could see gold continue moving inside the wedge pattern and aim for the upper resistance. My goal is set at the 3390 level, right near the wedge's upper border and strong resistance. This target matches the local highs from previous attempts, and if bulls gain momentum, they may try to break through this zone. But for now, I remain cautiously bullish and expect gold to bounce off the trend line and move upward toward the resistance. If you like my analytics you may support me with your like/comment.❤️
Disclaimer: As part of ThinkMarkets’ Influencer Program, I am sponsored to share and publish their charts in my analysis.

GOLD MARKET ANALYSIS AND COMMENTARY - [Jul 07 - Jul 11]OANDA:XAUUSD opened the week at $3,246/oz due to low summer liquidity, easing recession fears and easing geopolitical tensions. However, they later recovered to $3,365/oz due to concerns about a possible re-escalation of the trade war, as some countries faced obstacles in negotiations with the US ahead of the July 9 tariff delay deadline. By the end of the week, prices had adjusted to $3,311/oz and closed at $3,335/oz.
In addition, the US Senate has passed the OBBBA tax cut and spending bill proposed by President Donald Trump. While it helps prevent the risk of a short-term default, the bill could increase the US public debt by more than $3,000 billion over the next 10 years, putting pressure on the bond market and raising concerns about the increasing supply of government bonds while demand is weakening.
However, US economic data over the weekend put downward pressure on gold. Specifically, the June employment report showed that the number of non-farm jobs (NFP) reached 147,000, exceeding the forecast of 111,000. The unemployment rate fell to 4.1%, lower than the expected 4.3%. At the same time, NFP data for April and May were also adjusted up to 158,000 and 144,000 jobs, respectively.
These positive numbers almost erased the expectation that the FED would cut interest rates in July. The FED also reaffirmed its stance on maintaining the current policy due to rising inflationary pressures.
Overall, gold prices are still stuck in a range, and a clearer prospect of interest rate cuts from the FED is needed to make a strong breakthrough in the near future.
📌Technically, the $3,310/oz level is now acting as an important support zone for gold prices next week. If this level is broken, prices may continue to fall further to the $3,245/oz area or even lower.
On the other hand, the $3,365/oz level is a strong resistance. If gold prices break through this area, there is a high possibility that they will approach the $3,400/oz mark. However, the upward momentum may be restrained afterwards due to profit-taking pressure from investors, especially when the US-China trade negotiations are still ongoing and have not reached a final agreement. Investors tend to be cautious, waiting for clearer signals before opening new positions.
Notable technical levels are listed below.
Support: 3,300 – 3,292 – 3,250USD
Resistance: 3,350 – 3,371 – 3,400USD
SELL XAUUSD PRICE 3401 - 3399⚡️
↠↠ Stop Loss 3405
BUY XAUUSD PRICE 3294 - 3296⚡️
↠↠ Stop Loss 3290

GOLD 1H CHART ROUTE MAP UPDATE & TRADING PLAN FOR THE WEEKHey Everyone,
Please see our updated 1h chart levels and targets for the coming week.
We are seeing price play between two weighted levels with a gap above at 3358 and a gap below at 3330. We will need to see ema5 cross and lock on either weighted level to determine the next range.
We will see levels tested side by side until one of the weighted levels break and lock to confirm direction for the next range.
We will keep the above in mind when taking buys from dips. Our updated levels and weighted levels will allow us to track the movement down and then catch bounces up.
We will continue to buy dips using our support levels taking 20 to 40 pips. As stated before each of our level structures give 20 to 40 pip bounces, which is enough for a nice entry and exit. If you back test the levels we shared every week for the past 24 months, you can see how effectively they were used to trade with or against short/mid term swings and trends.
The swing range give bigger bounces then our weighted levels that's the difference between weighted levels and swing ranges.
BULLISH TARGET
3358
EMA5 CROSS AND LOCK ABOVE 3358 WILL OPEN THE FOLLOWING BULLISH TARGETS
3389
EMA5 CROSS AND LOCK ABOVE 3389 WILL OPEN THE FOLLOWING BULLISH TARGET
3416
EMA5 CROSS AND LOCK ABOVE 3416 WILL OPEN THE FOLLOWING BULLISH TARGET
3439
BEARISH TARGETS
3330
EMA5 CROSS AND LOCK BELOW 3330 WILL OPEN THE FOLLOWING BEARISH TARGET
3306
EMA5 CROSS AND LOCK BELOW 3306 WILL OPEN THE SWING RANGE
3283
3254
As always, we will keep you all updated with regular updates throughout the week and how we manage the active ideas and setups. Thank you all for your likes, comments and follows, we really appreciate it!
Mr Gold
GoldViewFX

GOLD 4H CHART ROUTE MAP UPDATE & TRADING PLAN FOR THE WEEKHey Everyone,
Please see our updated 4h chart levels and targets for the coming week.
We are seeing price play between two weighted levels with a gap above at 3301 and a gap below at 3242. We will need to see ema5 cross and lock on either weighted level to determine the next range.
We will see levels tested side by side until one of the weighted levels break and lock to confirm direction for the next range.
We will keep the above in mind when taking buys from dips. Our updated levels and weighted levels will allow us to track the movement down and then catch bounces up.
We will continue to buy dips using our support levels taking 20 to 40 pips. As stated before each of our level structures give 20 to 40 pip bounces, which is enough for a nice entry and exit. If you back test the levels we shared every week for the past 24 months, you can see how effectively they were used to trade with or against short/mid term swings and trends.
The swing range give bigger bounces then our weighted levels that's the difference between weighted levels and swing ranges.
BULLISH TARGET
3364
EMA5 CROSS AND LOCK ABOVE 3364 WILL OPEN THE FOLLOWING BULLISH TARGETS
3429
EMA5 CROSS AND LOCK ABOVE 3429 WILL OPEN THE FOLLOWING BULLISH TARGET
3499
EMA5 CROSS AND LOCK ABOVE 3429 WILL OPEN THE FOLLOWING BULLISH TARGET
3499
EMA5 CROSS AND LOCK ABOVE 3499 WILL OPEN THE FOLLOWING BULLISH TARGET
3561
BEARISH TARGETS
3295
EMA5 CROSS AND LOCK BELOW 3295 WILL OPEN THE SWING RANGE
3242
3171
EMA5 CROSS AND LOCK BELOW 3171 WILL OPEN THE SECONDARY SWING RANGE
3089
3001
As always, we will keep you all updated with regular updates throughout the week and how we manage the active ideas and setups. Thank you all for your likes, comments and follows, we really appreciate it!
Mr Gold
GoldViewFX

GOLD DAILY CHART ROUTE MAP Hey Everyone,
Please see update and plans for the coming week on our Daily chart idea that we have been tracking.
After wrapping up last week and actively tracking the 1h and 4h structures throughout last week within the daily chart overall structure. This brings everything together and reminds us how the broader structure has continued to evolve in our favour.
The bounce off at 3272 that we outlined has now fully played out, showing yet again how critical these Goldturn levels are in guiding our strategy.
Following the clean rejection at the channel top near 3433, price moved precisely into the 3272 support, where we were focused on structure to hold. That level held beautifully, giving us a strong technical base for upward continuation.
As we head into the new week, we’ve once again seen price find support at 3272, with a clean bounce that opens up the potential for price to fill the gap back toward 3433, as long as EMA5 remains above 3272. This dynamic will be a key technical trigger for us to monitor in the coming sessions.
There was no EMA5 cross and lock breakdown, which confirmed that buyers maintained control at this level. That absence of breakdown was our confirmation that the bounce structure was not only valid, but likely to continue unfolding into the new week.
As price grinds its way back up the channel, we’ll keep watching for reactions at key resistance zones, with special attention to 3433, the channel top. The measured structural reaction from 3272 has been perfect and supports our method of trading level to level, always with patience and discipline.
Key Levels to Watch This Week:
🔼 Resistance: 3433 (channel top, gap target)
🔽 Support: 3272 (confirmed bounce zone)
Thanks again for all the support, likes, comments, and follows are always appreciated.
Wishing you all a strong start to the week ahead!
Mr Gold
GoldViewFX

GOLD MONTHLY CHART LONG TERM/RANGE ROUTE MAPHey Everyone,
We’ve just released our new Monthly Chart idea, which we’ll now be tracking following the successful completion of our previous long term monthly chart idea. That one played out beautifully, and now it’s time to shift focus to the next big setup.
Currently, price is trading above the channel midline, and we’ve also seen an important EMA5 cross and lock above 3099, with a candle body close confirming a long term gap above at 3557.
While this confirms the bullish long term structure, we’re also mindful of the potential for a short term retracement, particularly around the EMA5 detachment zone (highlighted with a circle on the chart). This would offer a healthy dip opportunity, aligning perfectly with our strategy to buy into weakness on the way up.
For the bigger structure to remain intact, we’ll be looking for 3099 to continue holding as key structural support. As long as that level is respected, the long term gap toward 3557 remains firmly in play.
This is a higher timeframe idea that we’ll be building on as structure continues to unfold.
We will continue to use all support structures, across all our multi time frame chart ideas to buy dips also keeping in mind our long term gaps above. Short term we may look bearish but looking at the monthly chart allows us to see the bigger picture and the overall long term Bullish trend.
As always, we will keep you all updated with regular updates throughout the week and how we manage the active ideas and setups. Thank you all for your likes, comments and follows, we really appreciate it!
Mr Gold
GoldViewFX

Gold Weekly Recap – Week 27 (30 Jun – 04 Jul)🟡 XAUUSD | MJTrading
Overview
Gold (XAUUSD) staged a significant recovery this week after retesting a critical support zone. Price action reflected strong buying interest at lower levels, followed by consolidation near mid-range resistance.
🔹 Key Levels:
Strong Support Zone: 3,246 – 3,250
Weekly Low: 3,246.35 (30 June)
Weekly High: 3,365.77 (3 July)
Closing Price: ~3,343
🔹 Price Action Summary:
✅ Early Week Retest & Reversal
After the prior week’s decline, gold opened the week near the major support area around 3,246. This zone acted as a strong demand pocket, triggering a swift rejection and initiating a bullish reversal.
✅ Sustained Rally to Resistance
Price climbed steadily, riding the 15-period EMA to reach the weekly high of 3,365.77 on 3 July. This move represented a nearly 4% recovery off the lows, fueled by renewed safe-haven flows and short covering.
✅ Midweek Consolidation
Following the rally, gold entered a sideways consolidation phase between 3,340 and 3,365. EMA flattening reflected a pause in momentum as traders assessed the next directional catalyst.
✅ Late-Week Pullback
Toward the end of the week, price tested the 3,310–3,320 area before modestly bouncing into the Friday close. Overall, the market maintained a cautiously bullish tone while holding above the prior support.
🔹 Technical Perspective:
🔸 Bias: Cautiously Bullish
Price defended the strong support and printed a higher low structure.
Sustained closes above 3,300 maintain the bullish outlook.
🔸 Near-Term Resistance:
3,365–3,390 remains the immediate supply zone to monitor for breakout attempts.
🔸 Key Support:
The 3,246–3,250 area continues to be the primary downside line in the sand.
🔹 Special Note – 4th July US Bank Holiday
Trading volumes were notably lighter on Thursday, 4th July, due to the US Independence Day holiday. This contributed to reduced liquidity and muted volatility, with many traders and institutions off desks. The thinner market conditions likely influenced the late-week pullback and consolidation, as participation was limited heading into the weekend.
🔹 Sentiment & Outlook
The decisive rebound from support suggests that buyers are defending value zones aggressively. However, failure to close the week above 3,365 leaves gold vulnerable to another retest of mid-range levels if fresh catalysts don’t emerge.
Traders should watch for:
A clean breakout above 3,365 to confirm continuation higher.
Any sustained weakness below 3,300 as a signal of fading bullish momentum.
🧭 Next Week’s Focus:
Monitoring whether the consolidation evolves into accumulation or distribution.
Watching for a breakout or deeper pullback
Reactions to upcoming economic data
EMA alignment: If the 15 EMA continues to track above the 60 EMA, it supports a bullish bias.
Chart Notes:
The main chart highlights this week’s action, while the inset provides a fortnight overview of the broader decline and recovery for context.
Thank you for your time and your support...
🚀🚀Boost it if you like it (Thanks)🚀🚀
#Gold #XAUUSD #GoldTrading #Forex #Commodities #TechnicalAnalysis #PriceAction #TradingRecap #MJTrading #GoldForecast #MarketReview #WeeklyRecap #TradingView
