Gold retreats as expected, how to trade in the future📰 News information:
1. Geopolitical situation
2. PMI data
3. Global Central Bank Governors Meeting
📈 Technical Analysis:
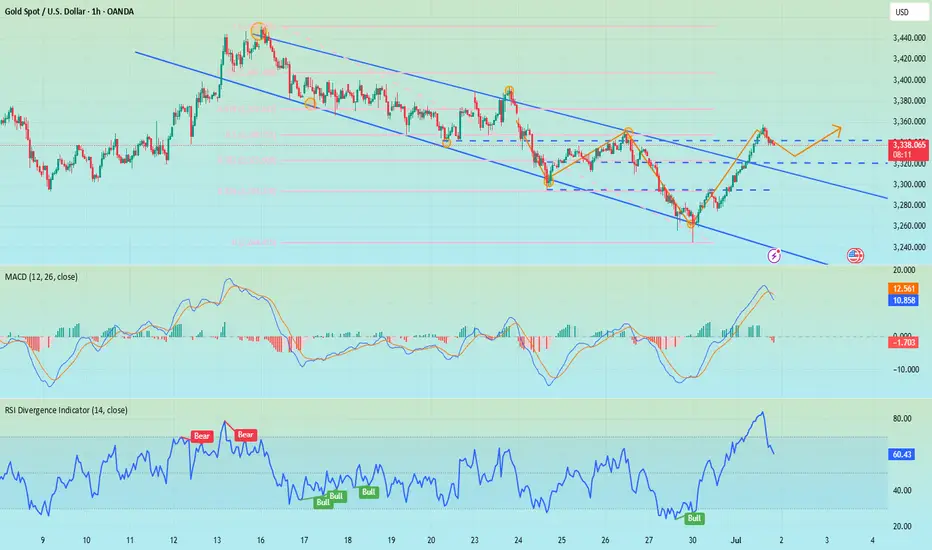
Our short orders have achieved profits. I closed the position near 3337, turning losses into profits. Interested friends can follow my previous post. In the short term, I am still optimistic that gold will retreat below 3335-3325. Today, gold rose sharply, and the rebound momentum was strong, while the short-term correction was slightly weak, so the space for a second decline in the short term will be limited. If it falls to the 3333-3323 range during the day and gets effective support, you can consider going long. The short-term upper resistance is 3360-3375.
🎯 Trading Points:
BUY 3333-3323-3315
TP 3341-3355-3360-3375
In addition to investment, life also includes poetry, distant places, and Allen. Facing the market is actually facing yourself, correcting your shortcomings, confronting your mistakes, and strictly disciplining yourself. I hope my analysis can help you🌐.
TVC:GOLD OANDA:XAUUSD FX:XAUUSD FOREXCOM:XAUUSD PEPPERSTONE:XAUUSD FXOPEN:XAUUSD
Gold
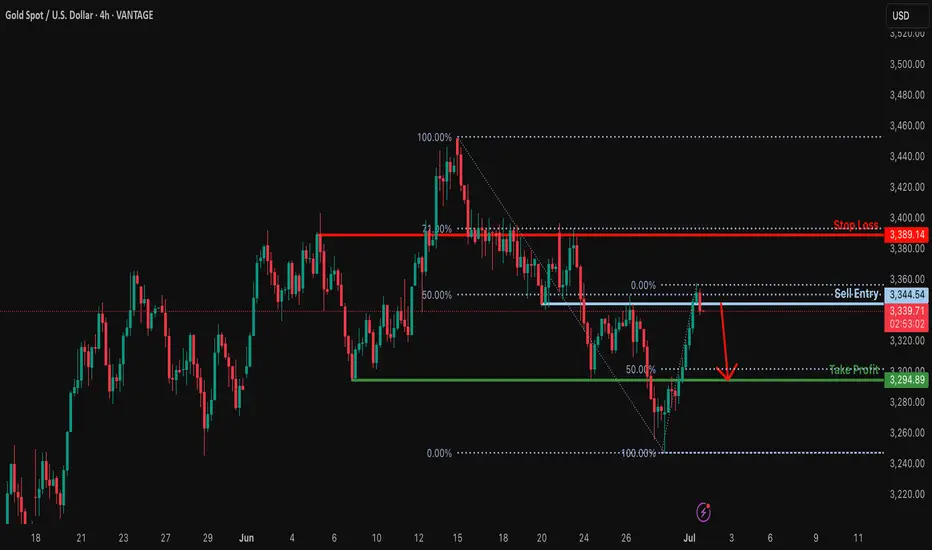
Bearish drop?XAU/USD is reacting off the resistance which is a pullback resistance that lines up with the 50% Fibonacci retracement and could drop from this level to our take profit.
Entry: 3,344.54
Why we like it:
There is a pullback resistance that lines up with the 50% Fibonacci retracement.
Stop loss: 3,389.14
Why we like it:
There is a pullback resistance that lines up with the 71% Fibonacci retracement.
Take prpofit: 3,294.89
Why we like it:
There is a pullback support level that aligns with the 50% Fibonacci retracement.
Enjoying your TradingView experience? Review us!
Please be advised that the information presented on TradingView is provided to Vantage (‘Vantage Global Limited’, ‘we’) by a third-party provider (‘Everest Fortune Group’). Please be reminded that you are solely responsible for the trading decisions on your account. There is a very high degree of risk involved in trading. Any information and/or content is intended entirely for research, educational and informational purposes only and does not constitute investment or consultation advice or investment strategy. The information is not tailored to the investment needs of any specific person and therefore does not involve a consideration of any of the investment objectives, financial situation or needs of any viewer that may receive it. Kindly also note that past performance is not a reliable indicator of future results. Actual results may differ materially from those anticipated in forward-looking or past performance statements. We assume no liability as to the accuracy or completeness of any of the information and/or content provided herein and the Company cannot be held responsible for any omission, mistake nor for any loss or damage including without limitation to any loss of profit which may arise from reliance on any information supplied by Everest Fortune Group.
Gold Breakout and Potential RetraceHey Traders, in today's trading session we are monitoring XAUUSD for a buying opportunity around 3,330 zone, Gold was trading in a downtrend and successfully managed to break it out. Currently is in a correction phase in which it is approaching the retrace area at 3,330 support and resistance area.
Trade safe, Joe.


GOLD - SHORT TO $2,800 (UPDATE)We've seen s sharp move back up overnight which is no surprise considering we are at the start of a new month & quarter. Markets will be spiking to both sides for monthly liquidity, before moving in the direction of the trend.
We're still holding below our yellow support zone & below 'Minor Wave 2'. If this continues to hold, then it'll be a good sign for sellers.

Gold Rebound Underway – Support Zone Holds Strong! - Short termGold( OANDA:XAUUSD ), as I anticipated in the previous idea , has attacked the Support zone($3,281-$3,243) and Support lines .
From an Elliott Wave theory perspective , it appears that Gold has completed 5 sub-waves of the main wave C .
Also, we can see the Regular Divergence(RD+) between Consecutive Valleys.
I expect Gold to rise to at least $3,307 in the coming hours.
Second Target: $3,321
Note: Stop Loss (SL) = $3,240
Gold Analyze (XAUUSD), 1-hour time frame.
Be sure to follow the updated ideas.
Do not forget to put a Stop loss for your positions (For every position you want to open).
Please follow your strategy; this is just my idea, and I will gladly see your ideas in this post.
Please do not forget the ✅ ' like ' ✅ button 🙏😊 & Share it with your friends; thanks, and Trade safe.

GOLD ROUTE MAP UPDATEHey Everyone,
Another PIPTASTIC day on the charts today with our analysis playing out to perfection!!!
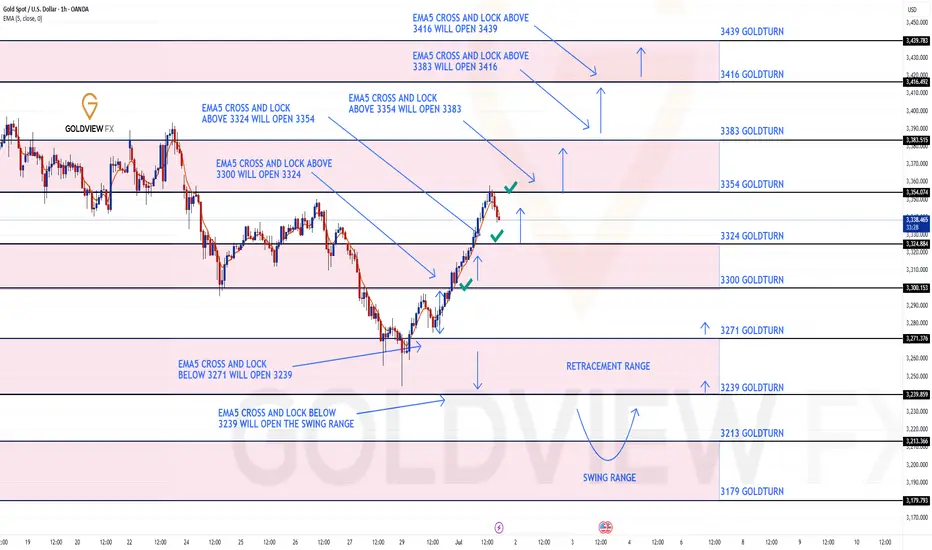
After hitting 3300 target yesterday, we stated that we would now look for ema5 cross and lock above 3300 to open 3324. This was locked and loaded and we got the target hit at 3324. This followed with a further ema5 cross and lock above 3324 opening 3354, which was also hit perfectly completing this range.
We are now seeing a perfect rejection from this level and unless we get a ema5 cross and lock above this level for a continuation, we are likely to see the lower Goldturns tested for support and bounce.
We will keep the above in mind when taking buys from dips. Our updated levels and weighted levels will allow us to track the movement down and then catch bounces up.
We will continue to buy dips using our support levels taking 20 to 40 pips. As stated before each of our level structures give 20 to 40 pip bounces, which is enough for a nice entry and exit. If you back test the levels we shared every week for the past 24 months, you can see how effectively they were used to trade with or against short/mid term swings and trends.
The swing range give bigger bounces then our weighted levels that's the difference between weighted levels and swing ranges.
BULLISH TARGET
3300 - DONE
EMA5 CROSS AND LOCK ABOVE 3300 WILL OPEN THE FOLLOWING BULLISH TARGETS
3324 - DONE
EMA5 CROSS AND LOCK ABOVE 3324 WILL OPEN THE FOLLOWING BULLISH TARGET
3354 - DONE
EMA5 CROSS AND LOCK ABOVE 3354 WILL OPEN THE FOLLOWING BULLISH TARGET
3383
BEARISH TARGETS
3271
EMA5 CROSS AND LOCK BELOW 3354 WILL OPEN THE FOLLOWING BEARISH TARGET
3239
EMA5 CROSS AND LOCK BELOW 3239 WILL OPEN THE SWING RANGE
3213
3179
As always, we will keep you all updated with regular updates throughout the week and how we manage the active ideas and setups. Thank you all for your likes, comments and follows, we really appreciate it!
Mr Gold
GoldViewFX
Gold price rises by more than $100, will the bull run continue?📰 News information:
1. Geopolitical situation
2. PMI data
3. Global Central Bank Governors Meeting
📈 Technical Analysis:
The NY session is about to begin, and there are two things we need to pay attention to. First, the PMI data, and second, the talks between global central bank governors. If Powell again hints that the inflation outlook is weaker than expected, this will increase the Fed's easing bets and trigger a new round of decline in the US dollar. The dovish tone may help gold prices to further rebound. On the contrary, if Powell makes some hawkish or cautious remarks, this may exacerbate the recent downward trend in gold prices. The key point at present is the 3350 mark. If the 4H closing line of the NY session remains below 3350, then in the short term we are expected to continue to retreat to the 3330-3320 range. If the 4H closing line is above 3350 and stabilizes, gold may rebound to the 61.8% position, which is around 3372.
🎯 Trading Points:
SELL 3340-3350-3355
TP 3330-3325-3320
BUY 3330-3320
TP 3340-3350-3372
In addition to investment, life also includes poetry, distant places, and Allen. Facing the market is actually facing yourself, correcting your shortcomings, confronting your mistakes, and strictly disciplining yourself. I hope my analysis can help you🌐.
FX:XAUUSD FXOPEN:XAUUSD PEPPERSTONE:XAUUSD FOREXCOM:XAUUSD FX:XAUUSD OANDA:XAUUSD TVC:GOLD

Gold Bounces from Demand Zone – Next Targets in Sight!By analyzing the gold chart on the 4-hour timeframe, we can see that today, price once again dipped into our key demand zone (Bullish Rejection Block) between $3245 and $3262, where it faced strong buying pressure and rallied up to $3296.
Currently, gold is trading around $3281, and as long as price holds above $3273, we expect further upside. The next potential targets are $3294, $3300, and $3309.
🎥 If you enjoyed this video analysis and found it helpful, please show your support with a LIKE and COMMENT below!
These video-style breakdowns take time and effort, and I’ll only continue them with your support 🙌
Your engagement is my biggest motivation to keep going 💛
Thanks for being part of the journey!

Gold toushes major trendlinemajor trendline on 1d timeframe
RSI divergence
Reverse of trend HH and HL
Risk 1:2

GOLD Massive Short! SELL!
My dear followers,
This is my opinion on the GOLD next move:
The asset is approaching an important pivot point 3350.4
Bias - Bearish
Safe Stop Loss - 3363.2
Technical Indicators: Supper Trend generates a clear short signal while Pivot Point HL is currently determining the overall Bearish trend of the market.
Goal - 3328.2
About Used Indicators:
For more efficient signals, super-trend is used in combination with other indicators like Pivot Points.
Disclosure: I am part of Trade Nation's Influencer program and receive a monthly fee for using their TradingView charts in my analysis.
———————————
WISH YOU ALL LUCK

GOLD: Next Move Is Up! Long!
My dear friends,
Today we will analyse GOLD together☺️
The price is near a wide key level
and the pair is approaching a significant decision level of 3,346.90 Therefore, a strong bullish reaction here could determine the next move up.We will watch for a confirmation candle, and then target the next key level of 3,365.74.Recommend Stop-loss is beyond the current level.
❤️Sending you lots of Love and Hugs❤️

GoldFxMinds XAUUSD Daily Sniper Plan – July 1🌅 Good morning, gold hunters!
The start of a new month is here, and price action is as wild as ever! Yesterday’s liquidity raids swept both sides, leaving most traders guessing – but structure never lies. Let’s break down exactly where the real money sits for July 1, so you never get caught on the wrong side of gold.
🌎 Macro, News & Geopolitics
Macro: US data is in focus (ISM PMI, JOLTS, Powell speech), keeping volatility high and liquidity pools exposed.
Geopolitics: Tensions persist globally but no fresh headlines – market is pure price-driven.
Sentiment: Bulls got trapped high, sellers are hungry for a deeper sweep. Don’t trust easy breakouts!
🏛️ HTF Bias Recap
Weekly: Bullish structure, but overextended. Pullback zones active, buyers get best deals only at true discount.
Daily: Strong wick rejections at supply, sellers showing teeth. Watch for lower highs and failed breakouts.
H4: Range between 3332 and 3258, liquidity building at both edges. Smart money will hunt stops before any trend is real!
🔑 H4 Key Structural Levels
Premium Supply: 3320–3332 (main unmitigated supply block)
Mid Range Decision: 3296–3306 (watch for PA shift, don’t force entries here)
Discount Demand: 3272–3258 (clean OB/imbalance confluence)
Deep Discount Demand: 3232–3218 (ultimate liquidity pocket)
🎯 Sniper Zones (M30/M15 Refined)
SELL Zones:
3320–3332:
The untouched supply – only sell if PA prints a reversal after a NY liquidity grab. Don’t jump in early!
3345–3360:
Extreme extension zone. If price overreaches, look for signs of exhaustion. This is the bear’s last stand!
BUY Zones:
3272–3258:
True discount! Wait for a stop run below 3275, then catch the bounce ONLY if you see confirmation (engulfing, CHoCH, RSI support).
3232–3218:
No hope trades here. Only for flash crash or panic sell-offs with obvious absorption! Wait for a real PA reversal.
Decision Zone:
3296–3306
If price is stuck here, sit on your hands! Let the market show its hand first.
🚦 Quick Recap
Avoid already-mitigated zones – only hunt where liquidity is fresh!
NY session wicks and fake breakouts are the biggest traps. Be patient, let the stop hunt finish before you engage.
Confirmation over prediction. Discipline is your edge, not drawing boxes.
🎁 Bonus Tip
"Missing a sniper entry? The best traders never chase. Let gold come to you. There’s always a second chance for those with patience!"
📣 Like what you see?
Smash that like🚀🚀🚀 , drop your thoughts in the comments , and don’t forget to follow GoldFxMinds for more high-precision gold plans!
Analysis powered by Trade Nation chart feed – built for the sharpest minds in gold.

GOLD 30Min Engaged ( Bearish Reversal Entry Detected )➕ Objective: Precision Volume Execution
Time Frame: 30-Minute Warfare
Entry Protocol: Only after volume-verified breakout
🩸 Bearish Reversal : 3370
Volume Poc + Value
➗ Hanzo Protocol: Volume-Tiered Entry Authority
➕ Zone Activated: Dynamic market pressure detected.
The level isn’t just price — it’s a memory of where they moved size.
Volume is rising beneath the surface — not noise, but preparation.
🔥 Tactical Note:
We wait for the energy signature — when volume betrays intention.
The trap gets set. The weak follow. We execute.
GOLD 30Min Engaged ( Bearish Reversal Entry Detected )

Gold Update: Possible Triangular Consolidation Before New RallyIt looks like corrective wave 4 is in the making within a large Triangle
3 waves A, B and C already emerged in 3-waves structure
which confirms triangle
Wave D should stay under the top of wave B
Wave E could either touch or break down the support line
It should keep above the valley of wave C
Target area changed higher as this consolidation tends to narrowing within a
contracting triangle.
Lowest target now $3,900
Optimistic target is at $4,300
Breakdown below $3,123 would invalidate the pattern

Everybody loves Gold Part 6Great week in Part 5.
Starting this week with a strong bias towards the upside.
Here's a breakdown of trading dynamics:
1. Expecting price to break past green line, level of significance (LOS) for continuation up
2. Price might bounce back for which; will be looking for a continuation from -50/-100 or -150pips to the upside
3. Will be looking for double tops/bottom along the way
As always price action determines trades

XAU/USD – Testing 2H/1H Supply Zone | Breakout or Rejection?XAU/USD – Testing 1H/2H Supply Zone | Bullish Continuation or Rejection Ahead
Gold has rallied strongly from the support zone around 3,238–3,255, breaking multiple intraday resistance levels and now approaching a critical 1H/2H Supply Zone near 3,348–3,366.
This area previously acted as a strong sell-off zone, making it a key decision point.
Scenario 1: Bullish Continuation
If price breaks and closes above 3,366 with momentum, we could see further upside toward the next resistance at 3,400 and possibly retest the ATH zone at 3,486. A short consolidation or retest within the zone would confirm strength.
Scenario 2: Rejection from Supply Zone
If the supply holds, a rejection from the zone could lead to a pullback toward:
3,320.48 (minor support)
3,297.08 (support line)
Or deeper retracement to the 3,255–3,238 support zone
Key Technical Levels
Supply Zone: 3,348 – 3,366
Resistance: 3,400 – 3,486 (ATH)
Support Levels: 3,320 – 3,297 – 3,255 – 3,238
Pivot Line: 3,348

GOLD → Retest of the resistance range. Correction?FX:XAUUSD is recovering amid expectations of lower interest rates in the US, and the falling dollar is also supporting the price of the metal.
The dollar remains under pressure due to political uncertainty in the US, budget concerns, and trade risks. However, strong stock market growth and possible tariff measures against Japan and the EU are also affecting the market, adding volatility to gold
Powell will speak at the ECB forum, and markets are waiting for him to hint at a rate cut. Currently, the probability of a cut in July is estimated at 20%, and in September at 77%. A dovish tone will support gold, while a hawkish tone will increase pressure.
Technically, since the opening of the session, gold has exhausted its daily range (ATR), and there is a fairly high probability that after strong growth, the price may be stopped in the 3347-3350 zone.
Resistance levels: 3347, 3350
Support levels: 3312, 3295
If gold cannot continue to rise after breaking through 3347 and the price returns to the resistance zone, then in this case, we can consider a correction to 0.5-0.7 Fibonacci before a possible continuation of growth.
Best regards, R. Linda!

The bull market is too fierce. How to solve the short position?📰 News information:
1. Geopolitical situation
2. PMI data
📈 Technical Analysis:
The conflict between Iran and Israel has stopped for a while, but there is a possibility of it breaking out again. There is a possibility of triggering risk aversion in the short term. From a technical perspective, the 4H MACD indicator shows a golden cross, and the moving average and other indicators are also radiating upward, with a strong bullish signal. The 1H chart Bollinger Bands open upward, and the short-term pressure position is at 3340-3345. The short-term data indicators are seriously overbought, and there may be a profit correction in the short term. Therefore, if you want to short in the short term, you can only consider the 3340-3350 range. In the short term, gold will not usher in a large retracement, and the short-term target is only suitable for looking at 3320-3310. As for the long trading point, it is expected to wait for the European and American trading hours.
🎯 Trading Points:
SELL 3340-3350
TP 3320-3310
BUY 3325-3315
TP 3335-3340-3350
In addition to investment, life also includes poetry, distant places, and Allen. Facing the market is actually facing yourself, correcting your shortcomings, confronting your mistakes, and strictly disciplining yourself. I hope my analysis can help you🌐.
TVC:GOLD OANDA:XAUUSD FOREXCOM:XAUUSD PEPPERSTONE:XAUUSD FXOPEN:XAUUSD FX:XAUUSD


XAUUSD Analysis – 01/07: Gold Sees a Rebound Amid USD WeaknessXAUUSD Analysis – 01/07: Gold Sees a Rebound Amid USD Weakness – Is a Recovery on the Cards?
As we enter the new month, gold prices are showing signs of recovery after a significant drop, primarily driven by the weakening of the US Dollar. However, despite some positive momentum, the path to sustained growth remains uncertain.
💵 USD Weakness Fuels Gold's Potential Rebound
Recent US economic data shows a slight decrease in consumer spending, which has led to speculation that the Federal Reserve may ease interest rate hikes in the near future.
This, in turn, has contributed to a weaker USD, providing an opportunity for gold to recover slightly.
⚖️ The Federal Reserve's Role Remains Critical
The markets are awaiting further clues on the Federal Reserve's next moves, especially with the ongoing debate about the potential direction of interest rates.
While the recent economic data isn't weak enough to force a policy reversal, it hasn't been strong enough to give the Fed the confidence to continue its hawkish stance either.
🧠 What Does This Mean for Traders?
Gold is responding to macroeconomic factors but still lacks a clear, strong trend.
Volatility remains high, with sharp price fluctuations occurring after key economic and political announcements. This uncertainty suggests gold might not yet have the momentum for a definitive break-out or trend reversal.
🔶 Summary:
Gold is starting to recover after a tough month but the outlook remains cautious.
Buyers are hoping for a Fed rate cut, while sellers are banking on the USD's strength.
Traders should stay vigilant, waiting for clear confirmation before making major moves.
📊 Key Levels to Watch:
Resistance Levels: 3358 – 3360 – 3364 – 3375 – 3380
Support Levels: 3300 – 3290 – 3280 – 3275
🎯 Trading Strategy:
🔵 Buy Zone:
Entry: 3310 – 3315
SL: 3300
TP: 3320 – 3330 – 3340 – 3350 – 3360
🔴 Sell Zone:
Entry: 3370 – 3375
SL: 3380
TP: 3360 – 3350 – 3340 – 3325
⚠️ Final Thoughts:
With USD weakness persisting, gold may continue its rebound, but the market remains uncertain.
Keep an eye on macroeconomic data and geopolitical events, as they will likely shape gold's next move.

GBPJPY H4 XABCD Short at Market TP Below Market🔸Hello traders, let's review the 4 hour chart for GBPJPY. Strong gains off the lows recently, however price getting overextended and expecting reversal later at/near PRZ/D.
🔸Speculative XABCD structure defined by point X 199 point A 188 point B 195.20 point C 186.80 point D/PRZ 198.40/80 .
🔸Currently most points validated, point D/PRZ validated as well.
Short sell at market SL over point D/PRZ TP details see chart
🔸Recommended strategy for GJ traders: Short Sell at Market
SL over point D/PRZ TP1 193.30 TP2 191.00 TP3 188.80.
🎁Please hit the like button and
🎁Leave a comment to support our team!
RISK DISCLAIMER:
Trading Futures , Forex, CFDs and Stocks involves a risk of loss.
Please consider carefully if such trading is appropriate for you.
Past performance is not indicative of future results.
Always limit your leverage and use tight stop loss.

GOLD GOES 'PREPARING FOR SCORCHING-HOT JULY'. UPSHOT OF 1H 2025Gold market shines bright in first half of 2025, with nearly 25 percent year-to-date gain, which becomes one of the best start of the year in history ever following 1H 2016 (became a launching pad for Gold to more than Triple in price over next decade) and 1H 1973 (where Gold bugs sharply skyrocketed to infinity and beyond, printed more than 10x over next decade).
The gold spot market in July 2025 is shaped by both fundamental and technical factors supporting a cautiously bullish outlook.
Fundamental perspectives
Were you ready or not, Gold prices have surged significantly in 2025, driven by persistent global uncertainties including geopolitical conflicts (e.g., Middle East tensions), trade disputes, and inflation concerns.
Central banks, notably the Federal Reserve, are expected to cut interest rates later in 2025, reducing the opportunity cost of holding gold, a non-yielding asset. This monetary easing alongside continued inflation worries and safe-haven demand underpins strong gold fundamentals.
Major financial institutions like J.P. Morgan and UBS forecast gold prices averaging around $3,500–$3,675 per ounce in late 2025, with potential to reach $4,000/oz by mid-2026.
Central bank gold purchases and diversification away from US dollar assets also support demand.
Technical perspectives
Technically, gold has experienced volatile but mostly sideways trading in a roughly $300 range around $3,200–$3,500 since mid-2025, reflecting consolidation after a strong rally earlier in the year.
Key support lies near $3,000 and $3,200 levels (125-Day, or 6-Month SMA), with resistance around $3,500 to $3,800. Indicators such as moving averages and RSI suggest an upward trend with possible short-term corrections.
A breakout above $3,500 could trigger further gains toward $3,800, while a drop below $3,200 may lead to testing $3,000 support.
Overall, July is expected to see continued range-bound trading amid new external uncertainties, with bullish momentum intact.
In summary, gold’s fundamentals remain robust due to macroeconomic and geopolitical drivers, while technicals point to consolidation with potential for renewed upward moves in the July 2025 spot market.
--
Best #GODL wishes,
@PandorraResearch Team 😎
