GOLD - WAVE 5 BULLISH TO $3,622 (UPDATE)Like I said on the last update, Gold is currently going through a strong 'accumulation' phase for buyers, hence why we're seeing these choppy price actions, trying to liquidate buyers.
As long as Gold is ABOVE THE WAVE 2 LOW, market structure still favours buyers. Breaking below this low, will invalidate bullish structure.
Wave 2 Invalidation Level - $3,245❌
Gold

GOLD: Strong Bearish Sentiment! Short!
My dear friends,
Today we will analyse GOLD together☺️
The price is near a wide key level
and the pair is approaching a significant decision level of 3,368.04 Therefore, a strong bearish reaction here could determine the next move down.We will watch for a confirmation candle, and then target the next key level of 3,359.44..Recommend Stop-loss is beyond the current level.
❤️Sending you lots of Love and Hugs❤️

GOLD My Opinion! BUY!
My dear friends,
Please, find my technical outlook for GOLD below:
The price is coiling around a solid key level - 3367.9
Bias - Bullish
Technical Indicators: Pivot Points Low anticipates a potential price reversal.
Super trend shows a clear buy, giving a perfect indicators' convergence.
Goal - 3379.6
Safe Stop Loss - 3360.8
About Used Indicators:
The pivot point itself is simply the average of the high, low and closing prices from the previous trading day.
Disclosure: I am part of Trade Nation's Influencer program and receive a monthly fee for using their TradingView charts in my analysis.
———————————
WISH YOU ALL LUCK

SPY/QQQ Plan Your Trade For 6-19: GAP Reversal Counter TrendToday's pattern is a GAP Reversal in Counter Trend mode. I believe this could represent a breakdown in the ES/NQ as the US stock market is closed for the Juneteenth holiday.
Obviously, after the Fed comments yesterday (stating "uncertainty") and with the continued Israel/Iran conflict playing out, it makes sense to me that the US markets would move into a pre-weekend consolidation phase.
Even though the US stock market will be closed, the futures market will likely stay open and will carry some general market sentiment and reactions to news.
Watching Gold/Silver and Bitcoin should be very interesting today. I suspect the markets will continue to consolidate downward today - leading to a potential breakdown seeking support day on Friday.
Buckle up. We'll likely have 3-5+ days of news related to the Israel/Iran conflict and other issues over this weekend. It could be very interesting to see how the global markets move through this news.
Get some.
Happy Juneteenth
#trading #research #investing #tradingalgos #tradingsignals #cycles #fibonacci #elliotwave #modelingsystems #stocks #bitcoin #btcusd #cryptos #spy #gold #nq #investing #trading #spytrading #spymarket #tradingmarket #stockmarket #silver


DeGRAM | GOLD aim to test the lower boundary📊 Technical Analysis
● Hourly price is defending the channel’s lower half: three consecutive wicks bounced at 3 360, forming a descending flag whose base coincides with the dynamic support.
● OBV is edging higher while the flag narrows; a close above 3 408 would unlock the flag-measured move toward the upper rail / horizontal target at 3 444–3 450.
💡 Fundamental Analysis
● World Gold Council reports India’s jewellery demand rebounded 8 % w/w as monsoon concerns eased, while CME data show fresh 6 K-lot COMEX short-covering after the latest FOMC testimony tempered rate-hike talk.
✨ Summary
Long 3 360–3 380; flag break > 3 408 eyes 3 444 → 3 450. Bull view void on an H1 close below 3 343.
-------------------
Share your opinion in the comments and support the idea with a like. Thanks for your support!

XAUUSD: Market Analysis and Strategy for June 19Gold technical analysis
Daily chart resistance 3450, support below 3338
Four-hour chart resistance 3400, support below 3338
One-hour chart resistance 3375, support below 3350
Fundamentally, the geopolitical situation has eased. The market was affected by the Fed's decision this week to keep interest rates unchanged and not cut interest rates, which weakened the bullish momentum and buyers took profits, leading to a decline.
From the current trend analysis, the support below focuses on the four-hour level 3338 and the one-hour level 3350 support. The upper pressure focuses on the suppression near the daily level 3450, and the short-term long-short strength and weakness dividing line 3400. Keep the high-selling and low-buying range operation during the day.
Sell: 3375near SL: 3380
Sell: 3350near SL: 3355
Buy: 3338near SL: 3333

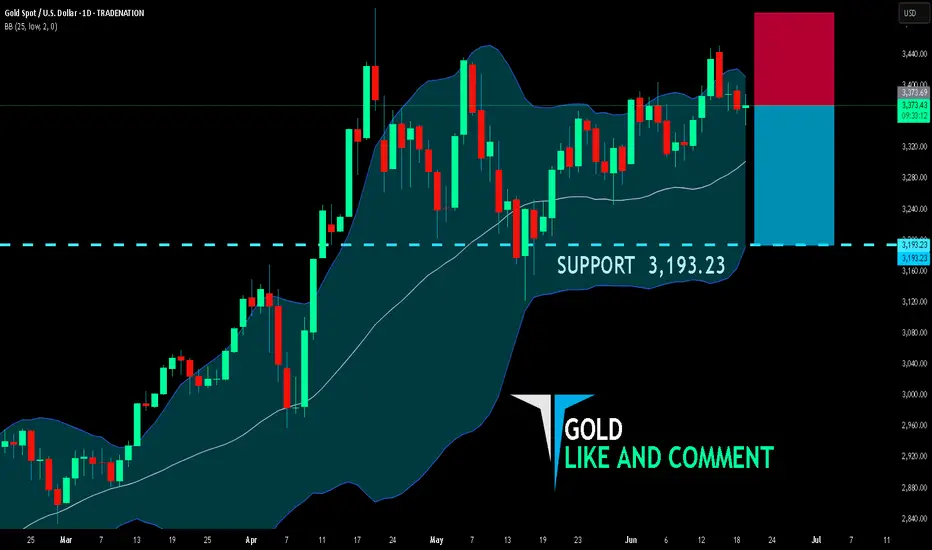
GOLD BEARISH BIAS RIGHT NOW| SHORT
GOLD SIGNAL
Trade Direction: short
Entry Level: 3,373.69
Target Level: 3,193.23
Stop Loss: 3,493.66
RISK PROFILE
Risk level: medium
Suggested risk: 1%
Timeframe: 1D
Disclosure: I am part of Trade Nation's Influencer program and receive a monthly fee for using their TradingView charts in my analysis.
✅LIKE AND COMMENT MY IDEAS✅
Gold Falls Back Despite Geopolitical Tensions,Eyes on 3404 BreakGOLD – Overview
Gold Falls, Erasing War-Driven Gains
Gold has reversed all gains made since Israel launched strikes against Iran, despite rising geopolitical tensions.
The precious metal failed to hold its safe-haven bid and now appears to be entering a technical correction phase.
While the Federal Reserve struck a dovish tone during Wednesday’s meeting — signaling potential rate cuts this year — real rates remain elevated, which continues to weigh on non-yielding assets like gold.
Technical Outlook:
Gold corrected perfectly to our support level at 3347, as forecasted in the previous idea.
• As long as price trades above 3365, bullish momentum remains active
• Next targets: 3393 → 3404
• A 1H candle close above 3404 would confirm bullish continuation toward 3430 and 3448
A break below 3347 would shift the structure bearish.
Key Levels:
• Support: 3365 / 3347 / 3322
• Resistance: 3393 / 3404 / 3430 / 3448
previous idea:

XAU/USD) Back Bullish trand Read The captionSMC Trading point update
Technical analysis of Gold (XAU/USD) on the 3-hour timeframe based on a price action setup within a rising channel and a key support zone. Here's a breakdown of the analysis:
---
Technical Overview:
Trend Structure:
The price is moving within a rising channel (marked by the black trendlines). Recent touches on both the top and bottom of the channel suggest that it is being respected.
Key Support Zone (Yellow Box):
Price recently tested a strong support zone around $3,338 – $3,350, which aligns with:
Historical price reaction area.
The 200 EMA (blue line).
An uptrend line support.
A bullish reaction (green arrow) confirming demand.
Bear Trap Breakout:
There’s a false breakout below the support followed by a sharp reversal (green arrow), which could indicate a bear trap, often followed by a bullish rally.
Price Projection:
The projected move suggests a bullish rally toward $3,478.89, offering a potential 3.97% gain (~133 points).
The path includes a possible consolidation before a breakout (illustrated by the wavy arrow).
RSI Indicator:
RSI is recovering from the oversold zone (~45), indicating increasing bullish momentum.
Mr SMC Trading point
---
Trade Idea Summary:
Bias: Bullish
Entry Zone: Around $3,350–$3,370 (post-retest of support)
Target: $3,478.89
Confirmation: Bullish price action at support, 200 EMA bounce, RSI reversal
---
Please support boost 🚀 this analysis)

XAU/USD) Back support level Read The captionSMC trading point update
Technical analysis of XAU/USD (Gold Spot vs U.S. Dollar) – 2H Timeframe:
---
XAU/USD Bearish Rejection from Resistance – Short-Term Sell Setup
Key Observations:
1. Rejection from Upper Channel & Resistance Zone:
Price was rejected sharply after touching the upper boundary of the ascending channel and the newly established resistance zone (~3400–3420).
A strong bearish candle confirms selling pressure at the top.
2. Support Retest in Progress:
The price is currently descending toward the EMA 200 and the KYY support zone (approximately 3343–3348).
The previous bounce originated from this level, making it a significant retest zone.
3. EMA 200 as Confluence:
The 200 EMA (currently at 3346.92) aligns with the support zone, increasing the likelihood of a bounce or at least temporary pause in bearish momentum.
4. RSI Bearish Signal:
RSI has dropped below 50, confirming a momentum shift toward the downside.
Still above oversold territory, suggesting more downside room.
---
Trade Idea:
Bias: Bearish (Short-Term)
Entry Zone: Around 3390–3400 (confirmed rejection area)
Target Zone: 3348 – 3343 (KYY support + EMA 200)
Stop Loss: Above 3425 (just above resistance zone)
Mr SMC Trading point
---
Summary:
Gold has faced a clear rejection at a key resistance zone within an ascending channel, and is now targeting the EMA 200 and previous structural support. Short opportunities could be considered toward the 3343–3348 zone, with RSI and price action supporting the move.
Please support boost 🚀 this analysis)

Hanzo / Gold 30 Min ( Accurate Tactical Break Out Zones )🔥 Gold – 30 Min Scalping Analysis (Bearish Setup)
⚡️ Objective: Precision Breakout Execution
Time Frame: 30-Minute Warfare
Entry Mode: Only after verified breakout — no emotion, no gamble.
👌Bullish After Break : 3374
Price must break liquidity with high volume to confirm the move.
👌Bearish After Break : 3338
Price must break liquidity with high volume to confirm the move.
☄️ Hanzo Protocol: Dual-Direction Entry Intel
➕ Zone Activated: Strategic liquidity layer detected — mapped through refined supply/demand mechanics. Volatility now rising. This isn’t noise — this is bait for the untrained. We're not them.
🦸♂️ Tactical Note:
The kill shot only comes after the trap is exposed and volume betrays their position.

Accurately grasp the interest rate trend, today's gold layout📰 Impact of news:
1. The interest rate remains unchanged and leads to new lows in the short term
2. Geopolitical tensions provide support for risk aversion
📈 Market analysis:
I told you yesterday that 3363 is not the recent low. Today's lowest point has reached around 3347. The current day's K-line closed with a medium-sized negative line with balanced upper and lower shadows. The shape shows that gold will fluctuate in the short term and be bearish. Therefore, it is not suitable to blindly guess the bottom in the short term. As geopolitical tensions still exist, it is expected that the lowest level may reach 3330. During the day, focus on the upper resistance range of 3380-3390. If the rebound is blocked, try to intervene with short orders. The lower support is at the key level of 3330-3320. Pay attention to the defense of the support area.
🏅 Trading strategies:
BUY 3335-3325
TP 3360-3380-3390-3400
SELL 3375-3385
TP 3365-3355-3345-3300
OANDA:XAUUSD FX:XAUUSD FOREXCOM:XAUUSD FXOPEN:XAUUSD TVC:GOLD

Gold Market Update: Bulls Will target 3750 USD after 3500 USD🏆 Gold Market Mid-Term Update (June 19, 2025)
📊 Price & Technical Outlook
Current Spot Price: ~$3,365
Technical Setup
Inverted H&S pattern forming/completed on higher timeframes — confirms bullish reversal structure.
Reload (buy) zone: $3,250–$3,275 (ideal accumulation range for bulls if price pulls back).
Swing trade setup: Entry: $3,250–$3,275 (reload zone)
Take Profit (TP): $3,750
Support: Major at $3,250–$3,275 (break below = reassess bullish bias).
Resistance: $3,450–$3,500 ; next major resistance: $3,600, then $3,750.
Price consolidating above $3,250–$3,350 is technically healthy — maintaining bullish structure.
🏆 Bull Market Overview
The pullback appears complete; uptrend resumes amid strong macro/geopolitical drivers (inflation, rates, safe haven flows).
Key Levels: $3,000 (macro support), $3,250 (bulls must defend), $3,500 (breakout zone), $3,750 (swing TP).
Short-term dips = buying opportunities — “Buy the Dip” remains favored as long as support holds. Upside targets: Immediate: $3,600 Swing target: $3,750
Summary:
Gold remains in a bullish mid-term structure, with the inverted H&S pattern pointing to higher prices ahead. Bulls look to reload at $3,250–$3,275, targeting $3,750 for swing trades. As long as $3,180–$3,200 holds, buying dips is the play. A sustained breakout above $3,400–$3,600 opens the door for new all-time highs.

XAUUSD - 4H Breakout and Retest Setup🟡🟡🟡
🕒 June 17, 2025
Bias: Medium-Term Bullish
Structure: Breakout → Retest → Continuation
Context: Trendline break + confluence with EMA + prior resistance turned support
🔍 Market Structure Insight:
Major descending trendline broken with strong impulsive momentum.
Pullback held at the intersection of:
Broken trendline retest
EMA 60 dynamic support
Bullish structure of HL-HH (Higher Low / Higher High)
Strong bullish candle at support
✅ Trade Plan – Buy Stop Setup
Entry (Buy Stop): 3402
SL: 3373 (below the pullback structure + EMAs)
TP1: 3430 (local resistance area)
TP2: 3470 (measured move from previous leg height)
#XAUUSD #Gold #TechnicalAnalysis #BreakoutSetup #Forex #EMA #SqueezePlay #TrianglePattern #tradingview #MJTrading

Gold Climbs as Israel-Iran Conflict DeepensGold rose toward $3,380 on Thursday, recovering earlier losses as safe-haven demand grew amid the escalating Israel-Iran conflict, now in its seventh day. Reports say Israel hit over 20 sites near Tehran, including nuclear and missile facilities, while the U.S. may join the strikes, raising fears of a broader war.
Meanwhile, the Fed held rates steady Wednesday but signaled two possible cuts this year, despite high inflation and slowing growth. The move followed renewed pressure from President Trump for deeper cuts.
Resistance is seen at $3,370, while support holds at $3,316

Gold Breaks the Range: Trend Reversal or Just a Fakeout?XAUUSD – Gold Breaks the Range: Trend Reversal or Just a Fakeout?
After several days of sideways action, gold has finally broken out of its consolidation channel — but not upward. The price action signals uncertainty, while underlying global risks suggest a larger move may be brewing. With US markets closed for a bank holiday, low liquidity could lead to sharp, unexpected spikes — traders, stay alert.
🌍 Macro & Fundamental Outlook
📌 As widely expected, the Federal Reserve held rates steady, but Fed Chair Powell maintained a hawkish tone, warning that inflation risks remain due to ongoing geopolitical instability and rising commodity costs.
🔥 The gold market now hinges on two major geopolitical scenarios in the Middle East:
If the US intervenes diplomatically to ease tensions between Iran and Israel, gold may continue to correct further — possibly into the 3,325 – 3,300 range or lower.
However, if reports are accurate that Trump is coordinating with Israel for potential strikes on Iran, gold could spike aggressively as safe-haven demand surges toward 3,417 – 3,440.
📊 Technical Breakdown (M30 – H1)
Price has broken below the range-bound structure, suggesting a potential momentum shift to the downside.
The EMA cluster (13–34–89–200) is sloping downward, confirming bearish short-term pressure.
The 3,345 level has acted as support, but if it gives way, 3,325 becomes a critical liquidity zone where buyers may step in.
✅ Trading Plan
🟢 BUY ZONE 1: 3,325 – 3,328
Entry: Only after a clear bullish reversal (pin bar / bullish engulfing candle)
SL: Below 3,320
TP: 3,345 → 3,360 → 3,373 → 3,384
🟢 BUY ZONE 2: 3,345 – 3,348
Entry: On price retest and bullish confirmation
SL: Below 3,340
TP: 3,360 → 3,373 → 3,384 → 3,403
🔴 SELL ZONE: 3,417 – 3,440
Entry: If price rallies into resistance with no supporting fundamentals
SL: Above 3,445
TP: 3,403 → 3,384 → 3,360 → 3,345
💬 Final Thoughts
Gold is at a pivotal point. While today’s break could indicate a new leg down, we’ve seen countless false breakouts during low liquidity sessions. Only trade on confirmation — not emotion. Watch for geopolitical headlines and let price action guide your risk-adjusted decisions.
Stay patient. Stay sharp. Let the market prove itself before you do.

Hanzo / Gold 30 Min ( Accurate Tactical Break Out Zones )🔥 Gold – 30 Min Scalping Analysis (Bearish Setup)
⚡️ Objective: Precision Breakout Execution
Time Frame: 30-Minute Warfare
Entry Mode: Only after verified breakout — no emotion, no gamble.
👌Bullish After Break : 3345
Price must break liquidity with high volume to confirm the move.
👌Bearish After Break : 3400
Price must break liquidity with high volume to confirm the move.
☄️ Hanzo Protocol: Dual-Direction Entry Intel
➕ Zone Activated: Strategic liquidity layer detected — mapped through refined supply/demand mechanics. Volatility now rising. This isn’t noise — this is bait for the untrained. We're not them.
🩸 Momentum Signature Detected:
Displacement candle confirms directional intent — AI pattern scan active.
— If upward: Bullish momentum burst.
— If downward: Aggressive bearish rejection.
🦸♂️ Tactical Note:
The kill shot only comes after the trap is exposed and volume betrays their position.

Gold Price Reacts Strongly at 3,350.During the trading session on June 19, gold (XAUUSD) experienced significant volatility, breaking below the short-term support zone around 3,370 USD/oz and sharply dropping to an intraday low of approximately 3,350 USD/oz. This support level had been tested multiple times in previous sessions and has often led to price rebounds.
Following the sharp decline, buying pressure emerged, as shown by a strong reversal candlestick accompanied by a volume spike — indicating that buyers are stepping in at this attractive price zone.
Technical Breakdown – 15-Minute Chart
Chart type: XAUUSD, 15-minute timeframe
Support zone: 3,350 (tested and showing reaction)
Nearby resistance: 3,365 – 3,370
Volume: Surged at the bottom, suggesting buying interest.
Pattern: Signs of a temporary bottom (bullish pin bar + supporting volume).
Suggested Trading Strategy
Based on today’s price action and chart structure, consider:
Short-term buy around 3,351 – 3,353 with a stop loss below 3,348.
Take profit targets: 3,365 – 3,372.
Extended strategy: If EMA5 crosses up and locks above 3,370, extend targets to 3,388 – 3,395 during the US session.
Conclusion: 3,350 is Acting as the Final Support Wall
Today’s session shows that sellers are still in control, but technical reactions around 3,350 have formed a strong defense. If price continues to hold this level and volume remains positive, a short-term rebound is highly likely.
However, traders should manage positions with flexibility as the broader trend still leans bearish — only a break and hold above 3,370–3,380 could signal a clearer trend reversal.

Price recently broke down from a descending wedge.📊 Gold (XAUUSD) – 1H Chart Analysis
Structure Overview:
Price recently broke down from a descending wedge/consolidation pattern after forming lower highs and lower lows — a classic sign of bearish pressure building up.
🔻 Bearish Breakout in Play:
The sharp move down through the wedge's lower boundary suggests strong momentum to the downside. This aligns with the previous rejection from the top of the falling channel.
🔮 Potential Scenarios:
1. Bearish Continuation (Primary Bias):
If price sustains below the wedge support and fails to reclaim the breakout zone, we could see a further decline toward lower support levels (as shown in the downward arrow).
Watch for possible reactions at 3350 → 3345 → 3340 zones.
2. Bullish Fakeout Recovery (Alternative):
If price quickly reclaims the broken trendline and forms a bullish engulfing or breakout structure, it could invalidate the breakdown, signaling a possible reversal and rally back up toward 3380+ (as indicated by the upward projection).
⚠️ Key Levels to Watch:
Support: 3350 / 3345 / 3340
Resistance: 3365 / 3380
Zone of interest: Retest of wedge breakdown area
📌 Insight:
The market has broken below the daily bullish FVG CE level, further supporting the bearish bias — but retests can trap sellers, so remain flexible.

Potential bearish drop off major support?The Gold (XAU/USD0 has broken out of the pivot which acts as an overlap support and could drop to the 1st support which has been identified as an overlap support.
Pivot: 3,374.04
1st Support: 3,341.44
1st Resistance: 3,398.38
Risk Warning:
Trading Forex and CFDs carries a high level of risk to your capital and you should only trade with money you can afford to lose. Trading Forex and CFDs may not be suitable for all investors, so please ensure that you fully understand the risks involved and seek independent advice if necessary.
Disclaimer:
The above opinions given constitute general market commentary, and do not constitute the opinion or advice of IC Markets or any form of personal or investment advice.
Any opinions, news, research, analyses, prices, other information, or links to third-party sites contained on this website are provided on an "as-is" basis, are intended only to be informative, is not an advice nor a recommendation, nor research, or a record of our trading prices, or an offer of, or solicitation for a transaction in any financial instrument and thus should not be treated as such. The information provided does not involve any specific investment objectives, financial situation and needs of any specific person who may receive it. Please be aware, that past performance is not a reliable indicator of future performance and/or results. Past Performance or Forward-looking scenarios based upon the reasonable beliefs of the third-party provider are not a guarantee of future performance. Actual results may differ materially from those anticipated in forward-looking or past performance statements. IC Markets makes no representation or warranty and assumes no liability as to the accuracy or completeness of the information provided, nor any loss arising from any investment based on a recommendation, forecast or any information supplied by any third-party.

XAU/USD 4H Market Analysis- 19 June 2025XAU/USD 4H Market Analysis
Market Structure: Gold has been in a mild uptrend on the 4‑hour chart, making higher lows and highs since early June. The recent swing high was around ~$3,428 (mid-June), and price has pulled back toward the rising support line near ~$3,373.
A break above the recent high (around $3,404–$3,428) would continue the bull trend; conversely, a drop below the ~3,373 trendline/50% Fib level would signal a bearish turn.
In other words, bulls remain in control as long as ~$3,373 holds – breaking that would threaten lower support around ~$3,338.
Overall Bias: Moderately bullish on 4H. Gold is respecting its rising trendline and 50-period EMA, and analysts note that holding above ~$3,373 keeps the uptrend intact.
Momentum (MACD) is neutral to slightly bearish short-term, so we expect consolidations and range bounces more than a reversal.
In summary, assume an upward bias while price stays above key support near $3,370–$3,380; a firm break below would flip bearish.
Key SMC/Zones:
Price is currently in a range/consolidation roughly between $3,370 and $3,400.
Important zones include:
Demand (Support) Zone:
~ $3,368–$3,378 — this 50% Fib retracement area has been defended as a bullish order block.
Below that, stronger supports sit near ~ $3,354 and $3,333 .
Supply (Resistance) Zone:
~$3,395–$3,415 — a cluster of swing highs and Fib levels. Analysts highlight $3,395, $3,412, $3,435 and even $3,450 as major resistance barriers.
In particular, the $3,400 level is a known psychological and technical ceiling.
Trendlines/BOS: The rising 4H trendline (currently near $3,370–$3,380) is key support.
A break of structure (BOS) below that line would be a bearish Change-of-Character. Similarly, the prior swing low around $3,373 is a flip zone – bulls want to keep that hold.
Liquidity: Stop-loss/liquidation clusters may lie just above recent highs ($3,428–$3,450) and just below recent lows ($3,338–$3,354). For example, stops above $3,428 could fuel a rally if hit, and stops below $3,338 could accelerate a drop.
In short, high-probability zones on the 4H chart are around ~$3,370 (demand/support) and ~$3,400 (supply/resistance).
We’ll look for trades that align with that structure (see setups below).
1H Trade Setups (Aligned with 4H Bias)
Long around $3,370–3,375 (Buy Dip to Demand Zone) –
Entry: ~3,370–3,375 (green zone). Stop: ~$3,365 (≈$5 below zone). Take-Profit: $3,380 first, then $3,390–$3,400.
Reason: This zone is a 4H demand area (50% Fib + order block) and coincides with the rising 4H trendline.
Price has repeatedly bounced here, so a bullish reversal is likely.
Trigger: Look for a bullish 1H signal (e.g. engulfing or pin bar) at ~3,370–3,375, or a break of the short-term 1H down-structure.
Entry on such a signal would target a retest of the mid-range (~3,380) and beyond toward resistance.
Short around $3,395–3,400 (Sell Rally to Supply) –
Entry: ~3,395–3,400 (red zone). Stop: ~$3,405 (≈$5 above zone). Take-Profit: $3,375 first, then $3,365.
Reason: This area is a clear 4H supply zone (near multiple Fibonacci levels/resistance).
It’s just below the $3,400 psychological barrier. A failure or bearish reversal here would likely send price back toward the demand zone below.
Trigger: Watch for a bearish 1H candle or a break of the short-term 1H up-structure in the 3,395–3,400 range. A clear rejection (e.g. bearish engulfing or strong wick) would be the signal to enter short.
(Note: If price breaks cleanly above $3,405–3,410 instead, a bullish continuation trade would then be favored, targeting $3,415+.)
Takeaway: Trade gold with the 4H structure in mind. With price above the ~$3,370 trend support, favor longs on pullbacks into that demand zone and shorts only at proven supply near $3,400. Always use a tight ~$5 stop beyond each zone and scale out at logical pivot levels to manage risk.

XAU - Its TIME!After all the fall comes a time, Though i have made the chart earlier and cant illustrate where i did but yes thing is commencing soon as stated! marked the drawing what i drew

GOLD Rising Support Ahead! Buy!
Hello,Traders!
GOLD is trading in an uptrend
So despite the price is going
Down now we will be expecting
A strong rebound and a move up
After the price hits the
Rising support below
Buy!
Comment and subscribe to help us grow!
Check out other forecasts below too!
Disclosure: I am part of Trade Nation's Influencer program and receive a monthly fee for using their TradingView charts in my analysis.
