Gold corrective pullback support at 3245The Gold remains in a bullish trend, with recent price action showing signs of a corrective pullback within the broader uptrend.
Support Zone: 3245 – a key level from previous consolidation. Price is currently testing or approaching this level.
A bullish rebound from 3245 would confirm ongoing upside momentum, with potential targets at:
3310 – initial resistance
3320 – psychological and structural level
3340 – extended resistance on the longer-term chart
Bearish Scenario:
A confirmed break and daily close below 3245 would weaken the bullish outlook and suggest deeper downside risk toward:
3220 – minor support
3205 – stronger support and potential demand zone
Outlook:
Bullish bias remains intact while the Gold holds above 3245. A sustained break below this level could shift momentum to the downside in the short term.
This communication is for informational purposes only and should not be viewed as any form of recommendation as to a particular course of action or as investment advice. It is not intended as an offer or solicitation for the purchase or sale of any financial instrument or as an official confirmation of any transaction. Opinions, estimates and assumptions expressed herein are made as of the date of this communication and are subject to change without notice. This communication has been prepared based upon information, including market prices, data and other information, believed to be reliable; however, Trade Nation does not warrant its completeness or accuracy. All market prices and market data contained in or attached to this communication are indicative and subject to change without notice.
Gold

GOLD SELLERS WILL DOMINATE THE MARKET|SHORT
GOLD SIGNAL
Trade Direction: short
Entry Level: 3,339.37
Target Level: 3,313.04
Stop Loss: 3,356.82
RISK PROFILE
Risk level: medium
Suggested risk: 1%
Timeframe: 1h
Disclosure: I am part of Trade Nation's Influencer program and receive a monthly fee for using their TradingView charts in my analysis.
✅LIKE AND COMMENT MY IDEAS✅

GOLD SHORT FROM RESISTANCE
GOLD SIGNAL
Trade Direction: long
Entry Level: 3,380.73
Target Level: 3,335.74
Stop Loss: 3,410.56
RISK PROFILE
Risk level: medium
Suggested risk: 1%
Timeframe: 3h
Disclosure: I am part of Trade Nation's Influencer program and receive a monthly fee for using their TradingView charts in my analysis.
✅LIKE AND COMMENT MY IDEAS✅

GOLD BEARS WILL DOMINATE THE MARKET|SHORT
GOLD SIGNAL
Trade Direction: short
Entry Level: 3,419.53
Target Level: 3,348.85
Stop Loss: 3,466.65
RISK PROFILE
Risk level: medium
Suggested risk: 1%
Timeframe: 6h
Disclosure: I am part of Trade Nation's Influencer program and receive a monthly fee for using their TradingView charts in my analysis.
✅LIKE AND COMMENT MY IDEAS✅

Watching Gold Tap Liquidity Before the Next DropGold is still clearly in a bearish structure on the 1 hour chart. We’ve seen a solid break of structure to the downside and price is now retracing.
What stands out is how price is pushing back up into multiple areas of interest. There’s liquidity resting just above this minor high along with a fair value gap and the underside of a bearish trendline. This cluster makes it a likely spot for sellers to step back in.
If price fills the imbalance around that FVG, it could set up the next leg lower. I’ll be watching closely for signs of rejection in this zone to see if the market is ready to continue the move down.
No reason to rush in early. Let price come to the levels that matter and confirm with a reaction. Staying patient pays.

GOLD H2 Intraday Chart update for 30 June 2025Hello Traders,
As you can see that there are some solid in the market since morning, right now market is sustains below 3300 Psychological Level and move towards 3270-75 key support zone and then at 3350
Monthly candlestick closing also due today
only if market breaks 3305 successfully today then GOLD will move towards 3335
Disclaimer: Forex is Risky

DeGRAM | GOLD under the resistance area📊 Technical Analysis
● Price broke the long-standing rising-channel floor, then formed a clean bear flag inside a fresh down-sloping channel; the flag’s ceiling coincides with the 3 300-3 310 supply band.
● Lower-high sequence and confluence of flag top with former support turned resistance favour continuation toward the mid-channel / fib pivot at 3 246, next 3 180.
💡 Fundamental Analysis
● Friday’s hotter US core-PCE and Fed governor Bowman’s “no cuts in 2025” comment lifted 2-yr yields above 4.80 %, firming the DXY and draining flows from non-yielding gold.
✨ Summary
Sell 3 290-3 305; hold below 3 310 targets 3 246 → 3 180. Short bias void on an H4 close above 3 310.
-------------------
Share your opinion in the comments and support the idea with a like. Thanks for your support!

XAUUSD Under Pressure: What the Market Is Telling UsGold (XAUUSD) is currently trading with a clear bearish bias, showing sustained downside momentum on the 4H timeframe 🕒. Price has been gradually stepping lower, and the structure continues to favor the sellers.
As expected for early in the week, there’s been a bit of choppy movement ⚖️, but the overall sentiment remains weak. Unless we see a strong shift or catalyst, I’ll be maintaining a bearish outlook.
🧭 I’m watching for price to revisit key resistance levels, and if we get a clean break and retest 🔄, I’ll be looking for potential short setups from areas of previous demand that flip into resistance.
🌐 Keep an eye on broader risk sentiment — if NASDAQ starts pulling back or DXY strengthens, it could fuel further downside in gold.
As always, this is not financial advice, but the detailed breakdown is available in the latest video 🎥.

GOLD: The Market Is Looking Down! Short!
My dear friends,
Today we will analyse GOLD together☺️
The in-trend continuation seems likely as the current long-term trend appears to be strong, and price is holding below a key level of 3,295.36 So a bearish continuation seems plausible, targeting the next low. We should enter on confirmation, and place a stop-loss beyond the recent swing level.
❤️Sending you lots of Love and Hugs❤️

THE KOG REPORTTHE KOG REPORT:
In last week’s KOG Report we said we would be looking for price to attempt that higher level and potentially break for higher pricing. If it didn’t the path showed the level for an opportunity to short which fell just short but worked well into the level we initially wanted.
We then published the red box targets and the bias through the week which held, and we managed to complete all bearish targets by Friday.
Was it easy? No! Did we expect that flush? No! We simply got to a stage on Friday where we could only watch or get in with the volume, so we stood back and just watched.
So, what can we expect in the week ahead?
Simple one this week. We can see potential for lower, however, we’re too low to attempt shorting this, especially with the key level 3250-55 just below and major support. For that reason, we published the red boxes to help you all, look for the break either side! Ideally, we want to support on the low from the open and then continue with the move upside into the 3280-85 level initially, which should flip us on the support at 3270-75. We could range there as there is no news tomorrow but a gradual incline is what we’re looking for.
Support 3250-55 needs to break for lower, while resistance 3306-10 is the level that needs to break to go higher. That’s our potential range for now.
KOG’s bias for the week:
Bullish above 3250 with targets above 3278, 3285, 3297 and above that 3306
Bearish below 3250 with targets below 3240, 3232, 3220 and below that 3212
RED BOX TARGETS:
Break above 3275 for 3279, 3285, 3289 and 3306 in extension of the move
Break below 3260 for 3255, 3251, 3240 and 3235 in extension of the move
Please do support us by hitting the like button, leaving a comment, and giving us a follow. We’ve been doing this for a long time now providing traders with in-depth free analysis on Gold, so your likes and comments are very much appreciated.
As always, trade safe.
KOG

Bullish bounce off major support?XAU/USD has bounced off the support level which is an overlap support and could rise from this level to our take profit.
Entry: 3,265.39
Why we like it:
There is an overlap support level.
Stop loss: 3,121.15
Why we like it:
There is a pullback support level that aligns with the 145% Fibonacci extension.
Take profit: 3,344.54
Why we like it:
There is a pullback resistance that lines up with the 50% Fibonacci retracement.
Enjoying your TradingView experience? Review us!
Please be advised that the information presented on TradingView is provided to Vantage (‘Vantage Global Limited’, ‘we’) by a third-party provider (‘Everest Fortune Group’). Please be reminded that you are solely responsible for the trading decisions on your account. There is a very high degree of risk involved in trading. Any information and/or content is intended entirely for research, educational and informational purposes only and does not constitute investment or consultation advice or investment strategy. The information is not tailored to the investment needs of any specific person and therefore does not involve a consideration of any of the investment objectives, financial situation or needs of any viewer that may receive it. Kindly also note that past performance is not a reliable indicator of future results. Actual results may differ materially from those anticipated in forward-looking or past performance statements. We assume no liability as to the accuracy or completeness of any of the information and/or content provided herein and the Company cannot be held responsible for any omission, mistake nor for any loss or damage including without limitation to any loss of profit which may arise from reliance on any information supplied by Everest Fortune Group.

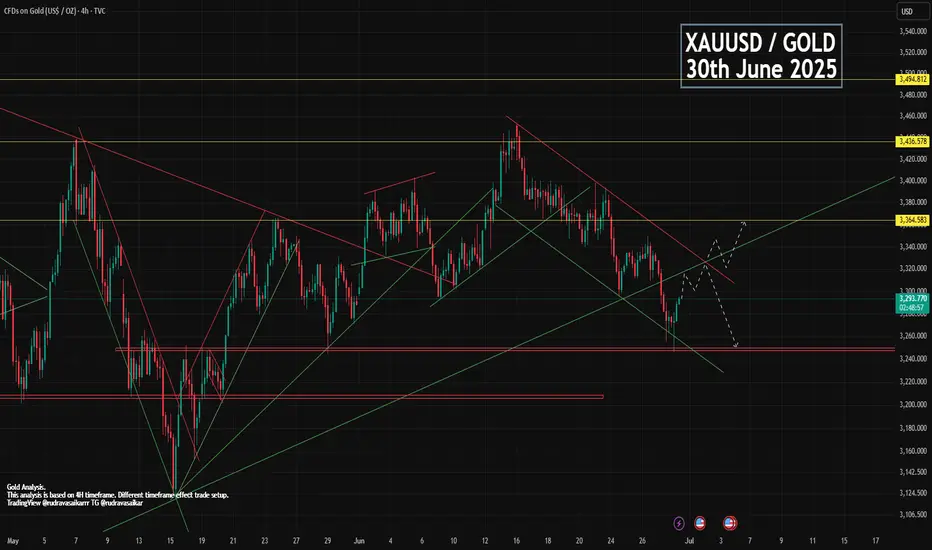
GOLD 30th JUNE - MONTH-END BULLISH OR BEARISHDue to war no update on gold, gold made bolt move downward. Slowly war has been becoming calm but no good news about it has been stopped completely. But you can see some great and correct structure in gold chart where you can find amazing entry and exit points. Gold lower was 1246 since then. Now gold is trading in bullish flag and expecting to breakout. And after breakout we can expect a big move upward.
Key point.
Support - 3248, 3272, 3289
Resistance - 3298, 3313, 3332, 3349
Comment and like for analysis. Love it then follow
Any Query Reach Us or comment down.
Follow for more updates.
Rudra Vasaikar Wishes You A Great And Very Amazing Trading Life. Trade Safe, Trade Right.
RISK WARNING 🔴 🔴 🔴
There is high risk of loss in Trading Forex, Crypto, Indices, CFDs, Features and Stocks. Choose your trade wisely and confidently, please see if such trading is appropriate for you or not. Past performance is not indicative of future results. Highly recommended - Information provided by Rudra Vasaikar/Pro Trading Point are for Educational purpose only. Do your investment according to your own risk. Any type of loss is not our responsibility.
HAPPY TRADING.
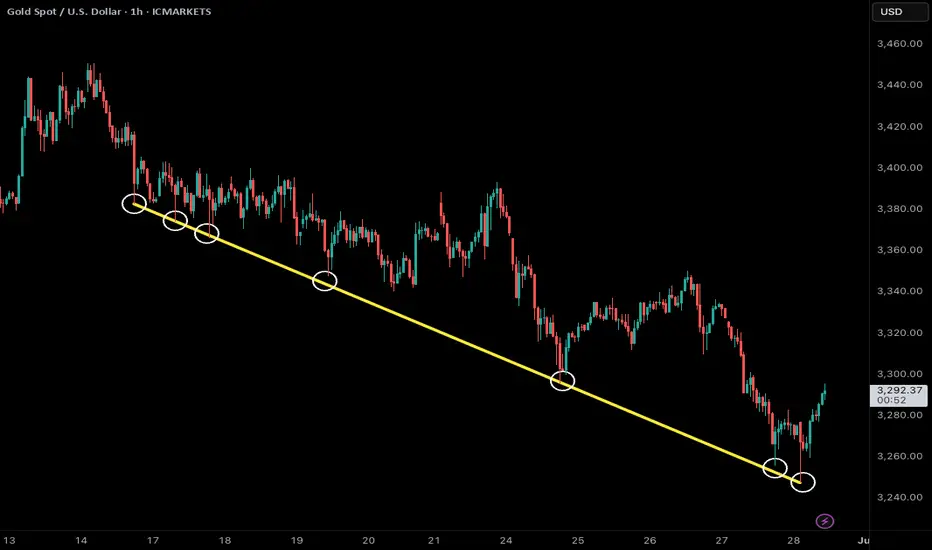
golden trend linegold price peaked on intraday h1 chart on 3450 level despite shocking war news
opposite to crowd consensus price came down last two week until crowd give up buying war news
but price was falling like text book from trend line
test bounce then new lower low
(price now testing h4 support 3245)
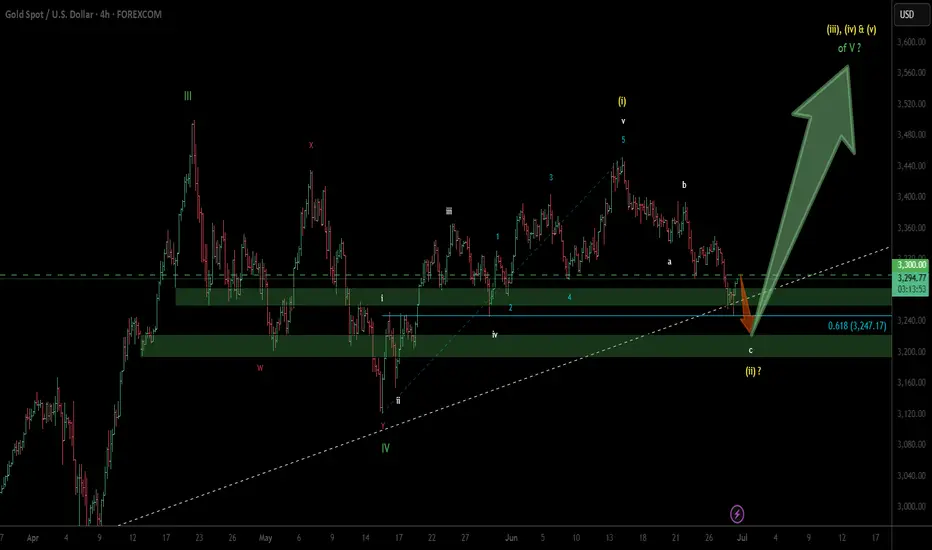
GOLD - next wave up soon...Updated Wave Count... still holding long...
Wave (ii) in yellow is possibly nearing completion.
3200 should limit any move to the downside.
previous wave count...
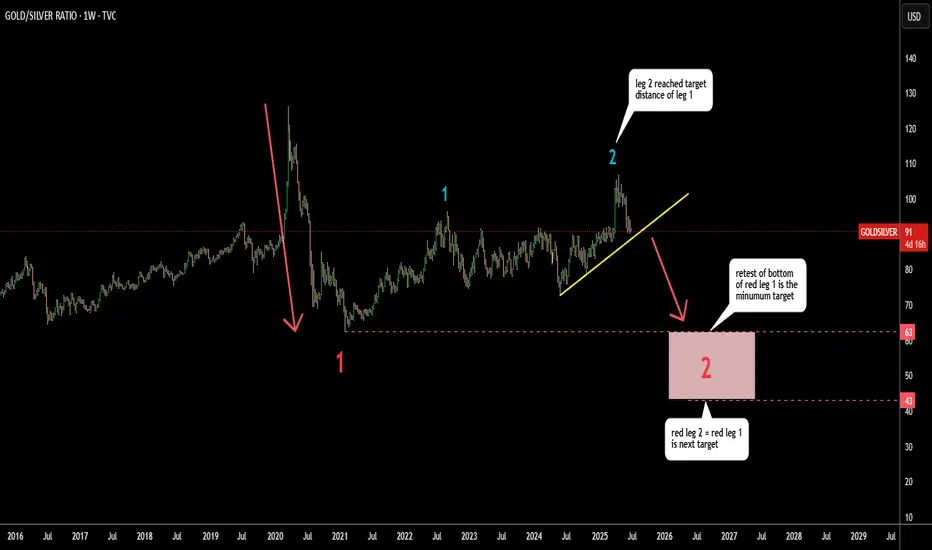
GOLD/SIlver Ratio Signals Risk On Gold/Silver ratio represents the appetite for risk
Stronger gold means risk off and vice versa
In spring, the ratio had hit the target for leg 2 (blue) within
large consolidation that took over 4 years to emerge
It travelled the equal distance of leg 1 (blue) and then reversed.
The next step might be the continuation to the downside for the ratio.
The minimum target is to hit the bottom of red leg 1 at 63.
The next target is located at the distance of the red leg 1 subtracted from the peak of blue leg 2. It was set at 43.
Both downside targets are within historical range.
Gold/Copper ratio shows same dynamics of "Risk-On" attitude on the market.
STEEL-NERVE SETUP – ARE WE RE-LIVING GOLD’S 2020 BEAR-TRAP?Retail sentiment is ultra-bearish, positioning is cooling, Silver is outperforming and the S&P 500 is screaming risk-on … exactly the cocktail we saw in June 2020, right before Gold & Silver exploded higher.
1️⃣ WHY THIS FEELS LIKE 2020 AGAIN
2025 (now) 2020 (pre-rally) Read-through
> 70 % of TradingView ideas are bearish 💬 > 60 % were bearish Crowd may be offsides again
Managed-money net-longs -18 % from April peak 📉 -25 % from March peak Powder for fresh longs
First monthly ETF outflow (-$1.8 bn) 🚪 Record inflows Capitulation, not euphoria
Gold/Silver ratio down to 94 ⚖️ Fell to 95 Silver leadership = bottoming tell
S&P 500 at new ATH 📈 S&P at new ATH Risk-on backdrop identical
2️⃣ WHAT’S DIFFERENT THIS TIME
Real 10-y TIPS yield +0.7 % (2020: -1 %) → smaller monetary tail-wind.
Gold already at inflation-adjusted ATH → upside could be shorter & sharper, not a fresh super-cycle (yet).
3️⃣ CHECKLIST FOR A REAL BEAR-TRAP
Signal Watch-level
Gold holds $3 200–3 250 (100-d SMA + fib) Daily close above zone
Gold/Silver ratio breaks < 90 Momentum confirmation
CFTC net-longs < 150 k Position flush
ETF flows turn positive Fear → FOMO
S&P stumbles / vols spike Classic risk-bid for Gold
Need 3 of 5 boxes ticked to validate the squeeze thesis.
4️⃣ CATALYST CALENDAR
3 Jul – NFP: sub-75 k print could fire the opening salvo.
9 Jul – Tariff freeze decision: escalation would revive safe-haven demand.
15 Jul – CPI & 30-31 Jul – FOMC: dovish turn + soft data could complete the squeeze.
Disclaimer: This post reflects my personal opinion for educational purposes only; it is not financial advice. Trading futures and commodities involves substantial risk and can lead to total loss of capital—do your own research (DYOR) and consult a qualified professional before acting.

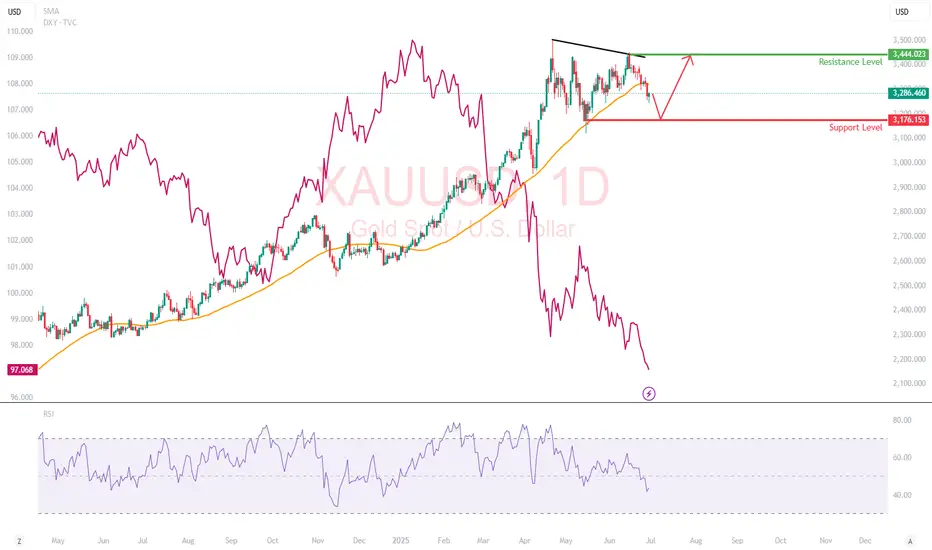
Gold in a Shifting Macro Landscape Fundamentals First: Why is Gold Falling While DXY is Too?
Normally, gold and the U.S. dollar share an inverse relationship (which means, when DXY weakens, gold rises). But recently, this correlation has broken down, and that divergence is a loud macro signal.
What’s Happening:
Trade Deal Optimism:
Headlines suggest the U.S. is nearing a resolution with China and other partners. With reduced geopolitical tension, investors are reallocating from safe-haven assets like gold into risk-on trades like equities and crypto.
Iran-Israel Ceasefire:
The temporary cooling of conflict has revived risk appetite. Traders are rotating out of war hedges (like gold and oil) and into tech, growth, and EM plays.
Real Yields Still Elevated:
Despite a softening Fed narrative, U.S. real yields remain positive, keeping pressure on non-yielding assets like gold. The fact that gold couldn't rally even as the 10-year note softened post-Moody's downgrade could be telling.
My Perspective:
This is the first clear signal in months that geopolitical hedging may have peaked. When gold decouples from its safe-haven narrative despite macro uncertainty, that often precedes a structural rotation phase, especially if institutional flows favor equities.
Technical Breakdown
Gold has broken below its 50-day SMA at $3,322 and is trading in the lower third of its 3-month range. While the daily candles show increasing selling pressure, especially on lower highs (a sign of weakening bullish momentum)
RSI : Falling toward 40, with no bullish divergence yet.
Support Level : $3,176: Previous swing low
Resistance Level : $3,444: previous swing high
What This Move Might Be Telling Us
When gold sells off on dollar weakness and geopolitical calm, the market isn’t just relaxing. It is rotating. The de-grossing of gold-heavy hedges: Some hedge funds may be taking profit on gold-heavy exposure from Q1’s rally.
Rise of risk appetite despite cracks: Markets are forward-pricing trade peace and earnings resilience, possibly too early. Gold might not be in trouble, but it’s on the bench. Unless something reignites fear (e.g., Fed policy mistake, Middle East flashpoint, or economic shock), capital may stay elsewhere.
GOLD MARKET ANALYSIS AND COMMENTARY - [Jun 30 - Jul 04]Last week, OANDA:XAUUSD fell sharply from an opening price of $3,392/oz to a low of $3,255/oz and closed at $3,274/oz. The reason was that Israel and Iran had officially ceased fire, although negotiations with the US remained difficult. In addition, FED Chairman Jerome Powell reaffirmed that there was no rush to cut interest rates due to high inflation risks. In addition, summer is a period of weak demand for physical gold, continuing to put pressure on gold prices.
In addition, summer is typically the low season for physical gold demand, which could continue to weigh on gold prices.
In addition to the seasonal lull in trading that has affected the gold market, improving economic sentiment as the Trump administration has said there is progress in trade agreements, especially the framework agreement on trade with China, will also continue to negatively impact gold prices next week.
Thus, gold prices next week may continue to be under downward pressure, but the decline may not be too large as gold prices next week are still supported by some fundamental factors.
This week, the US will release the non-farm payrolls (NFP) report and the unemployment rate for June. According to forecasts, NFP may reach 120,000 jobs. If NFP increases higher than expected, the FED will continue to delay cutting interest rates, negatively affecting gold prices next week. On the contrary, if NFP drops sharply below 100,000 jobs, it will increase the possibility of the FED cutting interest rates, helping gold prices rise again next week, but not too strongly.
📌Technically, the gold price closed below $3,300/oz this week, which could pave the way for a drop to $3,200/oz next week, or below that to $3,120/oz. If the gold price rebounds above $3,300/oz next week, it could trigger a recovery to $3,330-$3,360/oz.
Notable technical levels are listed below.
Support: 3,246 – 3,228USD
Resistance: 3,292 – 3,300USD
SELL XAUUSD PRICE 3367 - 3365⚡️
↠↠ Stop Loss 3371
BUY XAUUSD PRICE 3178 - 3180⚡️
↠↠ Stop Loss 3174

30/06 WILL WE SEE A RECOVERY ON THE LAST DAY OF THE MONTH? ↗️GOLD PLAN – 30/06: WILL WE SEE A RECOVERY ON THE LAST DAY OF THE MONTH? ☄️
✅ Macro Context – Focus on USD Debt and Political Pressure
Today marks the final trading day of June, and the U.S. faces a $6 trillion debt maturity from Covid-era borrowings, which may impact USD liquidity and market sentiment.
During the Asian session, gold experienced a sharp drop to the 32xx area before bouncing back and is now hovering near last week's close.
While the medium-term structure remains bearish, short-term signals suggest a potential reversal and recovery.
✅Political Catalyst:
→ Trump is pressuring the Federal Reserve to cut interest rates to 1%-2%, stating he won’t appoint anyone unwilling to ease policy.
→ This raises expectations of future rate cuts, which could support gold prices in the near term.
✅ Technical Outlook – Multi-timeframe Structure
On the higher timeframes, gold continues to correct lower.
However, short-term candles are showing recovery momentum, with buyers absorbing around the 327x zone.
Today’s strategy: prioritize short-term BUY setups aligned with the recovery wave.
✔️Key Resistance & Support Levels
🔺Resistance: 3283 – 3291 – 3301 – 3322
🔻Support: 3277 – 3271 – 3259 – 3247
🔖Trade Scenarios
✅Buy Scalping
🔺Entry: 3272 – 3274
🔹SL: 3268
✔️TP: 3282 – 3288 – 3298
✅Buy Zone
🔺Entry: 3249 – 3251
🔹SL: 3244
✔️TP: 3265 – 3282 – 3295 – 3310
💠Sell Scalping
🔺Entry: 3298 – 3300
🔹SL: 3304
✔️TP: 3292 – 3282 – 3270
💠Sell Zone
🔺Entry: 3327 – 3329
🔹SL: 3333
✔️TP: 3322 – 3310 – 3298 – 3282
⚡️ Final Note
As this is the month-end session, expect possible volatility driven by USD flows and institutional rebalancing.

XAUUSD H4 | Bearish Reversal Based on the H4 chart, the price is raising toward our sell entry level at 3295-3300, a pullback resistance.
Our take profit is set at 3243.38, an overlap support.
The stop loss is set at 3340.95, an overlap resistance.
High Risk Investment Warning
Trading Forex/CFDs on margin carries a high level of risk and may not be suitable for all investors. Leverage can work against you.
Stratos Markets Limited (tradu.com ):
CFDs are complex instruments and come with a high risk of losing money rapidly due to leverage. 63% of retail investor accounts lose money when trading CFDs with this provider. You should consider whether you understand how CFDs work and whether you can afford to take the high risk of losing your money.
Stratos Europe Ltd (tradu.com ):
CFDs are complex instruments and come with a high risk of losing money rapidly due to leverage. 63% of retail investor accounts lose money when trading CFDs with this provider. You should consider whether you understand how CFDs work and whether you can afford to take the high risk of losing your money.
Stratos Global LLC (tradu.com ):
Losses can exceed deposits.
Please be advised that the information presented on TradingView is provided to Tradu (‘Company’, ‘we’) by a third-party provider (‘TFA Global Pte Ltd’). Please be reminded that you are solely responsible for the trading decisions on your account. There is a very high degree of risk involved in trading. Any information and/or content is intended entirely for research, educational and informational purposes only and does not constitute investment or consultation advice or investment strategy. The information is not tailored to the investment needs of any specific person and therefore does not involve a consideration of any of the investment objectives, financial situation or needs of any viewer that may receive it. Kindly also note that past performance is not a reliable indicator of future results. Actual results may differ materially from those anticipated in forward-looking or past performance statements. We assume no liability as to the accuracy or completeness of any of the information and/or content provided herein and the Company cannot be held responsible for any omission, mistake nor for any loss or damage including without limitation to any loss of profit which may arise from reliance on any information supplied by TFA Global Pte Ltd.
The speaker(s) is neither an employee, agent nor representative of Tradu and is therefore acting independently. The opinions given are their own, constitute general market commentary, and do not constitute the opinion or advice of Tradu or any form of personal or investment advice. Tradu neither endorses nor guarantees offerings of third-party speakers, nor is Tradu responsible for the content, veracity or opinions of third-party speakers, presenters or participants.

$XAUTUSDt 300625 TRADE SETUPWaiting for Price to show its hand, then I'll take a Trade.
Overall 🔺BULLISH; anticipating the PWL to be souped where I will start hunting Entries to LONG.
For Entertainment. Not a Financial/Investment Advice.
What's your view❓

XAUUSD 4hour TF - June 29th, 2025XAUUSD 4hour Neutral Idea
Monthly - Bullish
Weekly - Bullish
Daily - Bullish
4hour - Bearish
Gold has been on the rally of a century for a while and isn’t showing too many signs of slowing down long term. For now we do have a couple opportunities I can bring to your attention.
4hour bearish continuation - For this to happen we would like to see price action come back to our pocket of confluence near the 3,320.000 level followed by bearish conviction. If this happens look to target lower toward major support levels like 3,225.500.
4hour trend reversal - If we are to see a reversal of the 4hour trend we would need to see price action pop back above the 3,320.000 resistance area. Look for strong bullish conviction above this level and target higher toward appropriate levels of resistance.

Will Gold Break out for the New Month this week?I was anticipating these possible sweeps. with it being the end of the month I'm thinking I might need to do more watching for now than positioning. waiting for the market to show its hand on what it wants to do next.
