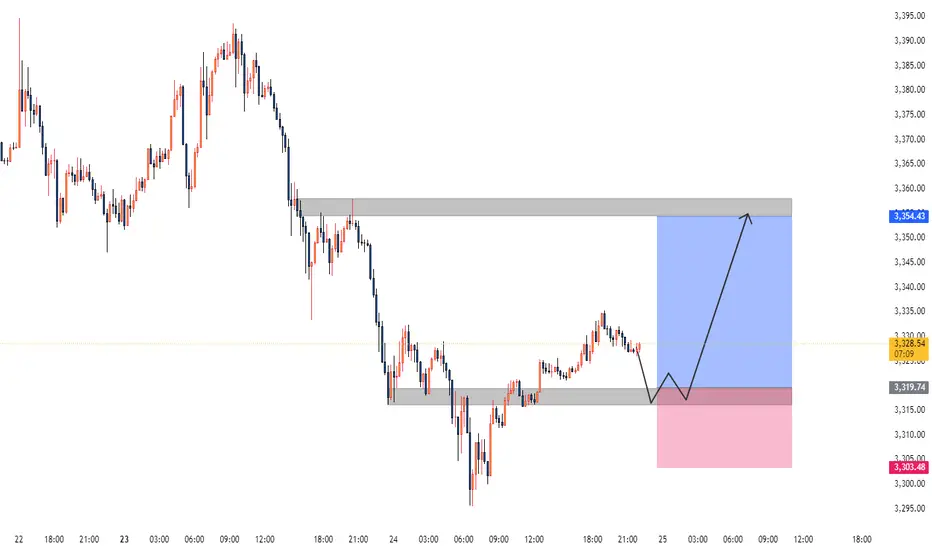
Gold XAUUSD Analysis 25.06.2025The Gold shows with a recent upward trend following a period of consolidation and a dip. Key observations:
The price previously fluctuated between a support level around 3,310-3,319 and a resistance near 3,354.
The current price is consolidating near the recent high, suggesting potential for further upward movement or a pullback.
Signal:
Buy signal is present in the range of 3,316-3,319, aligning with the support level, offering a good entry point for a potential upward move.
Gold
Hanzo Drex | 30-Min Break Out Setup – 200 Pips in Sight🔥 Gold – 15 Min Scalping Analysis
⚡️ Objective: Precision Break out Execution
Time Frame: 15 -Minute Warfare
Entry Mode: Only after verified Break out
👌Bullish Break : 3333.5
Price must break liquidity with high volume to confirm the move.
☄️ Hanzo Protocol: Dual- Entry Intel
Zone Activated: Deep Analysis
➕ 4 wicks connected at 3333
➕ 7 wicks connected at 3329.5
➕ Body Close at 3328
➕ Body Close at 3334
➕ Liquidity at 3344

GOLD ROUTE MAP UPDATEHey Everyone,
Another smashing day on the charts with our levels being respected perfectly inline with our plans to buy dips.
After completing our bearish 3348 and bullish 3376 target we had the cross and lock above 3376 leaving a gap to 3395, which fell short just by few pips.
We then had the cross and lock below 3348 opening the swing range, which was also hit perfectly. We got the perfect bounce, just like we analysed allowing us to buy dips and now seeing the swing range carry out the move. We will see if this is completed for the full swing range 3348.
We will keep the above in mind when taking buys from dips. Our updated levels and weighted levels will allow us to track the movement down and then catch bounces up.
We will continue to buy dips using our support levels taking 20 to 40 pips. As stated before each of our level structures give 20 to 40 pip bounces, which is enough for a nice entry and exit. If you back test the levels we shared every week for the past 24 months, you can see how effectively they were used to trade with or against short/mid term swings and trends.
The swing range give bigger bounces then our weighted levels that's the difference between weighted levels and swing ranges.
BULLISH TARGET
3376 - DONE
EMA5 CROSS AND LOCK ABOVE 3376 WILL OPEN THE FOLLOWING BULLISH TARGETS
3395
EMA5 CROSS AND LOCK ABOVE 3395 WILL OPEN THE FOLLOWING BULLISH TARGET
3419
EMA5 CROSS AND LOCK ABOVE 3419 WILL OPEN THE FOLLOWING BULLISH TARGET
3440
BEARISH TARGETS
3348 - DONE
EMA5 CROSS AND LOCK BELOW 3348 WILL OPEN THE SWING RANGE
3330 - DONE
3306 - DONE
EMA5 CROSS AND LOCK BELOW 3306 WILL OPEN THE SECONDARY SWING RANGE
3288
3271
As always, we will keep you all updated with regular updates throughout the week and how we manage the active ideas and setups. Thank you all for your likes, comments and follows, we really appreciate it!
Mr Gold
GoldViewFX

Silver Long Setup–Breakout Retest After Clearing Key ResistanceSilver TVC:SILVER has broken above the $34.50 resistance level, as it looks to catch up to the gold/silver ratio. We’re now watching for a retest of this breakout zone at $34.00–$34.50 for a potential long spot entry.
📌 Trade Setup:
• Entry Zone: $34.00 – $34.50
• Take Profit Targets:
o 🥇 $37.50 – $40.00
o 🥈 $44.00 – $48.00
• Stop Loss: Daily close below $33.00

Suppression remains unchanged, the latest layout of gold📰 Impact of news:
1. Powell's testimony
2. Geopolitical impact
📈 Market analysis:
The short-term rebound of gold is the release of energy for the accumulated bulls. From the current market trend, 3340 above is the key point of the short-term watershed between bulls and bears. The short-term resistance above is around 3342-3348, and the short-term support below is around 33220-3315. If it falls below this, it will continue to look towards yesterday's low of 3290-3280. The daily level is under pressure and continues to see a decline and adjustment. If it touches 3340-3350 above, you can try to short. After it retreats to 3320-3315 and obtains effective support, you can consider going long.
🏅 Trading strategies:
SELL 3340-3350
TP 3330-3320-3315
BUY 3320-3315
TP 3330-3340-3350
If you agree with this view, or have a better idea, please leave a message in the comment area. I look forward to hearing different voices.
OANDA:XAUUSD FX:XAUUSD FOREXCOM:XAUUSD FXOPEN:XAUUSD TVC:GOLD

Bulls have made profits, gold layout in the evening📰 Impact of news:
1. Powell's testimony
2. Geopolitical impact
📈 Market analysis:
I have completed the long trade according to the previous trading strategy, and the long order has generated profit. In the short term, the overall trend of gold is still bearish. Only if it breaks through and stabilizes above 3350 can the bulls continue. If it rebounds to the 3330-3335 line and encounters resistance under pressure, you can consider shorting. If it rebounds to 3340-3350 but fails to stabilize, you can increase your short position. Pay attention to the support of 3320-3300 below. If it falls below 3300, it is expected to reach 3280
🏅 Trading strategies:
SELL 3330-3335-3340-3350
TP 3320-3310-3300-3280
If you agree with this view, or have a better idea, please leave a message in the comment area. I look forward to hearing different voices.
OANDA:XAUUSD FX:XAUUSD FOREXCOM:XAUUSD FXOPEN:XAUUSD TVC:GOLD

GOLD - SHORT TO $2,800 (VIDEO ANALYSIS)Confluences👇
⭕️Wave 3 Peaked at Psychological Number of $2,500 (LQ Point).
⭕️Minor Wave 1 & 2 of Major Wave 4 Complete. But Wave 3 Pending.
⭕️Thin Liquidity In The Markets.
⭕️Gold Overbought/DXY Oversold.
✅HUGE 4,700 PIPS (14% ROI) POTENTIAL PROFIT✅

GOLD: Local Bullish Bias! Long!
My dear friends,
Today we will analyse GOLD together☺️
The recent price action suggests a shift in mid-term momentum. A break above the current local range around 3,314.13 will confirm the new direction upwards with the target being the next key level of 3,322.84 and a reconvened placement of a stop-loss beyond the range.
❤️Sending you lots of Love and Hugs❤️

GOLD My Opinion! BUY!
My dear followers,
I analysed this chart on GOLD and concluded the following:
The market is trading on 3313.7 pivot level.
Bias - Bullish
Technical Indicators: Both Super Trend & Pivot HL indicate a highly probable Bullish continuation.
Target - 3321.8
Safe Stop Loss - 3309.7
About Used Indicators:
A super-trend indicator is plotted on either above or below the closing price to signal a buy or sell. The indicator changes color, based on whether or not you should be buying. If the super-trend indicator moves below the closing price, the indicator turns green, and it signals an entry point or points to buy.
Disclosure: I am part of Trade Nation's Influencer program and receive a monthly fee for using their TradingView charts in my analysis.
———————————
WISH YOU ALL LUCK

XAUUSD: Market Analysis and Strategy for June 25Gold technical analysis
Daily chart resistance 3400, support 3286
4-hour chart resistance 3354, support 3300
1-hour chart resistance 3343, support 3316
In the hourly chart, the rebound secondary high of $3357 has become an important resistance for the short-selling defense line. If the gold price fails to effectively break through this point, the short-selling trend will be difficult to reverse.
Personally, I expect that although gold prices will be under pressure due to weakened safe-haven demand in the short term, the uncertainty of the situation in the Middle East may limit its further decline. If the ceasefire agreement unexpectedly breaks down, safe-haven buying may quickly return, pushing gold prices to rebound. In addition, the market's adjustment of the Fed's expectations for rate cuts will continue to affect the trend of gold prices. If the expectation of a rate cut in September is further consolidated, gold prices may stabilize at a low level and try to move up.
The key support position below in the short term is 3316, followed by 3300. The important pressure position is around 3340!
Sell: 3340near
Buy: 3300near

SPY/QQQ Plan Your Trade for 6-25 : Breakaway PatternToday's Breakaway pattern suggests the SPY/QQQ may attempt to move into another breakaway price move - very similar to yesterday's price move.
I will add that I believe the SPY cycle patterns have already moved through a breakaway phase with the ceasefire news early this week. I believe the gap and breakaway move yesterday may be the breakaway trend we are expecting today.
That would suggest the markets could pause and pullback a bit over the next few days.
Gold and Silver are trying to find a bottom after the brief selling that took place over the past few days. I really do believe Gold and Silver are poised to make a big move higher.
Bitcoin is on a terror to the upside. But be cautious of the downward cycle channel that may prompt a rollover in BTCUSD near the $107,500 level.
I spend a little time near the end of this video highlighting my work on the Tesla 3-6-9 price theory and going over a few examples for my new book on trading.
Enjoy the quick look at some of the more advanced techniques I'm working to unlock for all of you.
Get some.
#trading #research #investing #tradingalgos #tradingsignals #cycles #fibonacci #elliotwave #modelingsystems #stocks #bitcoin #btcusd #cryptos #spy #gold #nq #investing #trading #spytrading #spymarket #tradingmarket #stockmarket #silver

GOLDCurrently on a buy trade on Gold but we also have 2 supply levels above as our POI where we could be watching closely for sell opportunities. Personally, i prefer the extreme POI because it has FVG right below it which i expect to be filled up so my bias on GOLD is buy to sell.

Powell's Softer Tone Hints at Gold's LiftoffXAUUSD: Powell's Softer Tone Hints at Gold's Liftoff – Ready for a July Rally?
Hey everyone!
Let's dive into XAUUSD today! We've got some sweet news from Fed Chair Jerome Powell that could be a game-changer for Gold.
🌍 Macro Edge: Gold Breathes Easier as Rate Pressures May Ease!
Gold's recent climb is largely thanks to Powell's "soft-spoken" remarks. He's openly admitted that tariff-driven inflation is lower than expected, even subtly hinting at earlier rate cuts – perhaps as soon as July!
Despite his "no need to rush" stance, the market's getting a clear message: if inflation keeps cooling down, the Fed will have room to loosen policy sooner. This is music to Gold's ears! Lower rates mean a reduced opportunity cost for holding Gold (which doesn't yield), making it far more attractive to investors.
🌐 Capital Flows: Gold vs. USD – Who's the Next Safe-Haven King?
Market liquidity always dances to the tune of interest rates and risks. Gold and the USD typically share the safe-haven crown during volatile times.
However, if Powell's "dovish tilt" holds, and the Fed cuts rates soon, prepare for a significant capital shift:
USD might cool off: Lower US yields reduce the USD's appeal.
Gold takes the spotlight: With lower holding costs and persistent global geopolitical uncertainties, Gold could see a surge in demand.
The market's re-pricing of Fed policy is already bolstering Gold, signaling a potential upside move on the horizon!
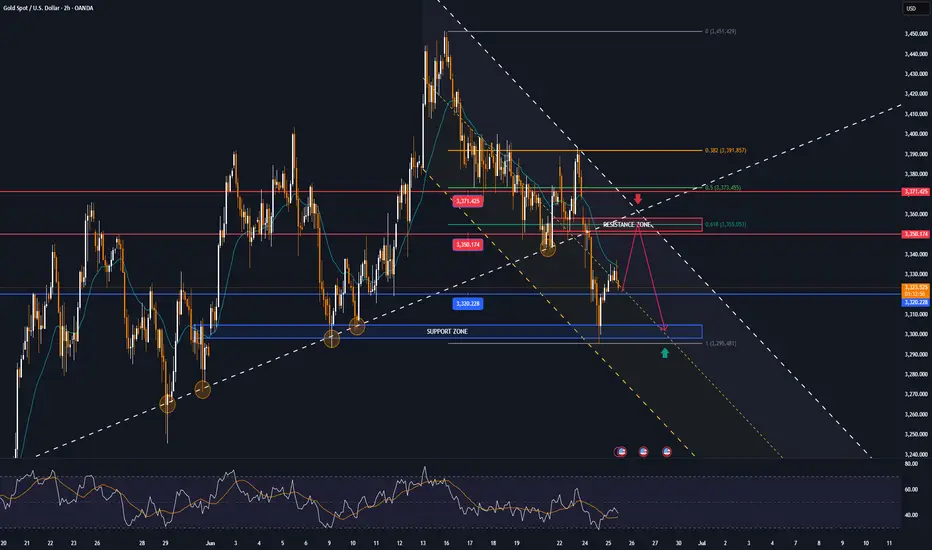
📊 Technical Insight (H4/M30 Chart): Gold Breaking Free, Targeting Higher Peaks!
Looking at our XAUUSD chart (H4/M30, based on your image):
Channel Breakout: Gold has clearly broken out of its prior descending channel! This is a positive sign, indicating weakening selling pressure and a potential trend reversal. Price is consolidating, possibly forming a new accumulation pattern or a minor ascending channel.
Key Levels to Watch:
Potential SELL Zone (Resistance): Around 3352.383 - 3371.205. This is a major historical resistance cluster where Gold has previously met strong selling pressure. Watch for rejection here.
Higher Resistance: 3391.750 - 3395.000. A decisive break above this level would signal a more robust long-term bullish trend.
Current BUY Zone (Support): Around 3302.939 - 3311.214. This is a critical demand zone where strong buying interest is likely to emerge, aligning with recent lows.
Next Key Support: 3286.257. This is the next line of defense if the current BUY zone breaks.
🎯 Trade Plan & Key Zones:
BUY ZONE: 3286 - 3284
SL: 3280
TP: 3290 - 3294 - 3298 - 3302 - 3306 - 3310 - 3315 - 3320
BUY SCALP: 3302 - 3300
SL: 3295
TP: 3306 - 3310 - 3314 - 3318 - 3322 - 3326 - 3330
SELL ZONE: 3353 - 3355
SL: 3360
TP: 3350 - 3346 - 3340 - 3335 - 3330 - 3320
SELL ZONE: 3372 - 3374
SL: 3378
TP: 3370 - 3366 - 3362 - 3358 - 3354 - 3350
⚠️ What Else to Watch For:
More Fed Official Speeches: Any new comments on inflation or policy will keep the market buzzing.
Geopolitical Developments: Ongoing global tensions can always boost Gold's safe-haven appeal.
Let's trade smart and stay sharp! Wishing everyone a successful trading day!

GOLD recovers from 2-week low, short-term neutral biasOANDA:XAUUSD hit a two-week low in yesterday's trading session before recovering, currently trading around $3,330/oz, up slightly by about 0.14% on the day.
The main reason was the ceasefire between Iran and Israel, which curbed demand for safe-haven gold. In addition, Federal Reserve Chairman Powell made hawkish comments, which also affected the gold price trend.
Israel and Iran reach ceasefire agreement
A ceasefire came into effect on Tuesday under pressure from US President Donald Trump, raising optimism that the biggest military conflict between the two arch-rivals in the Middle East may be coming to an end.
The easing of tensions in the Middle East has been a major factor in the pressure on gold. Risk sentiment has weakened and the market has entered risk-on mode.
US President Trump announced on Monday evening that Israel and Iran had reached an agreement on a “complete and total ceasefire”. Iran’s state TV officially announced on Tuesday that Iran had ceased fire with Israel.
Israeli Defense Minister Israel Katz announced earlier Tuesday that the Israeli military would launch a new wave of strikes on targets in Tehran in retaliation for Iran's missile launch and "blatant violation" of the ceasefire.
The Israeli government said that Israel would hold off on further strikes on Iran after Prime Minister Benjamin Netanyahu spoke with US President Trump.
Powell sends important signal
Federal Reserve Chairman Powell will testify before the House Financial Services Committee on Tuesday and deliver a report on the Fed’s monetary policy. Powell will also testify before the Senate Banking Committee today (Wednesday).
In congressional testimony on Tuesday, Powell said the Fed needs more time to see whether tariffs are causing inflation to rise further before considering cutting interest rates.
In congressional testimony, Powell said he and most Fed officials expect inflation to rise soon and that the Fed is in no rush to cut rates before then.
“We are now in a very good position to wait and see what the likely path of the economy is before considering whether to adjust the policy stance,” Powell said.
Markets generally believe that the July 29-30 meeting is unlikely to result in a rate cut, with the first rate cut expected in September.
Technical Outlook Analysis OANDA:XAUUSD
With the current technical position, gold has not yet had a complete short-term trend as the price action is still around the EMA21 moving average, and the RSI is operating around the 50 level.
With the current price action showing that the market is still hesitant, gold may enter a sideways accumulation phase.
However, in terms of the long-term trend, gold is still in a long-term uptrend channel with the case for a complete downtrend to occur is the condition that the price action is taken below the raw price point of 3,300 USD. Then the downside target is the 0.50% Fibonacci retracement level in the short term.
During the day, the trend of gold is neutral with the expected operating range between 3,350 – 3,300 USD.
Notable positions will also be listed as follows.
Support: 3,320 – 3,300 USD
Resistance: 3,350 – 3,371 USD
SELL XAUUSD PRICE 3349 - 3347⚡️
↠↠ Stop Loss 3353
→Take Profit 1 3341
↨
→Take Profit 2 3335
BUY XAUUSD PRICE 3301 - 3303⚡️
↠↠ Stop Loss 3297
→Take Profit 1 3309
↨
→Take Profit 2 3315
$XAUSD - Further sideways price action...The OANDA:XAUUSD price action seems to have morphed into a fourth-wave triangle. If true, we anticipate further sideways price action for the rest of the summer.

Hanzo Drex | 15-Min Break Out Setup – 200 Pips in Sight🔥 Gold – 15 Min Scalping Analysis
⚡️ Objective: Precision Reversal Execution
Time Frame: 15 -Minute Warfare
Entry Mode: Only after verified Reversals
👌Bullish Break : 3333.5
Price must break liquidity with high volume to confirm the move.
👌Bearish Break : 3324
Price must break liquidity with high volume to confirm the move.
☄️ Hanzo Protocol: Dual-Direction Entry Intel
➕ Zone Activated: Strategic liquidity layer detected — mapped through refined supply/demand mechanics. Volatility now rising. This isn’t noise — this is bait for the untrained. We're not them.
🦸♂️ Tactical Note:
The kill shot only comes after the trap is exposed and volume betrays their position.

Gold Slips as Ceasefire Eases SafeHaven Demand Bearish Below3339Gold Drops on Israel-Iran Ceasefire
Gold prices declined as safe-haven demand eased following President Trump’s announcement of a ceasefire between Israel and Iran. Despite the pullback, gold remains up nearly 23% year-to-date, supported by ongoing geopolitical tensions, economic uncertainty driven by Trump’s tariffs, and robust central bank purchases.
Market Focus:
All eyes are now on U.S. Federal Reserve Chair Jerome Powell’s testimony, which may offer fresh insights into potential near-term interest rate cuts.
Technical Outlook:
Gold remains under bearish pressure as long as it trades below the 3329–3339 pivot zone.
A confirmed 4H candle close below 3329, or especially 3309, would further validate downside momentum toward the support range.
Support Levels: 3302, 3281, 3256
Resistance Levels: 3364, 3393
A clear break below 3302–3281 would open the path toward deeper bearish continuation.

Gold May Dip Short-Term Amid Cautious Fed & Geopolitical Calm📊 Market Overview:
• Gold saw a slight correction as Middle East tensions eased following a ceasefire agreement between Iran and Israel.
• A weaker USD and lower U.S. Treasury yields offered some support to gold prices.
• However, the Fed’s cautious stance on rate cuts and upcoming testimony from Chair Powell continue to weigh on gold sentiment.
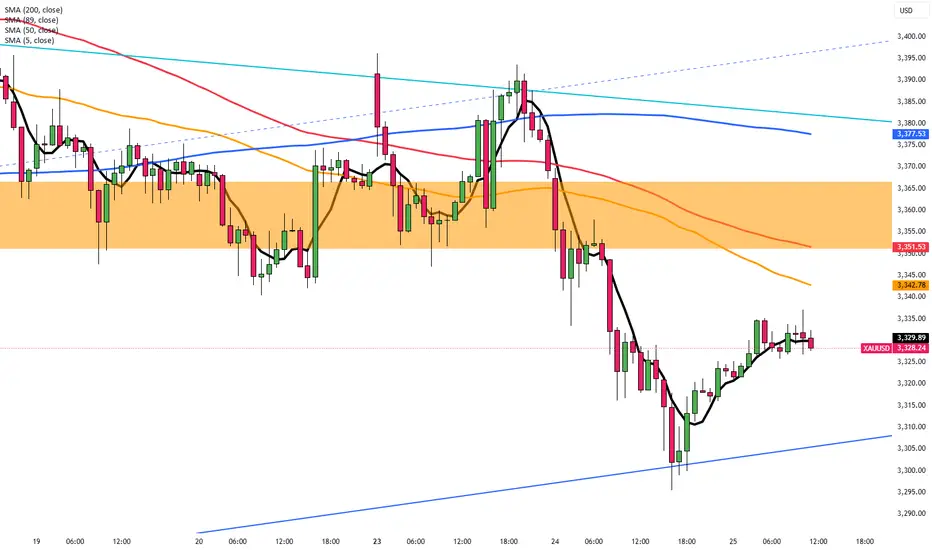
📉 Technical Analysis:
• Key Resistance Levels:
– $3,350–3,360 (21/50-day SMAs)
– $3,370–3,385 (Fibonacci zone and swing highs)
• Nearest Support Levels:
– $3,316–3,320 (intraday lows and psychological level)
– $3,300–3,305 (strong support), followed by $3,245–3,275 if broken
• EMA 09: Price is currently trading below the 09 EMA, indicating a short-term downtrend.
• Candlestick Pattern / Volume / Momentum:
– The 15-minute chart shows slight recovery signals, but with weak momentum; RSI is below average and MACD is slightly bearish.
– No strong reversal candlestick pattern detected; small-bodied candles (doji) suggest indecision and selling pressure remains near $3,340.
📌 Outlook:
Gold may decline slightly in the short term, potentially retesting the $3,316–3,320 support zone. A rebound is possible if the USD weakens further or the Fed unexpectedly signals rate cuts.
💡 Suggested Trading Plan:
🔻 SELL XAU/USD at: $3,335–3,340
🎯 TP: $3,330 - $3,325
❌ SL: $3,345
🔺 BUY XAU/USD at: $3,318 – 3,315
🎯 TP: $3,320 - $3,325
❌ SL: $3,312

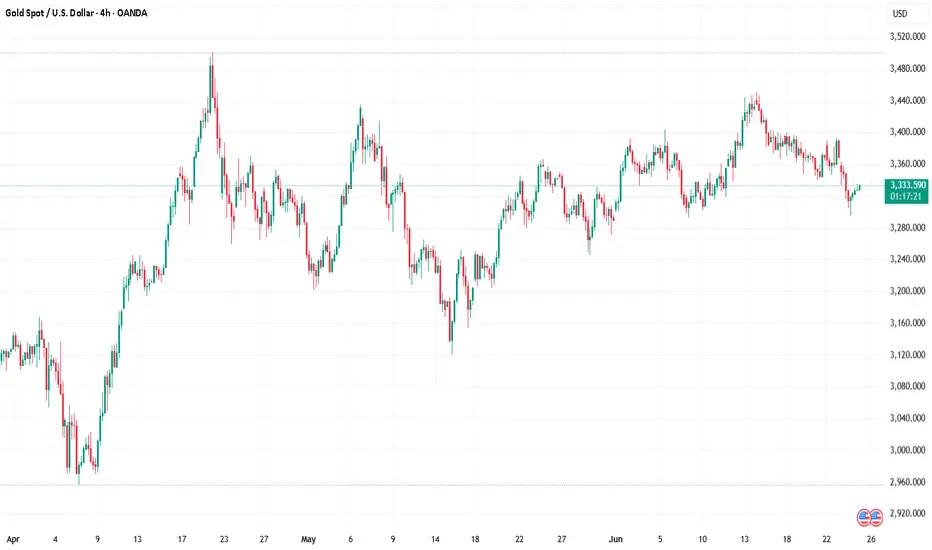
Gold H4 | Pullback resistance at 50% Fibonacci retracementGold (XAU/USD) is rising towards a pullback resistance and could potentially reverse off this level to drop lower.
Sell entry is at 3,344.72 which is a pullback resistance that aligns with the 50% Fibonacci retracement.
Stop loss is at 3,400.00 which is a level that sits above the 61.8% Fibonacci retracement and a swing-high resistance.
Take profit is at 3,276.41 which is a swing-low support.
High Risk Investment Warning
Trading Forex/CFDs on margin carries a high level of risk and may not be suitable for all investors. Leverage can work against you.
Stratos Markets Limited (tradu.com ):
CFDs are complex instruments and come with a high risk of losing money rapidly due to leverage. 63% of retail investor accounts lose money when trading CFDs with this provider. You should consider whether you understand how CFDs work and whether you can afford to take the high risk of losing your money.
Stratos Europe Ltd (tradu.com ):
CFDs are complex instruments and come with a high risk of losing money rapidly due to leverage. 63% of retail investor accounts lose money when trading CFDs with this provider. You should consider whether you understand how CFDs work and whether you can afford to take the high risk of losing your money.
Stratos Global LLC (tradu.com ):
Losses can exceed deposits.
Please be advised that the information presented on TradingView is provided to Tradu (‘Company’, ‘we’) by a third-party provider (‘TFA Global Pte Ltd’). Please be reminded that you are solely responsible for the trading decisions on your account. There is a very high degree of risk involved in trading. Any information and/or content is intended entirely for research, educational and informational purposes only and does not constitute investment or consultation advice or investment strategy. The information is not tailored to the investment needs of any specific person and therefore does not involve a consideration of any of the investment objectives, financial situation or needs of any viewer that may receive it. Kindly also note that past performance is not a reliable indicator of future results. Actual results may differ materially from those anticipated in forward-looking or past performance statements. We assume no liability as to the accuracy or completeness of any of the information and/or content provided herein and the Company cannot be held responsible for any omission, mistake nor for any loss or damage including without limitation to any loss of profit which may arise from reliance on any information supplied by TFA Global Pte Ltd.
The speaker(s) is neither an employee, agent nor representative of Tradu and is therefore acting independently. The opinions given are their own, constitute general market commentary, and do not constitute the opinion or advice of Tradu or any form of personal or investment advice. Tradu neither endorses nor guarantees offerings of third-party speakers, nor is Tradu responsible for the content, veracity or opinions of third-party speakers, presenters or participants.

Gold Rebounds on Ceasefire FragilityGold edged back up to around $3,330, recovering from a two-week low. While the Israel-Iran ceasefire brought temporary calm, a US intelligence report showed that Iran’s nuclear progress was only briefly disrupted, raising concerns about renewed tensions.
Fed Chair Powell adopted a cautious stance, saying rates would likely stay unchanged for now, though a July cut remains possible. Diverging views among Fed members on inflation and job data may limit gold’s upside in the near term.
Resistance is seen at $3,355, while support holds at $3,285.
4‑Hour Analysis – Supply & Demand Overview 25 June 20251. Market Structure
XAU/USD currently trades at 3333 and shows clear higher highs and higher lows on the 4‑hour timeframe—reflecting a bullish structure backed by recent swing lows above 3300 and highs nearing 3365
2. Key Demand Zones
DZ1: 3320–3330 – Consolidation region with multiple wicks and price rejections; confirmed buying volume (aligned with ML and 50‑EMA confluence)
DZ2: 3300–3310 – A deeper base with strong reversal history; aligns with psychological round number and 0.382 Fib of recent up-swing
3. Key Supply Zones
SZ1: 3350–3360 – Upper resistance cluster formed by repeated spikes and quick rejections; overlapping 0.5–0.618 Fib from the last retracement
SZ2: 3380–3400 – Broader distribution area with past failed breakouts; significant liquidity shelf noted
4. Why These Zones Matter
Demand zones act as value entry areas where institutional and retail buyers absorb selling pressure, usually followed by swift reversals.
Supply zones represent distribution pockets where buy orders face strong pushback, often leading to corrective moves.
5. Bias
✅ Overall Bias – Bullish (4‑hour) thanks to structural trend (HH/HL), price above key previews like 50‑EMA & 20‑EMA, and consistent demand responses. Only a break below 3320 invalidates bullish tilt.
⚡ 1‑Hour Intraday Setups (Aligned with Bullish 4H Bias)
Buy the Dip (Main Entry)
Zone: 3320–3325
Context: Retest of DZ1, tagging the 4H structure and 1H ascending trendline.
Confirmation: Bullish pin bar or long tail candle + volume surge.
Channel Retest Quick‑Entry
Zone: 3330–3335
Context: Price remediates after a clean breakout above the 1‑hour descending channel.
Confirmation: Trendline bounce or bullish engulfing on the first test.
Supply‑Fade (Aggressive)
Zone: 3350–3355
Context: Approach to SZ1—plays the bearish reaction in a bull market context.
Confirmation: Bearish pin bar, upper wick exhaustion, and slim 1H RSI divergence.
📈 Chart Snapshot & Confluences
DZ1 (3320–3330) aligns with the 0.382 Fib and ascending 1‑hour trendline.
Quick-entry zone (3330–3335) sits close to the 1‑hour 50‑EMA, offering dynamic multi‑timeframe confluence.
SZ1 aligns with higher-term fib and previous supply peaks.
📝 Ready Summary
XAU/USD – 4H Structure: Bullish – higher highs & higher lows.
Major Demand Zones: 3320–3330 (primary), 3300–3310 (secondary).
Major Supply Zones: 3350–3360 (hot zone), 3380–3400 (upper resistance).
Bias: Bullish as long as price holds above 3320.
Intraday Trade Zones:
Buy the Dip: 3320–3325 – look for pin‑bar/volume bounce.
Quick Re‑Entry: 3330–3335 – trendline or 50‑EMA test confirmation.
Supply Fade (Aggressive): 3350–3355 – bearish rejection setup.
Pro Tip: Focus on clean price action signals (wicks, engulfings, volume) within entry zones and confirm with multi‑timeframe confluences (Fib, EMA, trendlines).
GOLD → Attempt to buy back the fall. Uncertainty factorFX:XAUUSD is falling within our expectations. After breaking through the trigger-level of 3340, the price fell to the liquidity zone of 3306. There is uncertainty in the market...
Gold is rising after a false break of support at 3300-3306, interrupting a three-day decline amid a weakening dollar and ongoing tensions in the Middle East. Investors are cautious due to the unstable truce between Iran and Israel, while the decline in USD/JPY after the Bank of Japan's statements and the rise in PPI in Japan are further supporting demand for gold. Powell's comments on the need for caution in monetary policy only temporarily strengthened the dollar. Now the market is focused on US housing data and the second day of Powell's speech
Technically, the price may consolidate at 3306-3347 for some time and only then show us (against the backdrop of the fundamental sentiment that has formed) which direction it will then take
Resistance levels: 3347, 3364, 3372
Support levels: 3319, 3307
The market is trying to buy back the decline. Tuesday's daily session closed with a long shadow, indicating interest in this price range. A pullback to 3320-3310 is possible before growth to 3340-3347.
Best regards, R. Linda!

DeGRAM | GOLD dipped below the supply zone📊 Technical Analysis
● Price has broken the inner rising-trend support and is sliding inside a fresh descending channel; the current pull-back is stalling in the 3 350-3 365 supply zone, where the old trend-line and a June distribution block overlap, printing consecutive lower highs.
● The channel’s width and the purple flag just completed project to 3 295 support (May pivot + mid-channel); a close beneath it exposes the outer rail / March swing low around 3 245.
💡 Fundamental Analysis
● Hawkish Fed comments have pushed 2-yr yields back above 4.8 % and lifted the DXY, while CFTC figures show a third straight week of long liquidation, curbing bullion bids.
✨ Summary
Fade 3 345-3 360; sustained trade under 3 320 targets 3 295 ➜ 3 245. Short bias void on an H1 close above 3 365.
-------------------
Share your opinion in the comments and support the idea with a like. Thanks for your support!
