#PAXGUSDT #1D (ByBit) Head & Shoulders near breakdownPax Gold printed a shooting star and is losing 50MA now, on daily.
Seems on the verge of a big retracement down towards 200MA support, once neckline is broken.
⚡️⚡️ #PAXG/USDT ⚡️⚡️
Exchanges: ByBit USDT
Signal Type: Regular (Short)
Leverage: Isolated (9.0X)
Amount: 4.9%
Entry Targets:
1) 3349.94
Take-Profit Targets:
1) 3049.06
Stop Targets:
1) 3500.75
Published By: @Zblaba
LSE:PAXG BYBIT:PAXGUSDT.P #1D #PaxGold TVC:XAU
Risk/Reward= 1:2.0
Expected Profit= +80.8%
Possible Loss= -40.5%
Estimated Gaintime= 1.5 months
Gold

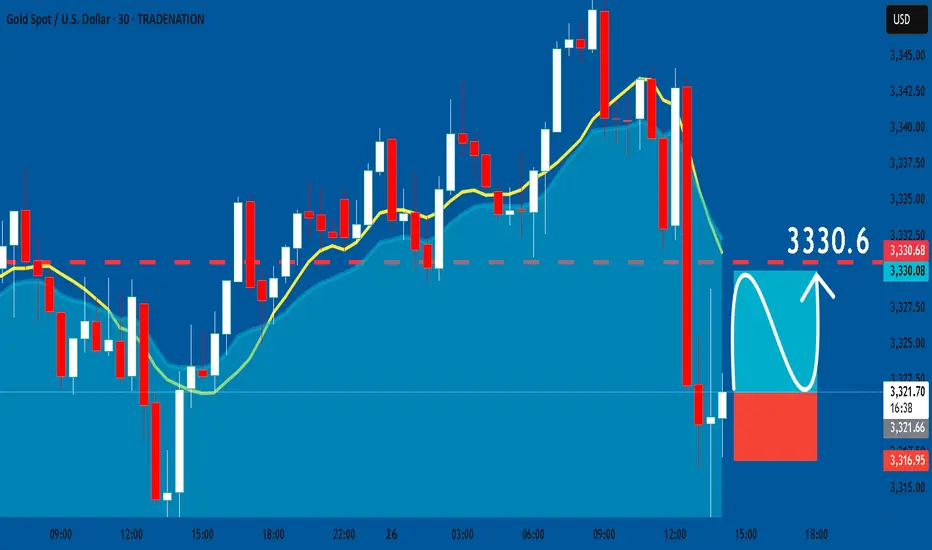
GOLD: Long Trade with Entry/SL/TP
GOLD
- Classic bullish setup
- Our team expects bullish continuation
SUGGESTED TRADE:
Swing Trade
Long GOLD
Entry Point - 3321.6
Stop Loss - 3316.9
Take Profit - 3330.6
Our Risk - 1%
Start protection of your profits from lower levels
Disclosure: I am part of Trade Nation's Influencer program and receive a monthly fee for using their TradingView charts in my analysis.
❤️ Please, support our work with like & comment! ❤️
GOLD - SHORT TO $2,800 (UPDATE)Here's an update from my video analysis yesterday. Gold buyers climbed up towards our sell zone of $3,350 last night, where we closed out our intra-day buy's at £2,500 profit.
Gold sellers so far have rejected that resistance zone & dropped down 400 PIPS! If price can hold steady below this zone we can see much more downside to come. But a break above that zone could push price back up towards $3,400 again.

XAUUSD: Market Analysis and Strategy for June 26Gold technical analysis
Daily chart resistance 3400, support 3295
4-hour chart resistance 3370, support 3312
1-hour chart resistance 3350, support 3328
The gold market has recently shown strong resistance to decline, showing signs of stopping the decline and stabilizing for two consecutive trading days. The low point of the hourly chart is gradually moving up. This positive signal further consolidates the support of the market bottom. Today's opening price is around 3330, and the highest point of the oscillation upward is 3350. The recent volatility has decreased. In the NY market, we will focus on today's opening price of 3330 as the dividing line between long and short. If it falls below this position, the lowest target can be seen near 3312. Before that, you can do scalp buying transactions above 3330.
Buy: 3330near
Buy: 3312near

XAUUSD has been in a strong free fall following the sell strategXAUUSD has dropped sharply in a free fall, perfectly following the sell strategy from 3348–3350.
We have won.
Trading Strategy for XAUUSD OANDA:XAUUSD
Based on the current price structure and short-term bias, here are two tactical trade setups:
Sell Setup – If Price Rejects Resistance
Entry: 3,348 – 3,350 USD
Stop-loss: 3,357 USD
Take-Profit 1: 3,340 USD
Take-Profit 2: 3,335 USD
Take-Profit 3: 3,330 USD
Buy Setup – If Price Holds Support
Entry: 3,328 – 3,330 USD
Stop-loss: 3,320 USD
Take-Profit 1: 3,338 USD
Take-Profit 2: 3,340 USD
Take-Profit 3: 3,348 USD
Important: Always set a stop-loss in every trade to manage risk effectively.

XAUUSD Trading Strategy for June 26–27, 20251. Market Overview
In today’s session (June 26, 2025), XAUUSD OANDA:XAUUSD (gold spot) is trading around 3,339.6 USD, posting a modest +0.22% gain compared to the previous day. The intraday range has been confined between 3,330 – 3,350 USD, reflecting a tug-of-war between buyers and sellers in this short-term equilibrium zone.
Following a recent corrective move, demand has reappeared around the 3,330 USD support. However, the recovery momentum is currently facing resistance near 3,350 USD, and the market will require a clear breakout to establish the next directional move.
2. Technical Analysis
Price Behavior
- Gold is moving sideways within the 3,330 – 3,350 USD range, which has acted as both support and resistance in recent sessions. It is also a high-liquidity zone, indicating indecision among market participants.
- The rebound from the 3,291 – 3,317 USD support zone is still ongoing, but there is no confirmation yet of a completed downtrend or trend reversal.
RSI Indicator
- The RSI (14) is currently fluctuating within the neutral zone (49–54), suggesting a lack of strong momentum in either direction.
- A sustained move above 55 could signal the return of bullish strength.
3. Key Technical Zones
Resistance:
- 3,350 USD: Frequently rejected intraday, immediate resistance to watch
- 3,373 – 3,392 USD: A major confluence of the Fibonacci 0.618 retracement and previous supply zone from last week
Support:
- 3,330 USD: Intraday support and equilibrium zone
- 3,291 – 3,317 USD: Strong structural support in case of further pullback
4. Trading Strategy for XAUUSD OANDA:XAUUSD
Based on the current price structure and short-term bias, here are two tactical trade setups:
Sell Setup – If Price Rejects Resistance
Entry: 3,348 – 3,350 USD
Stop-loss: 3,357 USD
Take-Profit 1: 3,340 USD
Take-Profit 2: 3,335 USD
Take-Profit 3: 3,330 USD
Buy Setup – If Price Holds Support
Entry: 3,328 – 3,330 USD
Stop-loss: 3,320 USD
Take-Profit 1: 3,338 USD
Take-Profit 2: 3,340 USD
Take-Profit 3: 3,348 USD
Important: Always set a stop-loss in every trade to manage risk effectively.
Ps: XAUUSD remains in a short-term consolidation phase, oscillating within a narrow range of 3,330 – 3,350 USD. A breakout beyond this range will likely define the market's direction heading into the New York session. Traders are advised to monitor price action closely within these levels and wait for clear confirmation before executing any positions.
Stay tuned for more daily gold strategies, and don’t forget to save this analysis if it helps refine your trading plan.
Analysis by @Henrybillion

GOLD → Within range. Retest resistance at 3347FX:XAUUSD continues to correct after a false breakdown of support at 3300. Due to uncertainty, the price may remain in the range of 3300-3340 for some time.
Gold is fluctuating amid a weak dollar and uncertainty over Fed rates. Gold is struggling to hold on after rebounding from weekly lows, despite the US dollar falling to multi-year lows. Pressure on the dollar has intensified due to Trump's criticism of the Fed and rumors of a possible replacement for Powell. However, gold is limited in its growth due to a pause in geopolitical tensions and hawkish signals from the Fed chair. Investors are awaiting key macro data from the US (e 12:30 GMT Durable goods orders, GDP, Initial Jobless Claims) and especially the PCE inflation report on Friday.
Technically, the focus is on key areas of interest: 3300, 3306, 3340, 3347. Until strong news emerges, an intraday trading strategy should be considered.
Resistance levels: 3347, 3357
Support levels: 3320, 3307, 3300
Technically, a false breakout of resistance at 3347 and a retest of the local liquidity zone at 3320-3307 are possible before growth continues for the reasons mentioned above. Targets could be 3347, 3364, 3372, and 3396.
Best regards, R. Linda!

DeGRAM | GOLD rebound📊 Technical Analysis
● Friday’s flush tagged the green 3 300–3 310 demand and the long-term trend-support, then left a bullish gap inside the falling channel; price is now basing above the gap midpoint and printing higher lows toward the pink supply.
● A clean break of channel resistance at 3 348 completes a 4 h inverse-H&S measured to the next confluence at 3 375 (May pivot / former range top).
💡 Fundamental Analysis
● Core PCE cooled to 0.1 % m/m, pulling real 2-yr yields to two-week lows while IMF flagged persistent central-bank bullion buying—both restoring bid tone in gold.
✨ Summary
Long 3 320-3 335; clearance of 3 348 targets 3 375. Bias void on a 4 h close below 3 300.
-------------------
Share your opinion in the comments and support the idea with a like. Thanks for your support!

GOLD: Target Is Down! Short!
My dear friends,
Today we will analyse GOLD together☺️
The market is at an inflection zone and price has now reached an area around 3,342.22 where previous reversals or breakouts have occurred.And a price reaction that we are seeing on multiple timeframes here could signal the next move down so we can enter on confirmation, and target the next key level of 3,336.36..Stop-loss is recommended beyond the inflection zone.
❤️Sending you lots of Love and Hugs❤️

GBPUSD 1H | Bearish Divergence GBPUSD has reached a critical technical zone where multiple confluences are signaling a downside correction:
✅ Bearish Divergence spotted on RSI at the top, indicating momentum exhaustion.
✅ Price got rejected from a strong Daily Supply Zone, showing clear institutional selling pressure.
✅ On the LTF (Lower Timeframe), structure has shifted — new Lower Highs (LH) and Lower Lows (LL) are now printing, confirming a short-term bearish trend change.
✅ Price also broke the LTF trendline and is retesting, adding further bearish confluence.
📊 Bias:
Expecting a corrective move to the downside with targets around previous liquidity zones:
⚠️ Market is still sensitive to USD fundamentals this week, so watch key news events for volatility spikes.
🔔 Wait for proper confirmations and manage risk accordingly.

DeGRAM | GOLD held the lower boundary of the channel📊 Technical Analysis
● Price bounced from the channel floor (≈ 3 320) forming a bullish falling-wedge whose breakout target coincides with the median resistance at 3 348.
● Hidden RSI divergence and a series of higher lows inside today’s micro-range show buyers absorbing supply; reclaiming the wedge apex should accelerate toward the upper channel band near 3 375.
💡 Fundamental Analysis
● Spot-ETF inflows resumed and Fed-funds futures now price only one cut this year while real yields eased after soft US consumer-confidence data, trimming dollar bid and reviving gold demand.
✨ Summary
Long 3 320-3 330; wedge break > 3 335 eyes 3 348 then 3 375. Bull view void on a 30 min close below 3 300.
-------------------
Share your opinion in the comments and support the idea with a like. Thanks for your support!

GOLD Can Turn Bearish Now, After Completing a 50% Retracement!GOLD futures analysis for Wed Jun 26th.
Price reached the -FVGand is reacting to it now.
This, after pulling back tothe 50% fib.
Should the FVG fail, Gold is bullish. This is not
supported by fundamentals, though.
As the market environment is more risk on than
off, I expect the -FVG to hold, and the retracement
of the last impulsive move down to end, and a new
bearish leg to begin.
Enjoy!
May profits be upon you.
Leave any questions or comments in the comment section.
I appreciate any feedback from my viewers!
Like and/or subscribe if you want more accurate analysis.
Thank you so much!
Disclaimer:
I do not provide personal investment advice and I am not a qualified licensed investment advisor.
All information found here, including any ideas, opinions, views, predictions, forecasts, commentaries, suggestions, expressed or implied herein, are for informational, entertainment or educational purposes only and should not be construed as personal investment advice. While the information provided is believed to be accurate, it may include errors or inaccuracies.
I will not and cannot be held liable for any actions you take as a result of anything you read here.
Conduct your own due diligence, or consult a licensed financial advisor or broker before making any and all investment decisions. Any investments, trades, speculations, or decisions made on the basis of any information found on this channel, expressed or implied herein, are committed at your own risk, financial or otherwise.

XAUUSD: Gold's Inflationary Tug-of-WarXAUUSD: Gold's Inflationary Tug-of-War – Navigating Powell's Remarks & Key Levels
Hello TradingView community!
Let's dive into Gold (XAUUSD) today, as its price action continues to be shaped by the Federal Reserve's (Fed) cautious stance on inflation and interest rates. Recent comments from Fed Chair Jerome Powell are particularly noteworthy.
🌍 Macroeconomic Drivers: Tariffs, Inflation, and Fed's Deliberation
The market finds itself in a complex situation following key statements from Fed Chair Jerome Powell:
Powell indicated that substantial tariffs could trigger a prolonged wave of inflation, potentially moving beyond conventional economic models. This introduces a new and significant factor into the inflation outlook.
Despite recent inflation moderation, Powell stressed the necessity of more data from June and July before considering any rate cuts. This underscores the Fed's cautious approach and lack of immediate urgency.
He also cautioned about the risk of "price shocks turning into persistent inflation".
In this environment, where market sentiment is stretched between hopes for rate cuts and the emerging risk of tariff-driven inflation, Gold maintains its role as a crucial psychological anchor. Should the Fed be slow to react to this potential new inflationary pressure, Gold's appeal could intensify.
📊 XAUUSD Technical Analysis & Trading Plan:
Based on the XAUUSD charts (H4/M30 timeframe) you provided (e.g., image_008403.png): Gold is currently undergoing a corrective or consolidating phase after a notable pullback. The price is trading below shorter-term moving averages, suggesting either bearish momentum or an accumulation phase.
Key Resistance Zones (Potential SELL Areas):
3,352.383 - 3,353.860: An immediate resistance point, coinciding with the 0.5 Fibonacci level.
Higher up: 3,391.750 - 3,395.000: This represents a very strong previous peak and a major resistance barrier.
Key Support Zones (Potential BUY Areas):
3,317.738 - 3,311.214: An intermediate support area, close to the 0.236 Fibonacci level.
3,302.939 - 3,302.857: A strong demand zone, aligning with the recent low.
Further down: 3,286.257: This is the next significant support level if preceding zones are breached.
🎯 XAUUSD Intraday Trading Plan:
Here are our refined zones and targets for today's trading:
BUY SCALP:
Entry: 3316 - 3314
SL: 3310
TP: 3320 - 3324 - 3328 - 3332 - 3336 - 3340
BUY ZONE:
Entry: 3304 - 3302
SL: 3298
TP: 3308 - 3312 - 3316 - 3320 - 3330 - 3340 - 3350
SELL SCALP:
Entry: 3353 - 3355
SL: 3360
TP: 3350 - 3345 - 3340 - 3335 - 3330
SELL ZONE:
Entry: 3390 - 3392
SL: 3396
TP: 3386 - 3382 - 3378 - 3374 - 3370 - 3360
⚠️ Key Factors to Monitor:
Fed Official Speeches: Any new comments from Fed officials regarding inflation or monetary policy outlook.
US Economic Data: Upcoming inflation (CPI, PCE) and employment reports (NFP) will be crucial for policy expectations.
Geopolitical Developments: Ongoing global tensions consistently bolster Gold's safe-haven appeal.
Trade wisely and always manage your risk effectively! Wishing everyone a profitable trading day!


XAU/USD) Bullish trand Read The captionSMC trading point update
Technical analysis of Gold (XAU/USD) on the 1-hour timeframe, highlighting a breakout from consolidation supported by key levels and trend structure. Here’s the detailed analysis:
---
Technical Breakdown
1. Key Support Zone
Price has formed a strong base around 3,315–3,325, with multiple bullish rejections (green arrows).
This zone has acted as a demand level, reinforcing bullish structure.
2. Ascending Trendline Support
An uptrend line supports higher lows, showing momentum building to the upside.
3. EMA 200
Price is now challenging the 200 EMA (3,353.41) — a key dynamic resistance.
A successful breakout and retest above this EMA will likely fuel continued bullish movement.
4. Breakout & Measured Move Projections
The chart indicates a bullish breakout from a consolidation box (yellow zone).
Measured move targets based on the previous rally:
First target: 3,368.86 (1.17%)
Second target: 3,381.55 (1.75%)
5. RSI Confirmation
RSI (14) is around 57, showing bullish momentum but still below overbought—supporting further upside potential.
Mr SMC Trading point
---
Conclusion / Idea Summary
Bias: Bullish
Entry Zone: On pullback into 3,330–3,340 range or breakout retest above EMA 200
Targets:
3,368.86
3,381.55
Invalidation: Sustained close below 3,320 and break of the uptrend line
---
Please support boost 🚀 this analysis)

GOLD H4 Accumulation Fractal Target is 4 000 USD 🏆 Gold Market Mid-Term Update
📉 Gold Pullback: XAU/USD drifted below $3,350, falling to around $3,325–$3,330 amid easing Middle East tensions and a firmer U.S. dollar.
🤝 Ceasefire Effect: De-escalation in Israel-Iran hostilities reduced safe-haven demand, capping gold’s upside.
💵 Fed & USD Dynamics: Fed Chair Powell reaffirmed that policymakers aren’t in a rush to cut rates. A softer dollar provided some support, but intraday USD strength weighed on gold.
📊 Technical Watch: Gold remains in a bearish short-term structure below the 200-period SMA. Resistance lies near $3,368–$3,370; support cluster begins around $3,300, with potential slide to $3,245–$3,200 if broken.
🔮 Forecast Updates:
• Citi Research flagged that gold may have peaked and could undergo further softening in Q3-2025.
• WSJ notes gold posting weekly gains, with futures steadying at $3,339/oz.
• Another WSJ report suggests potential for new highs later this year—forecasting an average of $3,210/oz in 2025, a 35% increase.
⚠️ Market Split: Opinions are fragmented—Wall Street sees mixed short-term direction, while Main Street maintains a bullish stance ahead of key U.S. data (GDP, PCE, jobless claims).
🏠 Central Bank Demand: Sustained demand from central banks reinforces gold’s structural support.
🔮 Live Price Snapshot: Futures are up ~0.2%, trading at $3,339.20/oz today.
📊 Technical Outlook Update
🏆 Bull Market Overview
▪️ A pullback is currently unfolding
▪️ Heavy resistance seen at $3,500
▪️ Possible re-accumulation underway
▪️ Scenario mirrors summer 2024
▪️ Accumulation before breakout
▪️ Downside protected around $3,150
▪️ Short-term range trading in progress
▪️ Bulls maintain strategic upper hand
⭐️ Recommended Strategy
▪️ Buy dips within the range
▪️ Look for entries near $3,150 S/R zone
▪️ Long-term bullish target of $4K remains intact

GOLD - Price can continue to move down in falling channelHi guys, this is my overview for XAUUSD, feel free to check it and write your feedback in comments👊
Some days ago price bounced from support level and started to grow to $3400 level, making a small correction before.
When it reached this level, price entered to wedge, where it made a correction and then started to grow.
In a short time, price exited from wedge and soon broke $3400 level, but then it started to decline in a falling channel.
In falling channel, Gold broke $3400 level one more time and in a short time declined to $3305 support level.
After this movement, Gold turned around and started to move up to resistance line of channel.
I expect that Gold can reach resistance line of channel and then start to decline to $3295 support area.
If this post is useful to you, you can support me with like/boost and advice in comments❤️
Disclaimer: As part of ThinkMarkets’ Influencer Program, I am sponsored to share and publish their charts in my analysis.

Gold Price ActionHello Traders,
There’s a potential Buy/Sell opportunity here based on the current price action. I’ve marked trendlines on two different timeframes, which highlight key Support and Resistance levels.
I've shared more detailed analysis on my channel, so feel free to check that out for deeper insights.
When the price reacts (rejects) from these support or resistance zones, we can look to confirm our entry by analyzing volume—this helps us avoid false signals.
For trade management, consider using a Risk-Reward ratio between 1:2 and 1:5, depending on your personal trading style. Most importantly, avoid trading blindly—always wait for confirmation.
Wishing you all the best and happy trading!
Thank you!

XAUUSD Possible Move 26.05.2025Gold is currently respecting an ascending channel, showing consistent higher highs and higher lows. Price is now testing the upper boundary of this channel and approaching a key supply zone (3353–3357), which previously triggered a strong sell-off.
Key Zones:
🔼 Sell Zone: 3353–3357 (confluence of supply + channel resistance)
🔽 Buy Zone: 3325–3329 (demand zone + channel support)
✅ Trade Ideas:
📍Buy Setup
Entry: 3325–3329
SL: Below 3310
TP: 3350–3355
📍Sell Setup
Entry: 3353–3357
SL: Above 3367
TP: 3330–3325
🔔 Important Note:
⚠️ Today's U.S. Jobless Claims data is critical. Expect volatility and possible breakout/fakeout scenarios around the time of release. Trade only on confirmation.

Hanzo | 30-Min Setup / incoming 300 Pip After Break Out Time Frame: 30 -Minute Warfare
Entry Mode: Only after verified Break out
🩸Bullish Break : 3338 : 3342.5
Price must break liquidity with high volume to confirm the move.
➕ Hanzo Protocol: Dual- Entry Intel
Zone Activated: Deep Analysis ( 3338 ) Point
why we did chose it ?
Solid Key level
➗1st Wick Touch (11 Jun /2025)
➗2nd Wick Touch (12 Jun /2025)
➗3rd Wick Touch (24 Jun /2025)
Deep Analysis ( 3338 ) Point
why we did chose it ?
➗1st Wick Touch (11 Jun /2025)
➗2nd Wick Touch (11 Jun /2025)
➗3rd Wick Touch (11 Jun /2025)
➗4th x2 Wick Touch (20 Jun /2025)
➗5th x2 Wick Touch (24 Jun /2025)
🔖That means we created a Solid Zone (3338 : 3342) of Breakout on the 30-min Chart -
Price must break liquidity with a clear 30-min candle to confirm the move.

Hanzo Drex | 15-Min Bearish Reversal Setup – 300 Pips in Sight🔥 Gold – 15 Min Scalping Analysis
⚡️ Objective: Precision Reversal Execution
Time Frame: 15 -Minute Warfare
Entry Mode: Only after verified Reversals
👌Bearish Reversal : 3346
Price must break liquidity with high volume to confirm the move.
☄️ Hanzo Protocol: Dual-Direction Entry Intel
➕ Zone Activated: Strategic liquidity layer detected — mapped through refined supply/demand mechanics. Volatility now rising. This isn’t noise — this is bait for the untrained. We're not them.
🦸♂️ Tactical Note:
The kill shot only comes after the trap is exposed and volume betrays their position.
5

Potential bullish rise?The Gold (XAU/USD) is reacting off the pivot and could rise to the 1st resistance.
Pivot: 3,334.86
1st Support: 3,315.22
1st Resistance: 3,356.66
Risk Warning:
Trading Forex and CFDs carries a high level of risk to your capital and you should only trade with money you can afford to lose. Trading Forex and CFDs may not be suitable for all investors, so please ensure that you fully understand the risks involved and seek independent advice if necessary.
Disclaimer:
The above opinions given constitute general market commentary, and do not constitute the opinion or advice of IC Markets or any form of personal or investment advice.
Any opinions, news, research, analyses, prices, other information, or links to third-party sites contained on this website are provided on an "as-is" basis, are intended only to be informative, is not an advice nor a recommendation, nor research, or a record of our trading prices, or an offer of, or solicitation for a transaction in any financial instrument and thus should not be treated as such. The information provided does not involve any specific investment objectives, financial situation and needs of any specific person who may receive it. Please be aware, that past performance is not a reliable indicator of future performance and/or results. Past Performance or Forward-looking scenarios based upon the reasonable beliefs of the third-party provider are not a guarantee of future performance. Actual results may differ materially from those anticipated in forward-looking or past performance statements. IC Markets makes no representation or warranty and assumes no liability as to the accuracy or completeness of the information provided, nor any loss arising from any investment based on a recommendation, forecast or any information supplied by any third-party.

GOLD (XAUUSD): Updated Support & Resistance Analysis
Here is my latest support and resistance analysis for Gold.
Horizontal Structures
Support 1: 3294 - 3312 area
Support 2: 3231 - 3287 area
Support 3: 3121 - 3176 area
Resistance 1: 3338 - 3368 area
Resistance 2: 3441 - 3451 area
Resistance 3: 3493 - 3500 area
Vertical Structures
Vertical Support 1: Falling trend line
Consider these structures for pullback/breakout trading.
❤️Please, support my work with like, thank you!❤️
I am part of Trade Nation's Influencer program and receive a monthly fee for using their TradingView charts in my analysis.
