XAUUSD ANALYSIS – JULY 18XAUUSD ANALYSIS – JULY 18: STRATEGY BASED ON FIBONACCI, TRENDLINE & STRUCTURE
1. XAUUSD Technical Overview (4H Chart)
Gold (XAUUSD) is currently trading around 3,343 USD, showing signs of a slight rebound from key support. On the 4H timeframe, the price structure is forming higher lows, maintaining above a short-term rising trendline – a technically bullish signal.
2. Key Support & Resistance Zones
Immediate Supports:
3,338 USD: aligning with the 0.618 Fibonacci retracement – a zone tested multiple times.
3,333 – 3,335 USD: strong support, overlapping with EMA and rising trendline.
3,327 USD: previous swing low – last defense for the bullish structure.
Immediate Resistances:
3,345 – 3,346 USD: frequently rejected zone in recent sessions.
3,350 USD: psychological and technical resistance.
3,358 USD: recent swing high – breakout confirmation level.
3. Price Action & Fibonacci Confluence
Price is currently hovering between Fibo 0.5 (3,343 USD) and Fibo 0.618 (3,338 USD) – a potential bounce zone if bullish momentum holds.
The pullback from 3,358 to 3,286 has respected standard Fibonacci retracement levels, confirming technical price behavior.
4. Trendline Analysis
The ascending trendline from the 3,275 USD low remains intact, providing solid dynamic support.
If the price continues to bounce from this trendline, it may form a bullish continuation pattern (flag/pennant).
5. Suggested Trading Strategies
Long
Entry: 3,338 – 3,340 USD
SL: 3,327 USD
TP: 3,345 – 3,350 – 3,358 USD
Note: Buying the dip near Fib & trendline
Short
Entry: Below 3,327 USD (breakdown)
SL: Above 3,340 USD
TP: 3,310 – 3,298 USD
Notes: Only if price breaks trendline & support
6. Supporting Technical Indicators
EMA20/EMA50 show slight upward momentum – early bullish bias.
RSI (14) hovers near 50 – neutral zone, awaiting breakout confirmation.
Conclusion:
Gold is consolidating around a critical support zone. The short-term bias leans bullish if the 3,338 – 3,333 USD region holds and price breaks above 3,346 – 3,350 USD.
This is a key moment to position early using Fibonacci and trendline confluence.
👉 Follow for more strategies in upcoming sessions. Save this if you find it useful!
Do you have a different view? Share your thoughts in the comments below!
Gold

XAUUSD H4 I Bullish Bounce Off Based on the H4 chart analysis, the price is falling toward our buy entry level at 3339.71, a pullback support.
Our take profit is set at 3370.26, a swing high resistance.
The stop loss is placed at 3307.53, a pullback support.
High Risk Investment Warning
Trading Forex/CFDs on margin carries a high level of risk and may not be suitable for all investors. Leverage can work against you.
Stratos Markets Limited (tradu.com ):
CFDs are complex instruments and come with a high risk of losing money rapidly due to leverage. 66% of retail investor accounts lose money when trading CFDs with this provider. You should consider whether you understand how CFDs work and whether you can afford to take the high risk of losing your money.
Stratos Europe Ltd (tradu.com ):
CFDs are complex instruments and come with a high risk of losing money rapidly due to leverage. 66% of retail investor accounts lose money when trading CFDs with this provider. You should consider whether you understand how CFDs work and whether you can afford to take the high risk of losing your money.
Stratos Global LLC (tradu.com ):
Losses can exceed deposits.
Please be advised that the information presented on TradingView is provided to Tradu (‘Company’, ‘we’) by a third-party provider (‘TFA Global Pte Ltd’). Please be reminded that you are solely responsible for the trading decisions on your account. There is a very high degree of risk involved in trading. Any information and/or content is intended entirely for research, educational and informational purposes only and does not constitute investment or consultation advice or investment strategy. The information is not tailored to the investment needs of any specific person and therefore does not involve a consideration of any of the investment objectives, financial situation or needs of any viewer that may receive it. Kindly also note that past performance is not a reliable indicator of future results. Actual results may differ materially from those anticipated in forward-looking or past performance statements. We assume no liability as to the accuracy or completeness of any of the information and/or content provided herein and the Company cannot be held responsible for any omission, mistake nor for any loss or damage including without limitation to any loss of profit which may arise from reliance on any information supplied by TFA Global Pte Ltd.
The speaker(s) is neither an employee, agent nor representative of Tradu and is therefore acting independently. The opinions given are their own, constitute general market commentary, and do not constitute the opinion or advice of Tradu or any form of personal or investment advice. Tradu neither endorses nor guarantees offerings of third-party speakers, nor is Tradu responsible for the content, veracity or opinions of third-party speakers, presenters or participants.

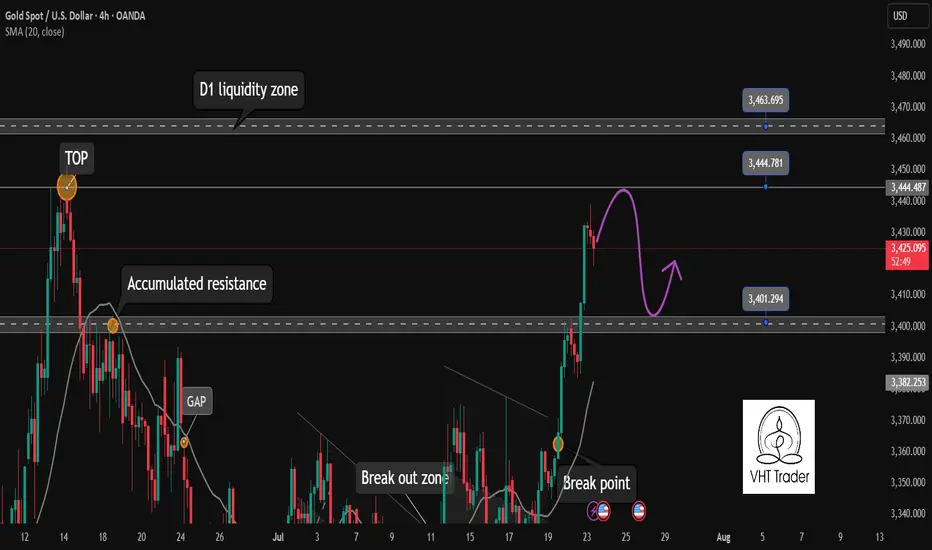
Gold will pause its rally today. Be cautious✏️ OANDA:XAUUSD continues to hit new highs this week. As the daily candle closes above the 3430 area, gold is creating a wide trading range of about 50 prices today. The uptrend may face a slight slowdown due to profit-taking psychology of some investors.
📉 Key Levels
Sell trigger: Rejection from 3445
Sell zone: 3463
Target: 3405
BUY trigger: 3402 (Price retests breakout zone and buyers react)
Leave your comments on the idea. I am happy to read your views.
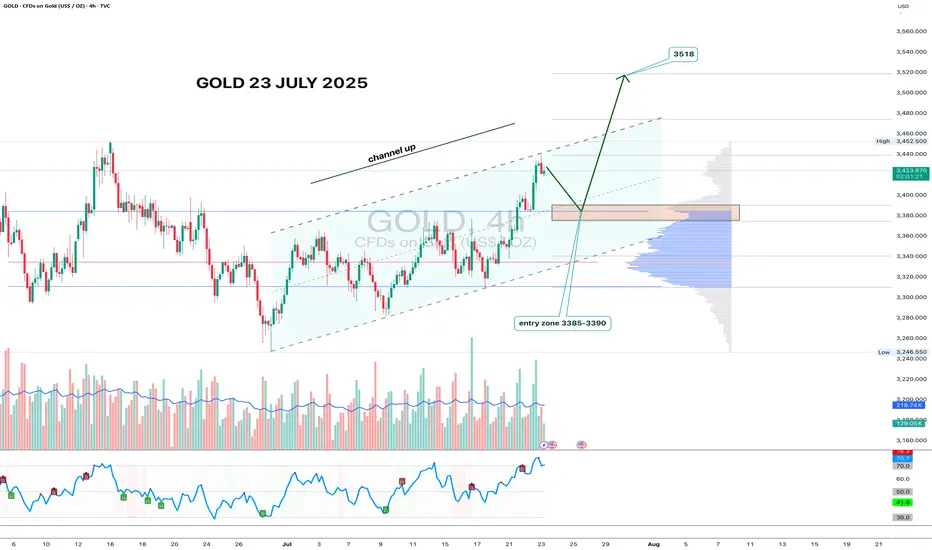
Gold 4H - channel breakout, looking for 3518 nextGold has formed a clean ascending channel on the 4H chart, broke out above resistance, and is now pulling back into the 3385–3390 zone. This area aligns with volume clusters - a perfect entry zone for bulls waiting on the sidelines.
If price holds this zone and prints a reversal candle with volume, the upside target remains at 3518 - the 1.618 Fibonacci extension and historical resistance. Volume increased during the breakout move, confirming interest. RSI still has room to go higher, supporting the bullish continuation.
Fundamentally, gold remains a safe-haven asset amid geopolitical tension, USD weakness, and potential Fed easing. Central bank accumulation further supports the bullish case.
Tactical setup:
— Entry zone: 3385–3390
— Trigger: candle confirmation + volume
— Target: 3518
— Invalidation: break below 3360 without buyer volume
If the plan plays out — gold might shine bright while bears squint in disbelief.
Gold (XAU/USD) 4‑Hour Technical Analysis: July 23, 2025Gold continues to trade in a bullish structure on the 4‑hour timeframe, holding above $3,420 after a steady advance from early July lows. At the time of writing, XAU/USD stands at $3,423.8, confirmed by Investing.com. This analysis employs a comprehensive blend of globally‑recognized technical tools — ranging from price action and classical indicators to institutional concepts — to identify the most probable trading zones and a high‑conviction setup.
Current Price Structure and Trend
On the 4‑hour chart, gold maintains a clear bullish market structure, consistently printing higher highs and higher lows since early July. The current price action unfolds within a well‑defined rising channel, bounded approximately between $3,400 on the lower side and $3,450 on the upper. Twice in the past week, price has tested and respected the channel’s lower boundary, confirming its validity.
Support and resistance levels are evident: immediate support lies at $3,410, coinciding with the 50% Fibonacci retracement of the July impulse wave. Below that, $3,390–$3,395 offers secondary support at the channel’s base and a longer‑term Fibonacci cluster. Resistance is concentrated at $3,445–$3,450, aligning with the channel top, upper Bollinger Band, and prior swing highs, while a secondary ceiling may emerge near $3,468–$3,470, corresponding to an Elliott Wave 3 extension target.
Candlestick, Volume, and Momentum
Recent price action has been supported by bullish candlestick formations. Notably, a strong bullish engulfing bar formed at $3,410 earlier this week, affirming institutional demand at that level. Volume profile analysis shows the heaviest transaction cluster between $3,410–$3,420, confirming this area as a smart money accumulation zone.
Volume‑weighted average price (VWAP ) currently runs near $3,418, with price holding above it, reflecting institutional positioning in favor of the bulls. Momentum indicators support the trend: MACD on the 4‑hour has just crossed bullish, RSI prints at 60 — strong but not overbought — and ADX climbs to 24, indicating a trend strengthening phase.
Indicators, Patterns, and Institutional Concepts
Trend indicators reinforce the bullish view. The 50‑ and 100‑period exponential moving averages converge around $3,415–$3,420, providing dynamic support. Ichimoku analysis shows price well above the Kumo (cloud), with a bullish Tenkan‑Kijun configuration. Bollinger Bands are widening, and price is leaning toward the upper band — a classic signal of volatility expansion in trend direction.
Classical and harmonic patterns offer further evidence. The current consolidation resembles a bull flag, suggesting continuation. Elliott Wave analysis points to a third wave in progress, with an upside projection into the $3,448–$3,468 area. Smart money concepts confirm that the recent break above $3,420 constituted a bullish break of structure (BOS), with price now retracing into a favorable gap (FVG) and a 4‑hour bullish order block anchored around $3,410–$3,415.
Liquidity and stop‑clusters likely sit above $3,445 and $3,468, making these logical targets for bullish campaigns.
Market Context and Sentiment
Gold is benefiting from a softening US dollar and a drop in volatility indexes. Seasonal tendencies also lean bullish into late summer. Sentiment on professional platforms aligns with this view: TradingView top authors and FXStreet analysts favor buying pullbacks into $3,410–$3,415 and targeting $3,450–$3,468, which harmonizes with this analysis. No major divergence from consensus is noted, adding to confidence.
Identified Trading Zones
Two strong buy zones emerge on the 4‑hour chart. The most immediate and highest‑confidence zone is $3,410–$3,415, supported by channel support, Fibonacci retracement, VWAP, moving averages, and an order block. Below this lies a secondary buy zone at $3,390–$3,395, tied to deeper Fibonacci support and the rising channel’s lower boundary.
On the other hand, clear sell zones are defined at $3,445–$3,450, where upper channel resistance, Bollinger bands, and prior highs converge, and a secondary zone at $3,468–$3,470, aligned with wave targets and round‑number psychological resistance. These areas are likely to attract profit‑taking and potential reversals.
The Golden Setup
Among the findings, one trade stands out as the highest‑conviction setup:
A long position at $3,415, with a stop loss at $3,405 and a take profit at $3,450.
This trade is backed by strong confluence: price pulling back into a well‑defined demand zone ($3,410–$3,415) that features order block support, Fibonacci retracement, VWAP alignment, EMA cluster support, and a rising channel boundary. The target sits just below the first significant resistance band ($3,445–$3,450), offering a favorable risk‑to‑reward ratio. The confidence level on this setup is rated at 8/10, given the multi‑method alignment and consistent sentiment from professional sources.
Summary Table
Category Levels / Details
Buy Zones $3,410–$3,415, $3,390–$3,395
Sell Zones $3,445–$3,450, $3,468–$3,470
Golden Setup Long @ $3,415 / SL $3,405 / TP $3,450 (Confidence: 8/10)
In conclusion, gold maintains a constructive technical outlook on the 4‑hour timeframe. The prevailing bullish structure, reinforced by classical and institutional methodologies, supports a continuation toward the $3,450–$3,468 region. The suggested Golden Setup provides a disciplined, high‑probability entry at a key inflection zone, consistent with both technical evidence and prevailing market sentiment.

Euro Surges as Dollar Falters Amid Political TensionsThe EUR/USD pair is experiencing a strong rally, breaking above the 1.1760 level — its highest point in two weeks as of Tuesday. This sharp move not only signals the Euro’s recovery strength but also highlights the impact of heavy selling pressure on the US dollar.
The driving force? Ongoing trade tensions, coupled with rising uncertainty surrounding the escalating feud between President Trump and Fed Chair Jerome Powell, are shaking investor confidence in the stability of US monetary policy.
As a result, the dollar is losing its safe-haven appeal, paving the way for EUR/USD to climb higher. If this bullish momentum holds, the next key target for the pair could be around 1.1800.

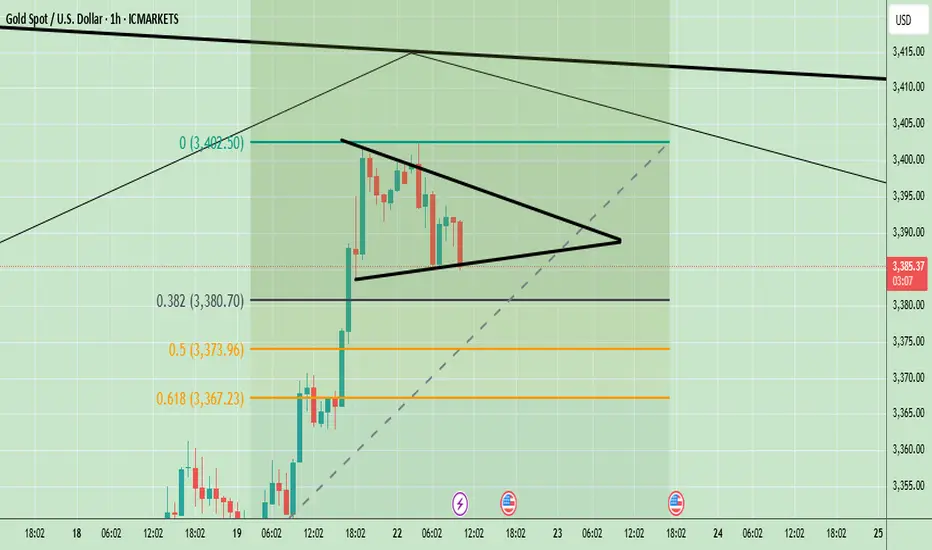
XAUUSD Technical Analysis – Triangle Breakout Ahead?Gold is currently consolidating in a symmetrical triangle pattern around $3,389. If it breaks above $3,402, we can expect a bullish continuation toward $3,420 and beyond. Key support lies at $3,367; a breakdown below this level would turn the trend bearish. The overall trend is still bullish, but a breakout is needed for confirmation.
📈 Potential Scenarios:
✅ Bullish Breakout Scenario:
- Break above $3,392–$3,402 zone.
- Targets: $3,420 > $3,450 > $3,480
- Supported by strong upward BOS (Break of Structure) and higher lows.
❌ Bearish Breakdown Scenario:
- Breakdown below $3,373–$3,367 zone.
- Targets: $3,355 > $3,345
- Would invalidate current bullish structure and form a lower low.
🔮 Trend Bias:
Bullish Bias remains intact as long as price stays above $3,367 and maintains higher lows. However, consolidation suggests waiting for breakout confirmation from the triangle before entering new trades.
🧭 Trend Outlook:
Gold is currently consolidating in a symmetrical triangle pattern, which typically precedes a breakout — either upward or downward. The price is holding above the key Fibonacci support levels and the overall market structure is bullish, suggesting an upward continuation is more likely if buyers maintain momentum.
Note
Please risk management in trading is a Key so use your money accordingly. If you like the idea then please like and boost. Thank you and Good Luck!
HUGE Cup & Handle On BTC/GOLDAre we in the same situation as in 2017? At that time, BTC followed with a 500% rally. Do you think history is repeating itself?
If we use the same percentages, we'll have a BTC/GOLD rally of 600%. This would mean that BTC could make 250%.

XAUUSD Trade Idea: Golden Cross Signals Bullish MomentumGold (#XAUUSD) is surging after breaking above the 61.8% Fibonacci level, confirming strong bullish momentum!
📊 Key Observations:
Price has bounced off the upper trendline, with an imbalance below, suggesting a possible small correction.
The MA50 has crossed above the MA200, forming a Golden Cross – a highly bullish signal!
🎯 Trade Strategy:
🔼 Consider buying ONLY if price consolidates above 3400 & the nearest fractal.
✅ Target: 3435 (next resistance zone)
⚠️ Watch for pullbacks – the Golden Cross supports upside, but a retest of support could offer a better entry.

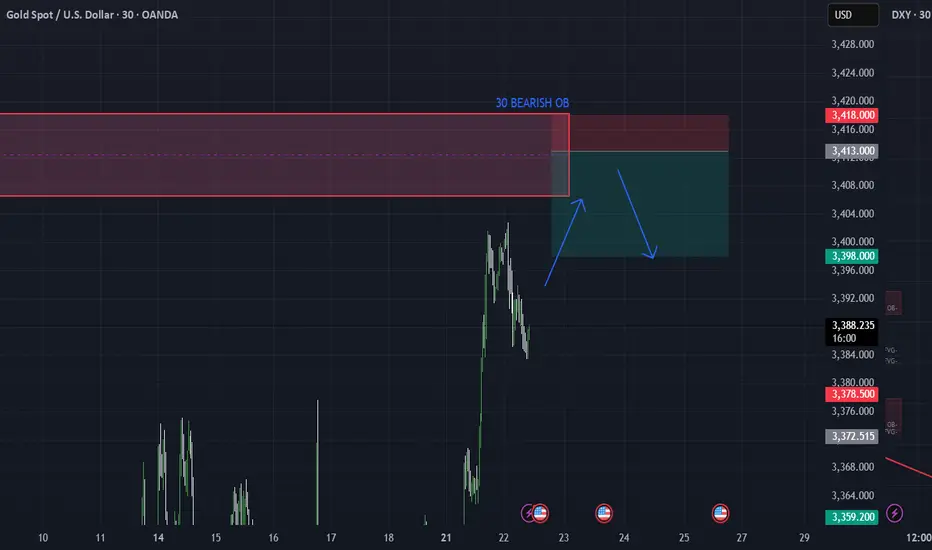
XAUUSD 30M – OB Sell Limit Setup for 3R Opportunity by PhoenixFXGold 30M Chart – Smart Money Sell Limit
We’re watching a clean Order Block (OB) on the 30-minute timeframe as price retraces into a key supply zone. This setup offers a high-probability reversal opportunity with a 3R risk-to-reward ratio. ✅
📍 ENTRY: 3413
🛑 SL: 3418 (above structure)
🎯 TP1: 3408 (1R)
🎯 TP2: 3403 (2R)
🎯 TP3: 3398 (3R)
The price action shows signs of exhaustion and premium pricing as it returns into a previous OB. We’re positioning with precision and tight risk.
📌 Strategy:
– 30M OB zone
– Clear BOS + retracement
– Set & forget execution
#XAUUSD #Gold #OrderBlock #SupplyZone #SmartMoney #PhoenixFX #RiskReward
Gold Approaches 3,370 Resistance – Watch for Short-Term PullbackIn the July 21st trading session, gold (XAUUSD) on the H1 timeframe continues to push higher and is now testing a key resistance zone around 3,370 USD, which aligns with the 3.618 Fibonacci extension level. This zone is considered a high-probability area for profit-taking after a strong rally from the 3,308–3,310 USD support zone (aligned with the 0.5 and 0.618 Fibonacci retracement levels). The short-term bullish structure remains intact as long as price stays above the rising trendline from July 18th, with dynamic support currently sitting near 3,350 USD.
From a price action perspective, the latest candles are showing upper wicks near the 3,370 resistance, suggesting early signs of selling pressure. If combined with an overbought RSI condition (often seen in such extended moves), this increases the probability of a short-term retracement.
Key intraday levels to watch:
– Resistance: 3,370.43 (Fibonacci 3.618 extension)
– Dynamic Support: 3,350 (ascending trendline)
– Major Support: 3,310 – 3,308 (Fibonacci 0.618 – 0.5)
– Trend Reversal Level: 3,298.21 (recent swing low)
XAUUSD Trading Strategy for Today:
Primary Scenario – Short Setup near 3,370 if bearish confirmation appears:
Entry: 3,370 – 3,372
Stop Loss: 3,378
Take Profit: 3,350 → 3,330 → 3,310
Alternative Scenario – Buy the dip at trendline support if bullish price action confirms:
Entry: 3,350
Stop Loss: 3,340
Take Profit: 3,370 → 3,380+
In summary, gold is trading at a critical short-term resistance zone. A rejection from 3,370 could trigger a healthy correction toward support zones, while a clean breakout above it would signal strength and open the path toward 3,380–3,390. Traders should stay alert and wait for clear confirmation before entering positions.
Follow for daily gold strategies and save this post if you found it useful for your trading setup.

Banana republic fears, gold tests $3,400Traders now price in a 60% chance of a Fed rate cut in September, as political pressure on the central bank intensifies.
Republican Rep. Anna Paulina Luna has officially accused Fed Chair Powell of perjury, while Treasury Secretary Scott Bessent has called for a full inquiry into the institution.
Earlier this month, former Fed Chair Janet Yellen told The New Yorker that these actions “...are the ones one expects from the head of a banana republic that is about to start printing money to fund fiscal deficits.”
Amid this backdrop, gold surged past $3,390 per ounce. The 1-hour XAU/USD chart shows strong bullish momentum supported by the Ichimoku cloud: price is well above the cloud with a clean breakout and lagging span confirmation. Immediate resistance sits at $3,400, with a potential extension toward $3,440–$3,450 if bullish pressure holds.
Meanwhile, EUR/USD remains in an uptrend on the daily chart, bouncing from pitchfork support. A sustained move above 1.1700 could reopen the path toward 1.1800+.

XAU/USD Start July 20251. i start after XAU/USD break previous High and correction (fibbo 32.0) respected. based on elliot wave strategy we can targeting end of wave 3 at 3353 area and than correction wave 4 (target at fibbo 32.0 - 50.0). after target correction, continue wave 5 at target 3403 area.
2. fundamentally speaking, new months new quarter. there ins't new catalist and sentiment. Macro Economic this week focus on labour market at US and FED projection to cut rate.
3. War at Iran and Israel, Russia and Ukraine, India and Pakistan, Trade War case, etc,.
4. Will be update

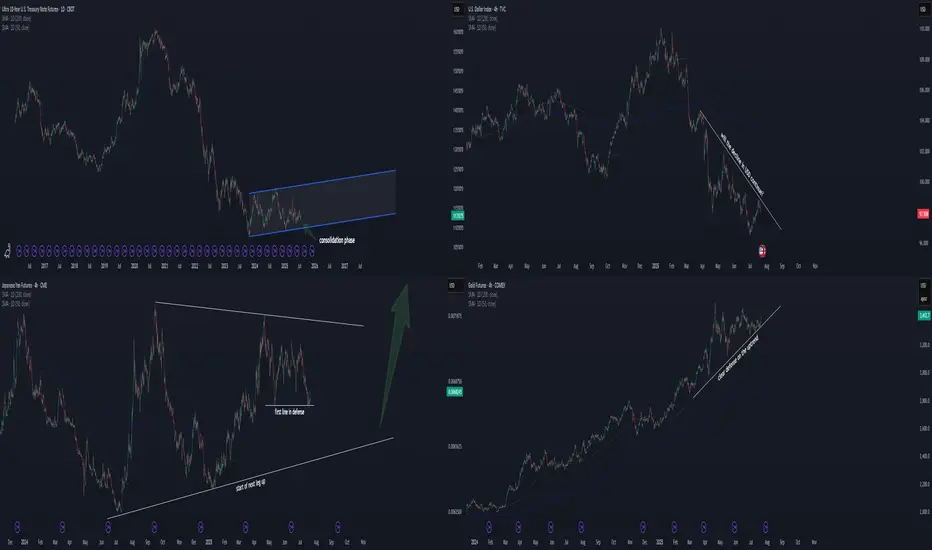
Time to invest in JPY and TN/bond? Hello FX/futures traders!
Market is at a pivotal point. Not in a bad way, but in a good way!
Chart 2: TVC:DXY
Let's start with the US Dollar . A declining USD was just well defended the last few days. If this is true, then the stock up, dollar down scenario is likely to continue. This is good for equities.
Chart 4: COMEX:GC1!
Gold defends its trendline as well. It seems like gold wants to go up more. A raising gold in the current scenario suggests declining USD TVC:DXY . This isn't always true, but we have to look at the current correlation and makes the best educated guess on this.
Logical Deduction 1:
Chart 1: CBOT:TN1!
A consolidation phase has been going on for almost 2 years now. This is definitely
a good sign to long bond, as at least we know the likely bottom for stoploss. With dollar leaning down and gold up, I think TN will defend its current level around 110-113.
Logical Deduction 2:
Chart 3: CME:6J1!
JPY is defending its first key level since May 2025. A wedge is forming, and the breakout is about to take place later this year. Likely the consolidation phase will take more time (with likelihood to breakout to either side). But with a declining USD side by side, I consider now a good entry point to long JPY with controllable risk.
Let me know what you think!
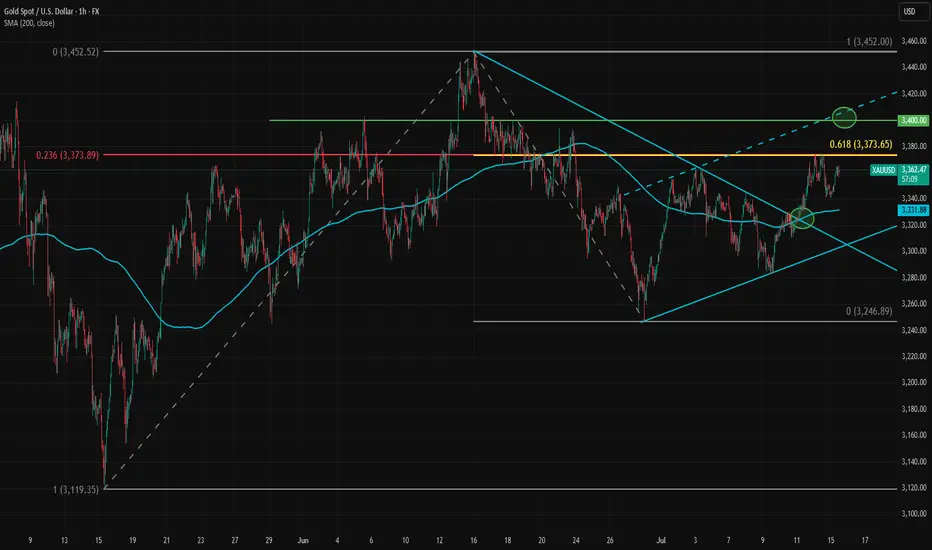
Two Retracement Levels Converge, Creating Strong ResistanceGold is hovering near 3370 amid a wave of tariff-related headlines over the past few days. After Trump’s threats toward Mexico, Canada, and the European Union, gold has been pushing toward higher levels. The latest warning came over the weekend, targeting both the EU and Mexico with a 30% tariff unless an agreement is reached by August 1. The EU trade commissioner described the proposed tariff as “absolutely unacceptable.”
So far, markets remain calm due to ongoing delays in the actual implementation of these tariffs. However, that could change as the August deadline approaches. Trump may view it as politically damaging to issue repeated threats without following through.
Meanwhile, the EU is preparing countermeasures in case the deadline passes without an agreement and the U.S. enforces the 30% tariffs. The EU’s plan targets $84 billion worth of goods, including automobiles, aircraft, wine, bourbon, agricultural and chemical products, plastics, and electrical equipment. The outcome of U.S.-EU negotiations could be a major driver for gold in July.
Another factor to watch is the recent surge in bond yields in Japan. The rising probability that Japan’s ruling coalition may lose its majority is creating uncertainty, especially since opposition parties favor tax cuts and increased government spending. Higher Japanese yields could trigger a reversal in carry trade flows, which might also push up yields in Europe and the U.S.
Gold pushed higher, breaking out of the bearish trendline drawn from the July 13 top, and reached the 3370–3375 area. So far, this zone has provided strong short-term resistance. The 3374 is significant, as it marks both the 23.6% Fibonacci retracement level of the May–June rally and the 61.8% retracement of the June 16–30 pullback. This confluence could make it a key pivot point for gold this week.
If this level is broken, gold could gain further momentum and move above 3400. On the downside, 3342 has been acting as a support level for now.
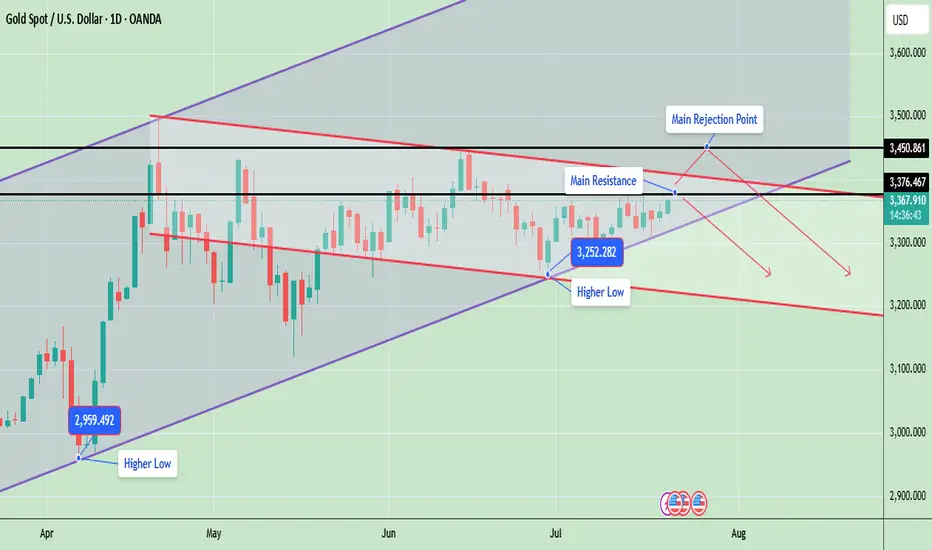
Gold Price Update – Testing Key ResistanceGold is currently trading around 3367, showing strong bullish momentum as it continues to form higher lows, which indicates an ongoing uptrend. The market structure is developing inside a rising wedge pattern, with the price consistently respecting both the ascending support and resistance lines.
Gold is now testing a key resistance zone between 3376 and 3450, an area that previously acted as a major supply zone and caused sharp rejections. A successful breakout and close above 3450 will likely confirm a bullish continuation and may open the door for a rally toward 3500 and possibly 3580. However, if gold fails to break this level, it could retrace back to the 3300 or 3250 support zones, especially if a rejection candle forms in the daily timeframe.
📊 Key Technical Highlights:
- Price has approached the upper resistance boundary of the wedge.
- Daily candle is bullish, indicating strong buying momentum.
- However, unless price closes above 3,376–3,450, there’s still a risk of rejection from the top channel and a pullback toward 3,300–3,250.
🔑 Key levels to watch:
- Gold is currently trading around $3,367, just below a crucial horizontal resistance at $3,376
- A strong breakout above $3,376, and especially above $3,450, could open the door for further bullish movement toward the $3,500–$3,600 range, following the upper trendline of the ascending channel.
- On the downside, if price fails to hold the higher low at $3,252, a drop toward $3,200 or even $3,100 is possible aligning with the downward red trendline.
- The structure remains bullish overall, as price is still making higher lows and staying within the rising channel
📊 Weekly Gold Chart Analysis
Gold is currently trading around $3,368, forming a symmetrical triangle pattern on the weekly timeframe. This pattern typically indicates a period of consolidation before a potential breakout in either direction. The price is getting squeezed between lower highs and higher lows, which is a sign of decreasing volatility and approaching breakout.
🔑 Key Technical Insights:
- ✅ Current Structure: Price has been consolidating within a triangle since April 2025 after a strong upward move. It is now near the apex of the triangle, suggesting a breakout is imminent—most likely in the next 1–2 weeks.
🔼 Bullish Breakout:
- If gold breaks above the triangle resistance (~$3,385–$3,393), it could trigger a sharp rally.
- Upside targets post-breakout: $3,450, $3,500, $3,600+ (if momentum continues)
🔽 Bearish Breakdown:
- A break below the triangle support (~$3,335–$3,325) may lead to a deeper correction.
- Downside targets post-breakdown: $3,285, $3,200
- Possibly $3,100–$3,050 if bearish sentiment intensifies
📉 Volume Drop:
As typical with triangles, volume has likely decreased, signaling indecision. Once volume returns, it will likely confirm the breakout direction.
Note
Please risk management in trading is a Key so use your money accordingly. If you like the idea then please like and boost. Thank you and Good Luck!
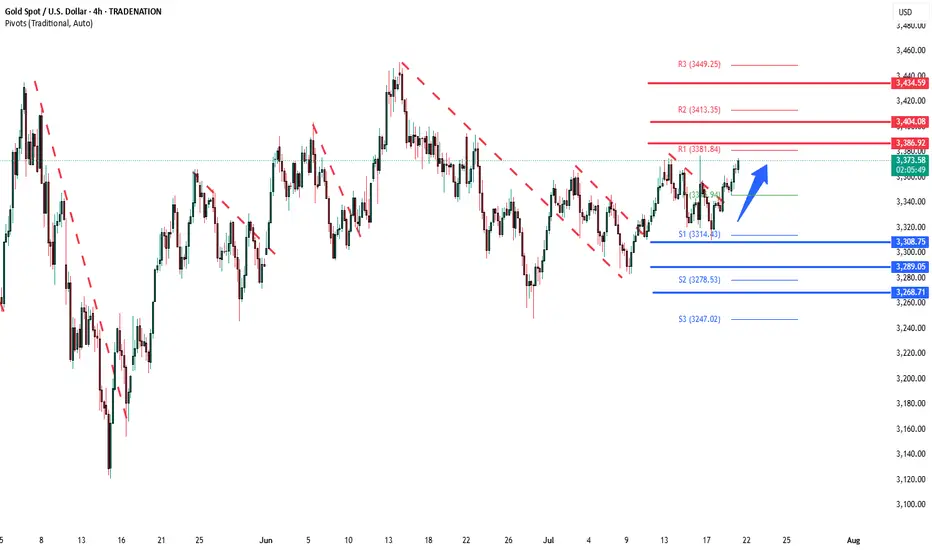
Gold bullish run continuation supported at 3308The Gold remains in a bullish trend, with recent price action showing signs of a continuation breakout within the broader uptrend.
Support Zone: 3308 – a key level from previous consolidation. Price is currently testing or approaching this level.
A bullish rebound from 3308 would confirm ongoing upside momentum, with potential targets at:
3387 – initial resistance
3400 – psychological and structural level
3435 – extended resistance on the longer-term chart
Bearish Scenario:
A confirmed break and daily close below 3308 would weaken the bullish outlook and suggest deeper downside risk toward:
3290 – minor support
3268 – stronger support and potential demand zone
Outlook:
Bullish bias remains intact while the Gold holds above 3308. A sustained break below this level could shift momentum to the downside in the short term.
This communication is for informational purposes only and should not be viewed as any form of recommendation as to a particular course of action or as investment advice. It is not intended as an offer or solicitation for the purchase or sale of any financial instrument or as an official confirmation of any transaction. Opinions, estimates and assumptions expressed herein are made as of the date of this communication and are subject to change without notice. This communication has been prepared based upon information, including market prices, data and other information, believed to be reliable; however, Trade Nation does not warrant its completeness or accuracy. All market prices and market data contained in or attached to this communication are indicative and subject to change without notice.
Gold is rising steadily.Gold technical analysis
Daily chart resistance: 3400, support: 3320
Four-hour chart resistance: 3390, support: 3340
One-hour chart resistance: 3375, support: 3348.
After bottoming out last Thursday, gold began to fluctuate upward on Friday, and the 1-hour bottom structure reappeared, which indicates that a new bullish opportunity has appeared again! It is worth noting that after breaking through 3344 on Friday, it continued to rise to around 3360. Today, after retreating to 3444 in the Asian session, it rose again. 3344 has become the top and bottom conversion position, so we can buy on dips based on the support of 3344. The second is the support at 3331.
In terms of intraday operations, the support below is 3344 and 3331, and it may not fall to around 3344. It is probably waiting to buy in the 3350-55 area. Pay attention to the key resistance around 3377 above. After the 15-minute top pattern appears, sell near this area.
Sell: 3375near
Buy: 3355near

Gold Nears $3,350 as Tariff Risks PersistGold rose to around $3,350 per ounce on Monday, extending its gains for a second session amid concerns over Trump’s tariff strategy. Commerce Secretary Howard Lutnick said a deal with the EU is likely but confirmed the August 1 tariff deadline. He also suggested smaller countries could face at least a 10% tariff, with some rates reaching 40%. Strong US data last week reduced expectations for an immediate Fed rate cut, capping gold’s gains. Markets now await comments from Fed Chair Powell and Governor Bowman for policy signals.
Gold faces resistance at 3380, with additional barriers at 3400 and 3430. Support levels are positioned at 3330, followed by 3295 and extending down to 3250.

XAUUSD 21/07 - Will the Bullish Momentum Continue?In today’s session (July 21), the 1H chart of XAUUSD shows a confirmed breakout above the medium-term descending trendline. The bullish momentum originated from a strong rebound at the confluence zone of support, EMA, and ascending trendline — suggesting a high-probability continuation setup for the short term.
Technical Analysis Overview:
🔹 Price Action Structure:
Price broke out of a falling wedge / descending triangle with a strong bullish Marubozu candle, confirming the breakout move.
Breakout was supported by increased volume, indicating strong institutional buying near 3,346–3,350.
🔹 Trendlines and EMA Outlook:
Price is currently holding above the ascending yellow trendline.
Short-term EMAs (e.g., EMA20/50, not shown) are likely sloping upwards and sitting below price, confirming bullish market structure.
🔹 Key Support and Resistance Levels:
Immediate Resistance: 3,370 USD – recently tested previous swing high.
Major Resistance: 3,378 – 3,385 USD – Fibonacci projection and previous supply zone.
Short-term Support: 3,359 USD – minor pullback zone and EMA alignment.
Major Support: 3,346 USD – the breakout retest zone and price structure support.
Suggested Trading Strategies:
Scenario 1: Buy the Dip
Entry: Near 3,359 – 3,346 USD (on minor retracement)
Stop Loss: Below 3,338 USD (to invalidate the breakout zone)
Target 1: 3,370 USD
Target 2: 3,378 – 3,385 USD
Scenario 2: Breakout Continuation Buy
If price breaks above 3,370 with strong candle + volume:
Entry: Around 3,372 – 3,374 USD
Stop Loss: 3,359 USD
Target: 3,385 – 3,392 USD
Additional Indicators to Watch:
RSI (not shown): If approaching 70+, watch for bearish divergence or exhaustion signals.
Volume: Sustained or increasing volume will confirm strength of the uptrend.
Conclusion:
XAUUSD is showing strong bullish technical signals after breaking the descending trendline and successfully retesting the breakout level. As long as price holds above 3,346 – 3,350, the short-term bullish structure remains intact.
- Follow for more high-quality trading strategies and daily gold analysis. Save this idea if you find it useful for your trading setup!
What’s your view on this analysis? Let’s discuss more in the comments below!

Gold - DAILY- 21.07.2025Gold held steady near $3,350 an ounce as markets opened Monday, with traders assessing mixed signals from Federal Reserve officials on the inflation impact of Trump’s tariff plans. Some Fed governors, like Waller and Bowman, signaled openness to rate cuts, while others remain cautious due to inflation risks. Trump continues pressuring the Fed to lower rates, with speculation about replacing Chair Jerome Powell. Meanwhile, EU officials are preparing for potential trade fallout as Trump’s Aug. 1 tariff deadline approaches. Gold is up over 25% this year, driven by geopolitical tensions and demand for safe-haven assets.
From a technical point of view, the price of gold found sufficient support on the 38.2% of the weekly Fibonacci retracement level and is currently testing the resistance on the 50% around $3,355. The moving averages are confirming the overall bullish trend in the market, while at the same time, the Stochastic oscillator is near the extreme overbought level, hinting at a potential bearish correction move in the upcoming sessions. The Bollinger bands are quite expanded, showing that volatility is there to support any short-term move to either side, while the level around $3,380 is the first major technical resistance area consisting of the upper band of the Bollinger bands and the 61.% of the weekly Fibonacci retracement level.
Disclaimer: The opinions in this article are personal to the writer and do not reflect those of Exness

Gold (XAU/USD) Technical Outlook — 21 July 20251. Market Overview & Live Price Confirmation
Gold is currently trading around $3,354, with a daily range of approximately $3,345–$3,359. This places it firmly within its broader uptrend, showing resilience amid recent macro uncertainties and consolidating its position above key support zones.
2. Four-Hour Technical Breakdown
Trend & Structure
The 4-hour chart reveals a strong bullish structure, marked by consistent higher highs and lows. A recent Break of Structure occurred near $3,324, reinforcing the upward bias. A minor Change of Character around $3,360–$3,358 reflects a healthy retracement, but the bigger picture remains strong.
Key SMC & ICT Zones
Supply Zone: $3,360–$3,362 — recent peak area likely to attract sellers and sweep above liquidity.
Demand Zone: $3,340–$3,344 — aligns perfectly with the 38.2% Fib from the $3,308–$3,362 swing, forming a prime area to buy from.
Order Block / FVG Zone: $3,336–$3,342 — open imbalance suggesting price may revisit for efficient entry.
Liquidity Context: Order flow patterns indicate stop hunts around established zones — part of classic Smart Money Concepts.
Fibonacci Levels
38.2% retrace at $3,340, offering medium-term confluence support.
Upside projections via Fibonacci:
1.272 extension: $3,378
1.618 extension: $3,389
3. One-Hour Intraday Trading Setups
Aligned with the 4-hour bullish bias, these setups offer scalable, structured entry opportunities.
Strategy Entry Zone Stop-Loss Take-Profit Risk:Reward
Aggressive Long $3,344 $3,338 $3,358 → $3,362 ~2:1
Conservative Long $3,340 $3,330 $3,362 → $3,378 ~2.5:1
Short Opportunity Rejection @ $3,362 $3,368 $3,344 ~2:1
🌟 The Golden Setup
Buy within $3,340–$3,344 (4H demand + Fib zone + FVG)
Stop-Loss: $3,330
Take-Profit 1: $3,362 (range high)
Take-Profit 2: $3,378 (Fib 1.272)
Why It Works: A confluence of structural support, liquidity zones, and retracement levels gives this setup high predictive quality.
4. Analyst Consensus Snapshot
Market commentary from professional analysts shows alignment with dip-buy strategies. Most recognize the $3,340 region as key support and express caution entering $3,360–$3,375 resistance. Weekly forecasts describe tight trading with potential for breakouts or retracements depending on economic data and Fed commentary, but the medium-term trend remains bullish.
5. Summary & Trading Blueprint
Price Range: $3,345–$3,359 (daily); $3,338–$3,378 (targets)
4-Hour Bias: Bullish, with defined demand and supply zones
Golden Trade: Buy $3,340–3,344 → SL $3,330 → TP1 $3,362 / TP2 $3,378
Catalysts to Watch: Federal Reserve speech, tariff developments, USD movements.
6. Final Thoughts
Gold continues to demonstrate bullish resilience, supported by both technical structure and macro tailwinds. The $3,340–3,344 zone offers a clear, high-probability entry confluence, while stop placement and profit targets are well-defined. Profit management around $3,360 ensures disciplined scaling or early exits if risk factors emerge.
By blending price action, Smart Money frameworks, ICT concepts, and Fibonacci confluence—all structured into actionable trade setups—you have a professional-grade playbook ready for deployment.

Gold will make a Low for the Week before Pushing BullishOn my previous Update I mention that we should have support off this H4 Gap. My problem with it s it immediately reacted to it when the market opened back up. well before the killzone. So I feel like this is a fake out to go short for now. they will make a low for the week then we will see it set up for the bullish move.
