Gold Longlooking to the upside on Gold from Asia lows. This is a prelim entry (forecast) need to seek bullish PA around the FVG if we get a pull back. If a pull back does not form we will wait for a break and RT above 3,352 and plan entries accordingly.
Gold

Gold Outlook: Sharp Breakout or Pullback Ahead?Despite heightened geopolitical tensions alongside a weak US Dollar, gold's price action remains in pullback mode below the $3,400 level, awaiting a catalyst.
Technically, gold remains at the upper boundary of a long-term ascending channel, anchored by the 2016 and 2020 highs. It also sits just beneath the projected breakout zone of a large cup-and-handle pattern, with a potential target near $4,000.
If gold manages a firm close above $3,500 and clears the upper boundary of the channel, bullish momentum could lift prices toward $3,700, and possibly $4,000, during the second half of 2025.
Conversely, sustained weakness below the $3,300 level would open the door to near-term support zones at $3,290, $3,240, $3,100, and $2,800, which may offer "buy-the-dip" opportunities along its primary uptrend.
- Razan Hilal, CMT

Gold Trading Strategy June 19Yesterday's D1 candle confirmed the Sell side after the FOMC announcement. Today's Asian session had a push but the European and American sessions are likely to sell again.
3366 will be an important breakout zone today, if broken through, the Sell side will continue to be strong and push the price deeper and limit buying when breaking this 3366 zone. 3344 is the first target, it is difficult for gold to break this zone but if it breaks right away, wait below 3296 to BUY for safety. Before that, pay attention to another support zone 3322.
3400 is the Breakout border zone from yesterday to today but gold has not broken it yet. To SELL this zone, you must also wait for the confirmation of the candle, but if you want to wait for a better SELL, you must wait for 3415 or wait at the ATH peak 3443. However, if it breaks 3400, waiting for a Buy test will be quite nice.
Support: 3343-3322-3296
Resistance: 3415-3443
Break out zone: 3366-3400

GOLD H1 Intraday Chart Update For 20 JUNE 25Hello Traders we are now at closing day of the week, for today market expected is in tight range and better to wait for closing of the week
strong resistance for the day is 3382 level while strong support for the day is 3333
scalping range for today is 3340-3375
Disclaimer: Forex is Risky

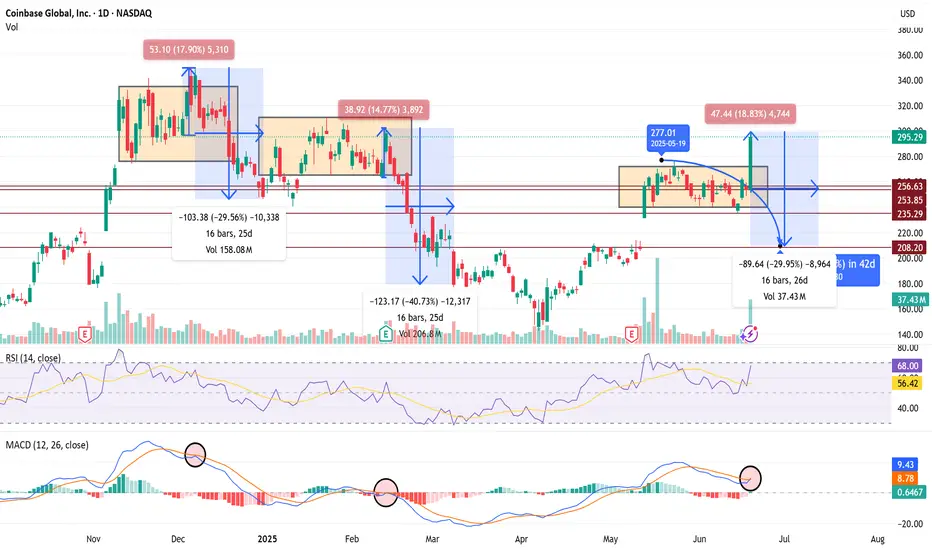
$COIN 30% Pullback Confirms if we Fakeout Recent 15%+ Rally 🧨 COIN SHORT TRADE IDEA — FAKEOUT TRAP IN PLAY
Ticker: NASDAQ:COIN
Date: June 20, 2025
Thesis: Breakout trap setup — expecting a rug pull / red reversal tomorrow to confirm.
🔍 Context
Price broke above range today with a big +18.8% candle to $295 — but...
Volume spike may signal exhaustion, not strength.
RSI = 68 → near overbought
MACD curling into a bearish cross — same signal preceded the last -30% and -40% drawdowns.
History: Same range-break setups in Dec and Feb collapsed hard (-30 to -40%) over 16–25 days.
💣 Trade Plan (Short Setup)
Entry Trigger:
🔻 Enter short if price closes below $277 tomorrow — confirms breakout trap.
Targets:
🎯 Target 1: $253 (top of old range)
🎯 Target 2: $235 (mid-range support)
🎯 Target 3: $208 (full breakdown move, matches last 2 cycles)
Stop Loss:
🛑 Above $297 (breakout highs)
Timeframe:
1–3 weeks (16–26 bars historically)
🧠 Bias
Bearish unless bulls hold $280+. If we get a big red daily candle tomorrow, fakeout confirmed — high-probability follow-through expected.
Could the Gold bounce from here?The price is falling towards the pivot which acts as a pullback support and could bounce from this level to the 1st resistance which is also a pullback resistance.
Pivot: 3,337.35
1st Support: 3,294.91
1st Resistance: 3,413.32
Risk Warning:
Trading Forex and CFDs carries a high level of risk to your capital and you should only trade with money you can afford to lose. Trading Forex and CFDs may not be suitable for all investors, so please ensure that you fully understand the risks involved and seek independent advice if necessary.
Disclaimer:
The above opinions given constitute general market commentary, and do not constitute the opinion or advice of IC Markets or any form of personal or investment advice.
Any opinions, news, research, analyses, prices, other information, or links to third-party sites contained on this website are provided on an "as-is" basis, are intended only to be informative, is not an advice nor a recommendation, nor research, or a record of our trading prices, or an offer of, or solicitation for a transaction in any financial instrument and thus should not be treated as such. The information provided does not involve any specific investment objectives, financial situation and needs of any specific person who may receive it. Please be aware, that past performance is not a reliable indicator of future performance and/or results. Past Performance or Forward-looking scenarios based upon the reasonable beliefs of the third-party provider are not a guarantee of future performance. Actual results may differ materially from those anticipated in forward-looking or past performance statements. IC Markets makes no representation or warranty and assumes no liability as to the accuracy or completeness of the information provided, nor any loss arising from any investment based on a recommendation, forecast or any information supplied by any third-party.

XAUUSD M15 I Bearish Reversal Based on the M15chart, the price is approaching our sell entry level at 3361.93, a pullback resistance that aligns with the 50% Fib retracement.
Our take profit is set at 3342.62, an overlap support.
The stop loss is set at 3379.02, a swing high resistance.
High Risk Investment Warning
Trading Forex/CFDs on margin carries a high level of risk and may not be suitable for all investors. Leverage can work against you.
Stratos Markets Limited (tradu.com ):
CFDs are complex instruments and come with a high risk of losing money rapidly due to leverage. 63% of retail investor accounts lose money when trading CFDs with this provider. You should consider whether you understand how CFDs work and whether you can afford to take the high risk of losing your money.
Stratos Europe Ltd (tradu.com ):
CFDs are complex instruments and come with a high risk of losing money rapidly due to leverage. 63% of retail investor accounts lose money when trading CFDs with this provider. You should consider whether you understand how CFDs work and whether you can afford to take the high risk of losing your money.
Stratos Global LLC (tradu.com ):
Losses can exceed deposits.
Please be advised that the information presented on TradingView is provided to Tradu (‘Company’, ‘we’) by a third-party provider (‘TFA Global Pte Ltd’). Please be reminded that you are solely responsible for the trading decisions on your account. There is a very high degree of risk involved in trading. Any information and/or content is intended entirely for research, educational and informational purposes only and does not constitute investment or consultation advice or investment strategy. The information is not tailored to the investment needs of any specific person and therefore does not involve a consideration of any of the investment objectives, financial situation or needs of any viewer that may receive it. Kindly also note that past performance is not a reliable indicator of future results. Actual results may differ materially from those anticipated in forward-looking or past performance statements. We assume no liability as to the accuracy or completeness of any of the information and/or content provided herein and the Company cannot be held responsible for any omission, mistake nor for any loss or damage including without limitation to any loss of profit which may arise from reliance on any information supplied by TFA Global Pte Ltd.
The speaker(s) is neither an employee, agent nor representative of Tradu and is therefore acting independently. The opinions given are their own, constitute general market commentary, and do not constitute the opinion or advice of Tradu or any form of personal or investment advice. Tradu neither endorses nor guarantees offerings of third-party speakers, nor is Tradu responsible for the content, veracity or opinions of third-party speakers, presenters or participants.

GOLD - 1H TFHere are the 2 zones I'll be looking to add additional entries. Waiting for Wave 2 completion & a push up.
Zone 1 - Current CMP
Zone 2 - $3,338 - $3,332
Could even look for 'sell to buy' trades, depending on your risk appetite and risk management.

Holiday yesterday so no play! can we get it today?As we get ready to close out the week we are looking for the reversal to play out. We have been in a casual consolidation all week. Just looking for price to step outside of value one more time so that we can get a entry for it to continue pushing bullish.

XAUUSD Daily Sniper Plan – June 20, 2025🧭 Market Context
Following FOMC volatility and a Wednesday bullish reaction off 3351, XAUUSD is now hovering near 3370. The structure remains compressed between a flat EMA cluster and a key supply zone above. Thursday may bring low-to-moderate volatility early on, but watch for reaction after Philly Fed Manufacturing and CB Leading Index data during NY. Also, stay alert for a tentative Fed Monetary Policy Report release that may trigger later-session volatility.
🔍 Structural Overview
Daily Bias: Neutral-to-Bullish
H4 Trend: Still respecting higher lows but price is trapped under dynamic resistance
H1–M15: Consolidation between 3351 demand and 3388 supply
RSI: Mixed; compression between 47–55
EMA Flow: Flat on M30/H1; slight compression building for breakout
Liquidity Pools:
Resting buy-side above 3388
Resting sell-side below 3351 and deeper toward 3340
📍 Key Zones to Watch
🔵 BUY ZONE #1 – 3345–3352
🔹 Demand zone | Previous NY reversal base
🔹 M15 OB + EQ zone + liquidity sweep
🔹 Below full EMA stack → oversold entry if NY flushes pre-news
🔵 BUY ZONE #2 – 3328–3340
🔹 Deeper HTF demand + RSI oversold potential
🔹 Bullish CHoCH reaction zone from last week
🔹 High RR for recovery play if price collapses during NY news
🔴 SELL ZONE #1 – 3384–3395
🔸 Rejected on FOMC wicks
🔸 Key supply zone + EMA200 (M30/H1)
🔸 Fakeout zone → valid if price spikes before NY volatility
🔴 SELL ZONE #2 – 3405–3415
🔸 Secondary high liquidity trap
🔸 Last bullish FVG inefficiency
🔸 To be used only in case of irrational spikes post-data
🟠 FLIP ZONE – 3368–3375
🔸 Compression zone + recent CHoCH
🔸 EMA50 (M15–H1) aligning
🔸 Watch for breakout and real volume entry → flip zone into continuation
📌 Note:
Tomorrow’s news events:
Philly Fed Manufacturing Index
CB Leading Index m/m
Fed Monetary Policy Report (Tentative)
This could bring range plays early and a directional break later. Stay patient and wait for confirmation inside zones. Flip zone is ideal for quick scalps if volume picks up.
🔥 Stay sharp and don’t force trades in pre-news chop. Clean zones only.
Tag us if you’re using the plan, and don’t forget:
🧠 Think in structure. Enter in precision.
– GoldFxMinds
🟢 Disclosure: I am part of TradeNation's Influencer program and receive a monthly fee for using their TradingView charts in my analyses and educational articles.

E mini Nasdaq 100. 20.06.2025, Thursday [Day after FOMC]Clean delivery after FOMC. Massive meltdown on NQ.

Gold SetupHi everyone
We haven't posted in a while but still been trading actively.
We have a bias thag gold will fall to around 3342.50 area then bounce towards 3405-3420 area.
Lets monitor market movement before entering

Gold XAUUSD Move 18 June 2025Don't buy/sell this messy gold setup unless there's a clear, confirmed, and clean break— either above 3395 or below 3375.
Too many wicks = too much uncertainty and manipulation.
Investors clearly have no conviction right now.
👉 Wait for a solid candle close above 3395 for longs, or below 3375 for shorts.
Anything in between is just noise — stay out and stay safe.

Gold Hits PRZ with RD-! Time for Bears to Take Over?Gold ( OANDA:XAUUSD ) attacked the Resistance zone ($3,445-$3,406) once again, forming an Ending Diagonal at the top of the structure.
Although price reached the Potential Reversal Zone (PRZ) , the presence of Regular Divergence (RD-) between the last two peaks could indicate the weakening of bullish momentum .
In terms of Elliott Wave theory , we can clearly count a completed 5-wave structure , with an Ending Diagonal pattern . This supports the idea of a major correction starting soon .
I expect Gold to attack the lower lines of Ending Diagonal , and if it breaks, it could drop to at least $3,333 . The Second Target could be the Support zone ($3,451-$3,120) .
Do you think Gold will make a new All-Time High(ATH) again in this rally?!
Note: Stop Loss (SL) = $3,463
Gold Analyze (XAUUSD), 2-hour time frame.
Be sure to follow the updated ideas.
Do not forget to put a Stop loss for your positions (For every position you want to open).
Please follow your strategy; this is just my idea, and I will gladly see your ideas in this post.
Please do not forget the ✅ ' like ' ✅ button 🙏😊 & Share it with your friends; thanks, and Trade safe.

GOLD ROUTE MAP UPDATEHey Everyone,
Once again our levels deliver the magic!!
Yesterdays update, we stated that we got the move into 3393 just like we analysed for the first level of swing and that we will now look for ema5 to cross and lock 3372 or 3393 to confirm direction.
🔄 Update:
No ema5 lock above 3393 confirmed the rejection into 3372 followed with ema5 cross and lock opening the full swing range test into 3353. We got the test and the perfect bounce back into 3372. A move into 3393 will complete the full swing range.
We will keep the above in mind when taking buys from dips. Our updated levels and weighted levels will allow us to track the movement down and then catch bounces up.
We will continue to buy dips using our support levels, taking 20 to 40 pips. As stated before, each of our level structures gives 20 to 40 pip bounces, which is enough for a nice entry and exit. If you back-test the levels we shared every week for the past 24 months, you can see how effectively they were used to trade with or against short/mid-term swings and trends.
🌀 The swing ranges give bigger bounces than our weighted levels - that's the difference between the two.
BULLISH TARGET
3440 - DONE
EMA5 CROSS AND LOCK ABOVE 3340 WILL OPEN THE FOLLOWING BULLISH TARGETS
3463
EMA5 CROSS AND LOCK ABOVE 3463 WILL OPEN THE FOLLOWING BULLISH TARGET
3483
EMA5 CROSS AND LOCK ABOVE 3483 WILL OPEN THE FOLLOWING BULLISH TARGET
3508
BEARISH TARGETS
3418 -DONE
EMA5 CROSS AND LOCK BELOW 3418 WILL OPEN THE FOLLOWING BEARISH TARGET
3393 - DONE
EMA5 CROSS AND LOCK BELOW 3393 WILL OPEN THE SWING RANGE
3372 - DONE
3353 - DONE
EMA5 CROSS AND LOCK BELOW 3353 WILL OPEN THE SECONDARY SWING RANGE
3330
3306
As always, we will keep you all updated with regular updates throughout the week and how we manage the active ideas and setups. Thank you all for your likes, comments and follows, we really appreciate it!
Mr Gold
GoldViewFX

The market is closed today. How to arrange gold in the evening?📰 Impact of news:
1. The interest rate remains unchanged and leads to new lows in the short term
2. Geopolitical tensions provide support for risk aversion
📈 Market analysis:
The market is expected to not fluctuate much today. Generally speaking, it is difficult to stand on one foot to form a short-term bottom. There should be a second wave of bottom exploration, a secondary low point, and then the bottom is explored and pulled up to break through the previous high point. Only then can the turning point be officially established and the decline end. Moreover, the 1H moving average is spreading downward. Therefore, in the short term, we still pay attention to the 3375-3385 line of resistance and the 3360-3355 line of support below.
🏅 Trading strategies:
SELL 3375-3385
TP 3365-3360-3355
BUY 3360-3355
TP 3370-3380-3405-3420
If you agree with this view, or have a better idea, please leave a message in the comment area. I look forward to hearing different voices.
TVC:GOLD FXOPEN:XAUUSD FOREXCOM:XAUUSD FX:XAUUSD OANDA:XAUUSD

GOLD - WAVE 5 BULLISH TO $3,622 (UPDATE)Like I said on the last update, Gold is currently going through a strong 'accumulation' phase for buyers, hence why we're seeing these choppy price actions, trying to liquidate buyers.
As long as Gold is ABOVE THE WAVE 2 LOW, market structure still favours buyers. Breaking below this low, will invalidate bullish structure.
Wave 2 Invalidation Level - $3,245❌

GOLD: Strong Bearish Sentiment! Short!
My dear friends,
Today we will analyse GOLD together☺️
The price is near a wide key level
and the pair is approaching a significant decision level of 3,368.04 Therefore, a strong bearish reaction here could determine the next move down.We will watch for a confirmation candle, and then target the next key level of 3,359.44..Recommend Stop-loss is beyond the current level.
❤️Sending you lots of Love and Hugs❤️

GOLD My Opinion! BUY!
My dear friends,
Please, find my technical outlook for GOLD below:
The price is coiling around a solid key level - 3367.9
Bias - Bullish
Technical Indicators: Pivot Points Low anticipates a potential price reversal.
Super trend shows a clear buy, giving a perfect indicators' convergence.
Goal - 3379.6
Safe Stop Loss - 3360.8
About Used Indicators:
The pivot point itself is simply the average of the high, low and closing prices from the previous trading day.
Disclosure: I am part of Trade Nation's Influencer program and receive a monthly fee for using their TradingView charts in my analysis.
———————————
WISH YOU ALL LUCK

SPY/QQQ Plan Your Trade For 6-19: GAP Reversal Counter TrendToday's pattern is a GAP Reversal in Counter Trend mode. I believe this could represent a breakdown in the ES/NQ as the US stock market is closed for the Juneteenth holiday.
Obviously, after the Fed comments yesterday (stating "uncertainty") and with the continued Israel/Iran conflict playing out, it makes sense to me that the US markets would move into a pre-weekend consolidation phase.
Even though the US stock market will be closed, the futures market will likely stay open and will carry some general market sentiment and reactions to news.
Watching Gold/Silver and Bitcoin should be very interesting today. I suspect the markets will continue to consolidate downward today - leading to a potential breakdown seeking support day on Friday.
Buckle up. We'll likely have 3-5+ days of news related to the Israel/Iran conflict and other issues over this weekend. It could be very interesting to see how the global markets move through this news.
Get some.
Happy Juneteenth
#trading #research #investing #tradingalgos #tradingsignals #cycles #fibonacci #elliotwave #modelingsystems #stocks #bitcoin #btcusd #cryptos #spy #gold #nq #investing #trading #spytrading #spymarket #tradingmarket #stockmarket #silver

DeGRAM | GOLD aim to test the lower boundary📊 Technical Analysis
● Hourly price is defending the channel’s lower half: three consecutive wicks bounced at 3 360, forming a descending flag whose base coincides with the dynamic support.
● OBV is edging higher while the flag narrows; a close above 3 408 would unlock the flag-measured move toward the upper rail / horizontal target at 3 444–3 450.
💡 Fundamental Analysis
● World Gold Council reports India’s jewellery demand rebounded 8 % w/w as monsoon concerns eased, while CME data show fresh 6 K-lot COMEX short-covering after the latest FOMC testimony tempered rate-hike talk.
✨ Summary
Long 3 360–3 380; flag break > 3 408 eyes 3 444 → 3 450. Bull view void on an H1 close below 3 343.
-------------------
Share your opinion in the comments and support the idea with a like. Thanks for your support!

XAUUSD: Market Analysis and Strategy for June 19Gold technical analysis
Daily chart resistance 3450, support below 3338
Four-hour chart resistance 3400, support below 3338
One-hour chart resistance 3375, support below 3350
Fundamentally, the geopolitical situation has eased. The market was affected by the Fed's decision this week to keep interest rates unchanged and not cut interest rates, which weakened the bullish momentum and buyers took profits, leading to a decline.
From the current trend analysis, the support below focuses on the four-hour level 3338 and the one-hour level 3350 support. The upper pressure focuses on the suppression near the daily level 3450, and the short-term long-short strength and weakness dividing line 3400. Keep the high-selling and low-buying range operation during the day.
Sell: 3375near SL: 3380
Sell: 3350near SL: 3355
Buy: 3338near SL: 3333

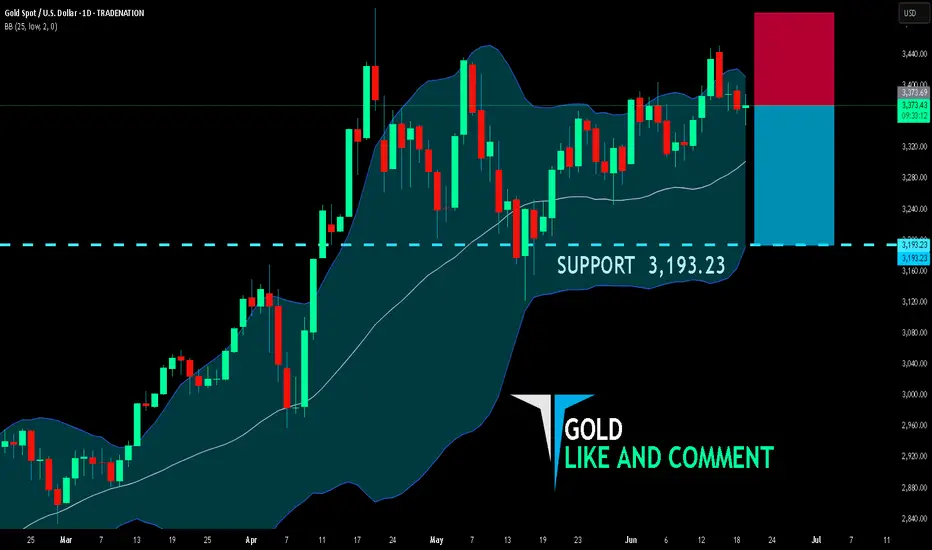
GOLD BEARISH BIAS RIGHT NOW| SHORT
GOLD SIGNAL
Trade Direction: short
Entry Level: 3,373.69
Target Level: 3,193.23
Stop Loss: 3,493.66
RISK PROFILE
Risk level: medium
Suggested risk: 1%
Timeframe: 1D
Disclosure: I am part of Trade Nation's Influencer program and receive a monthly fee for using their TradingView charts in my analysis.
✅LIKE AND COMMENT MY IDEAS✅