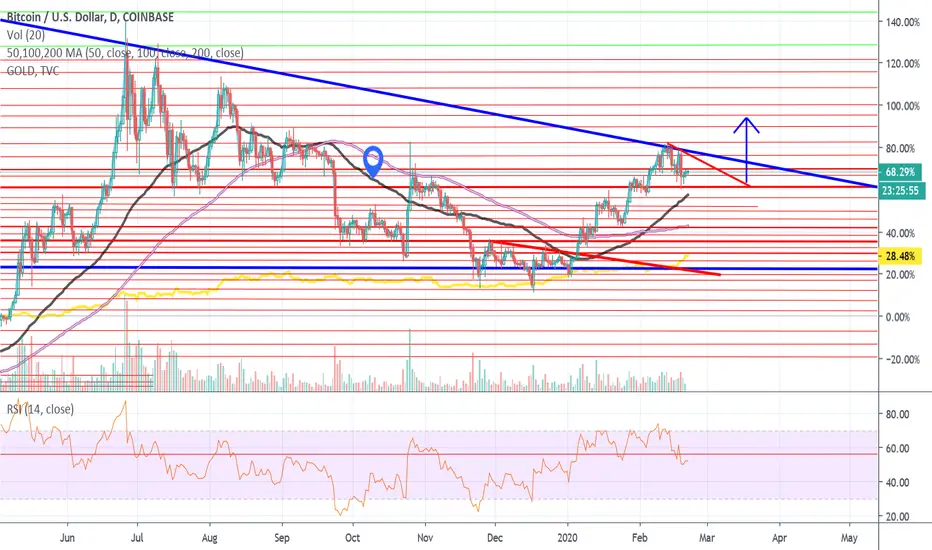
Gold - Bitcoin Close to a Vital Ray. Volatility Alert.Gold, in terms of Bitcoin, is getting close to an important ray that crosses through the two significant tops.
Should we expect a strong reaction?
If we take a look at the third rejection from the bottom, we can see that it was able to get below the bottom ray but quickly reversed upward. So, we should definitely expect a strong reaction to the upper ray. Especially, as the BTCUSD price was reject at the linear ray that connected the last two bull peaks, this should be treated as seriously.
The 1 day EMA400 is above the MA400, which means that price is likely to rise to hit it, although it has entered the KC (Keltner Channels/EMA Bands), so I wouldn't count on the EMA400 being hit.
Saying that, it will act as resistance at about the same place as the upper ray.
What should we expect?
If gold breaks the upper ray, then we could be in for a very significant rise in price (BTC).
If gold is rejected, then we should expect a decision on direction by the start of August at the latest. If it takes that long, then we should expect to see gold drop to about 0.0248BTC.
We can look for clues in the RSI, depending on which way it breaks out. On the weekly chart, the RSI peaked at 65, not yet in overbought territory.
What to do?
As gold, and charts in general, do not offer a BTC pairing yet (with the exception of tethered gold on a crypto exchange), you'll have to use this chart as a guide and watch both Gold and BTC priced in something like USD or, the oldest currency still in use, GBP.
Gold has been up for a significant amount of time , is overbought and recently hit a Fibonacci Retracement level when priced in USD. If gold cools off and Bitcoin rises then the lower ray won't take long to encounter.
Gold in BTC could pump very up very high and reverse. This would seem likely caused by BTC crashing in that scenario, however, Bitcoin might be entering a bear market. I suspect it will either be very short or very long, based on the 6M and 12M RSI.
Main takeaways:
The gold and bitcoin markets are about to get very volatile, so take caution/avoid high or any leverage.
Use the GOLDUSD chart and change the currency to BTC for clues on direction in the coming days or weeks.
This could lead to a long term direction, but unfortunately, you cannot add alerts to a chart with an altered pairing, so perhaps use the PAXGBTC chart and add alerts there.
[*}BTCUSD hit the 1 day MA/EMA400 at the bottom and is getting close on this chart. I suggest adding BB400 (at various SDs) and KC400 to your charts, even if you use BB20.
You might want to use HLC Area instead of candles/bars as price appears to jump around willy-nilly else.
When you find a chart difficult to read, try swapping to BTC for more clues. If the chart is Tesla, then you might even want to try Dogecoin!
In addition to these charts, the BTC Dominance chart shows that BTC has hit the same pitchfork line that it hit when the first alt season began! So, I expect a strong move there too.
So, if BTC does rise then we might get an alt season very soon.
This is my first Idea that I've published, so please forgive any mistakes, omissions or poor formatting. I am open to critical feedback.
I just wanted to put this out there as I haven't seen anyone cover this online. If you have or know of related ideas, then please
share, as I am always interested in finding ways to predict major market moves.
Goldbtc

The similarity between BTC and Gold will shock youWelcome all
I checked the GOLD chart after hitting new ATH recently and I found big similarities with BTC
both assets formed :
1- Accumulation phase
2- Stoploss hunt phase
3- And finally, GOLD made the uptrend phase and printed new ATH
historically BTC has followed GOLD several times before (why not? it's the digital GOLD)
if we followed the pattern of GOLD then BTC now should be on its way for achieving new ATH!
DO U AGREE?
If you enjoyed our style in trading and analysis, support our ideas by likes and comments

BTC vs VirtualGold- Did you ever notice that BTC and PaxGold/BTC have a perpetual inverted correlation ?
- All Pax Gold tokens are backed 1:1 by ounces of London Good Delivery bars held in Brink's vaults.
- Allocated gold-backed PAX Gold tokens are protected both in the vault facilities and in transit. Availability of FDIC Insurance for Stablecoin Reserves.
- PaxGold acts as store of value when BTC dip.
- Some Whales don't like to switch their BTC to stable coins.
- So they just turn on PaxGold when BTC crash.
- This also can be a good alternative if you don't use too heavy Leverage.
- Keep 50% in BTC.
- Keep 50% in PaxGold.
- if you are fast enough, you could find a way to make some bucks.
PS : Don't forget that this analyze is 100% paired with BTC.
Happy Tr4Ding !

Gold vs BTC, which one will make the next move? XAUBTC is one of my favorite indicators to decide if bitcoin's big crash or big pump is over! The rivalry between GOLD and BTC is worth watching and being careful about.
It seems that bitcoin will suffer a little more depreciation against gold and will lose more value until it reaches the next resistance zone, I mean between 0.1 to 0.11. After the touch and a few days of range on the area, either the red or the green scenario is going to happen and it's too soon to talk about it. But in the case of the green scenario which leads BTC to gain value against gold, I'm expecting a sharp reject because there is no obstacle to reaching 0.06 on the chart and it means a nice pump for the bitcoin.
DO YOUR OWN ANALYSIS.
DO NOT FORGET MONEY MANAGEMENT.

PAX Gold/BTC Bump and run PAX Gold/BTC Pair on the move
Pax Gold/BTC is in a bump and run pattern, targets highlighted on the chart

BITCOIN DURING AND AFTER HUGE RECESSION... JUST WATCH!!!!BTC LAST LOWEST PRICE COMING THEN, TO THE M.OOO.OOO.OOO.OOO,OO.N!!!

Did a bit of ETH to BTC conversion on the Run Up in ETH priceNoticing that the trend has started to reverse, not so sure about converting BTC back to ETH unless ETH corrects very hard...like below 1K again, which might be in the card over the weekend...Why the dump...don't care...probably has something to do with Real Interest Rates rising. Gold got clubbed like a baby seal early in European session, so I guess Gold is now a bit of a leading indicator for crypto...Interesting, will have to make use of this knowledge in the future if the correlation holds up.

GOLD BUY!!!! BRAINLESS BUY OPEN YOUR EYES!!!BUY BUY BUY BUY BUY
COMMENT FOLLOZ LIKE
HAPPY TRADING!!!!!!!!

Crypto mania took gold loss in 2017 and 2020Idea for trying to find / timing eventual gold bottom around here
past crypto euphoria, gold lost 4.83% (btc 10k to 20k)
2020, gold already lost much more
after crypto many, gold had a nice bull setup before more lows
so gold bottom, impossible to determine, should be not far
Not investment advise, trade your own plan.

Gold continuous depreciation vs BitcoinWe have solid structural weekly downtrend developing.
Targeting 0.01 BTC for each ounce of Gold but overall prospect is to go even further lower.

GOLD/BTCIt is interesting to see the relation between Gold and BTC, It has room to go down pulling BTC up.. Also, if we have a reversal BTC could goes down with no much obstacles
What do you think?


Crypto.com vs Bitcoin and GoldJust more proof that Crypto.com is making huge strides; this shows CRO (red and teal), MCO (green) BTC (white) and Gold (yellow) in dollars since the pandemic and resulting market meltdown. (I'm a newb, take this for what it is, an ADD-borne musing xD).


Gold to fall another $100-$150+ bearish wave patterndetails on chart, please see 4hr chart I posted. Shorting at the top of the channel, that is a rising wedge. I'm not buying the top

GOLD / BTCLog chart is interesting. BTC may have better times from now on. Until July end, it will be crucial. If GOLD/BTC reduces, it means BTC's price increases.

GOLD/BTCLog chart is interesting. BTC may have better times from now on. Until July end, it will be crucial. If GOLD/BTC reduces, it means BTC's price increases.

Is Bitcoin trading in a Bul Flag?Or potentially a descending triangle, Bitcoin is being met with resistance that I have colored blue which is a downward sloping trendline since the blow off top of late 2017, and the other blue line is strong support dating back to 2017 & more recently it's acted as a Micro bottom multiple times. Bitcoin is still trading above the 200 Day MA & with the halving approaching it's very possible this plays out bullishly, only time will tell. One thing to keep in mind is that Bitcoin wasn't nearly as liquid for the previous halvings, now with the CME futures & Bakkt etc etc now in play it's important to be aware of a potential sell off.
Hyperinflation is real, and it can happen to the United States & Canada, if you think otherwise you are gullible & don't know your history.
Bitcoin, Ethereum & decentralized p2p electronic transfer of value is not only the future, it's the present answer to such a scenario. Along with some other traditional assets like gold & silver.
Zimbabwe,Turkey, Iran & Venezuela have all been experiencing Hyperinflation recently.
Do you know the last time Zimbabwe had a Hyperinflationary period?
March 2007 - November 2008, History repeats itself.
This is the same time the most recent financial crisis took place, resulting in Bitcoins whitepaper being released by Satoshi Nakamoto.
A major historical precursor of hyperinflation is war that destroys the capital stock of an economy and dramatically reduces output, but the misplaced monetary and fiscal policies that ensue are almost always part of the story.
Even some of the largest economies in the world today; China, Germany, and France have suffered devastating hyperinflationary episodes.
Hyperinflationary episodes have appeared several times over the past century, around 60 times to be more exact, as the world's nations have experimented with fiat currencies backed by the full faith and credit of the governments that issue them.
At times, that full faith and credit has been misplaced and holders of unstable currencies have been caught empty-handed in countries all over the world.
In regards to Gold, I'm not sure if people understand this, some say Gold is a store of value & I agree, kinda....
It depends on what you consider a "store of value."
Because technically, since Aug 2011 Gold has been in a bear trend, and it appears as though its made a double top, unless Gold creates a new all time high with the more recent bullish activity.
Gold went as high as $2,172.26 USD in January of 1980, and dropped nearly 75% afterwards & went into a 21 YEAR BEAR MARKET. Nice STORE OF VALUE!
Bitcoin on the other hand has much faster boom & bust cycles.
Gold went from $678 USD in Feb 1934 to $236 by Dec 1970, over a 50% decline & a 36 year bear market until the price recovered increasing 10x in 10 years from 1970 to 1980's.
I wouldn't be surprised if Bitcoin retested it's 2017 ATH before Gold retests its January 1980 ATH!
Bitcoin has provided greater returns since 2015 than owning an ounce of Gold at spot price since 1975, even after Bitcoin has fallen from recent All Time Highs.
This trend will continue, Bitcoin & crypto related assets can be part of your portfolio, even if its only 5%.
Gold is the yellow line.