| Gold | And Gold Alone : Buy The Best | Accept No Substitute | | Gold | And Gold Alone : Buy The Best | Accept No Substitution |
Gold
Accept No Substitute.
Never fall into the "Catch-Up Game Trap."
Silver is presently such a Trap.
Gold will continue to Outperform Silver
Don't let a Dealer convince you otherwise
Buy Strength, Sell Weakness
Buy The Best, Winner takes all
Gold / > United States Dollar
Gold / > US Dollar Index
Gold / > Swiss Franc
Gold / > Great British Pound
Gold / > Euro
Gold / > Japanese Yen
Gold / > Bitcoin
Gold / > Silver
Bitcoin / < Gold
Bitcoin Total Market Cap / < Gold
Silver / < Gold
Pro Tip : Rarely a good bet, if your Broker is paying carry for you to hold it.
It's in the Detail
🌟
Goldbull

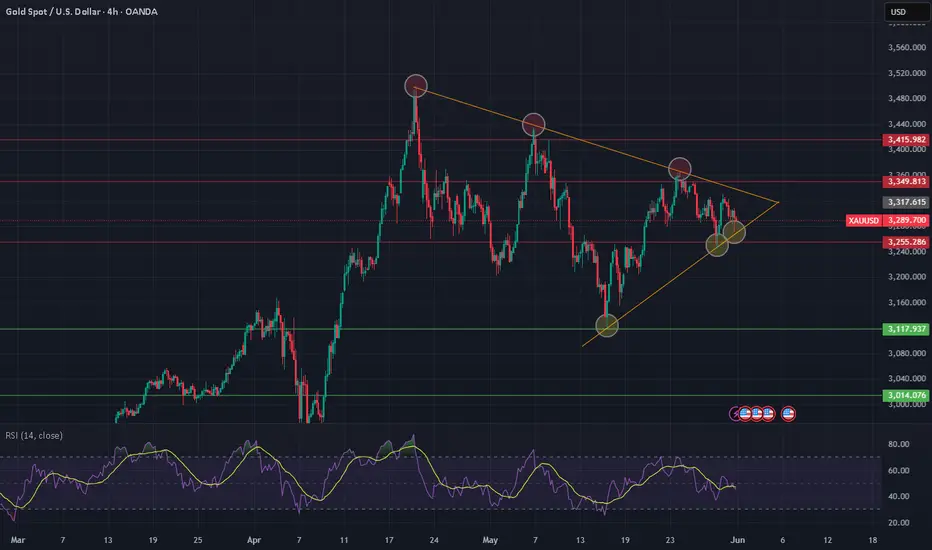
XAU/USD (Gold) – Symmetrical Triangle Setup | Breakout Imminent🔶 Chart: 4H timeframe
🔶 Pattern: Symmetrical Triangle
Gold is currently consolidating within a well-defined symmetrical triangle on the 4H chart, marked by a series of lower highs and higher lows — a classic setup indicating a potential breakout is near.
🔍 Technical Breakdown:
✅ Price has respected both trendlines multiple times, confirming the structure.
✅ The apex is approaching, suggesting volatility and a directional move are imminent.
✅ Volume is compressing, aligning with typical breakout behavior.
🧭 Bias: Neutral – Wait for Confirmation
We’re at a decision point. Don’t front-run the move — wait for a clean 4H candle close outside the triangle with volume confirmation. Whichever side breaks, the follow-through could be sharp.
Set alerts at Above and Below triangle to catch the move in real time.
XAUUSD Strong Bullish Momentum1. Trend
Uptrend: The price is trending upwards within the ascending channel, with higher highs and higher lows, indicating a bullish market sentiment.
2. Support and Resistance
Support: The lower boundary of the channel acts as dynamic support, where price has bounced multiple times. If the price continues to move within this channel, it may find support around the 2,680-2,700 USD range.
Resistance: The upper boundary of the channel acts as resistance. If the price reaches this level, it could face resistance near 2,750-2,760 USD in the near term.
3. Price Action
Bearish Candle: The recent candle shows a significant drop (-1.11%), indicating bearish pressure. The price is testing the lower channel boundary, which could be a critical support zone.
Potential Reversal: There seems to be a projection for a bullish bounce off the lower boundary, suggesting a possible upward move back towards the mid-to-upper range of the channel, as shown by the zigzag projection on the chart.
4. Projections
Bullish Scenario: If the price holds at the lower boundary and rebounds, it could aim for a move back towards the upper channel line, targeting around 2,760-2,780 USD.
Bearish Scenario: If the price breaks below the lower boundary of the channel, it could signal a shift in the trend, potentially targeting support levels below 2,680 USD.
5. Key Levels
Immediate Support: 2,700 USD (channel support)
Immediate Resistance: 2,750 USD (upper channel resistance)
Potential Targets: A bounce could aim for 2,760-2,780 USD, while a breakdown may push the price down to 2,660 USD or lower.
In summary, the XAU/USD pair is in an overall uptrend but is currently facing a pullback near channel support. The next few sessions are critical to see if the price respects the channel or breaks downwards. If the support holds, a bullish continuation is possible.

UPDATE: Gold almost VERTICAL! Target remains at $2,236Gold has been moving very nicely this year.
First it broke out of a MASSIVE Symmetrical Triangle that lasted an entire year of sideways movements.
Then it shot up, formed a W Formation and then just rallied up with a high inclination.
I'm talking over 60 degrees up. So, the momentum is strong (bubble style) but still strong. And the target remains at $2,236.
We could then get some consolidation and some steam off by SMart Money, before the buying saga continues.
I'm a raging gold bull!

Harmony prepping for potential upside - Wait for breakoutHarmony is one of the laggards with Gold.
While it is moving in a sideways consolidation range, we are waiting for a confirmed breakout.
Once it breaks above, we will definitely get long and hold with a strong Risk to Reward.
But right now patience is important, cause it could also fall South quickly.
In fact, if you draw a Rectangle formation instead of an Inv H &S, it means that whether it breaks down or up, it could provide a very decent trade signal.
My bias is up purely based on being a golden bull this year.

XAUUSD Bullish (11/26/2023 to 12/01/2023 prediction)Gold is bullish, from mostly the FED’s dovish stance and inflation reports from the week before last. We opened up this week around 2001 and had some large volume for Asian sessions pushing the price to 2018 before buyers took some profit. When writing this, the price is challenging the 2010 key level.
We have a lot of news this week, and keep in mind we are closing out the month. We have New home sales, pending home sales, housing price index, FED speakers, core personal consumption and also the price index, GDP numbers, Opec meetings, initial jobless claims, personal income, personal spending, and finally, a slew of ISM manufacturing reports. Most of the reports’ consensus is putting the dollar in bear territory as consumer numbers are lower than previous and manufacturing numbers are in negative territory. My personal opinion is that most of these numbers will come out negative, the question is by how much? This confirms Gold bulls will have momentum building as the week goes on. If a report comes out as expected, I don’t see too much movement. If the reports come out super positive, that will indicate that the FED may not have inflation under control, it will indicate that the dollar is strong, so bulls will enjoy that, and it will indicate that the sentiment for a FED pivot next year may gain some steam even though the FED said they will keep rates higher for longer. If the FED hints at cuts during the speeches, that will indicate that the US economy is in serious trouble and the FED’s plan may not be on track as we assume. It is an eventful week where many trade opportunities may present themselves.
The war tension is still in the air. Ukraine is begging for more handouts while the Russians sent another satellite into orbit. It is getting desperate for Ukraine, so it is only a matter of time before we may see some peace negotiations materialize. The Israel-Hamas war saw some great news over the weekend! We had a 4-day truce deal, which is meant to expire Monday the 27th of November, almost one month and three weeks since the triggering events of Oct 7. During the weekend, we saw 50 Israeli and 150 Palestinian captives released, which is a joy for all peace activists. We will see how long the truce lasts. As of right now, the biggest battle is with the diplomats and the media narrative. No new major movements on the Taiwan-China front.
Trade idea 1: Price pulls back to 1997 before continuing bullish to 2020. (All news events stay negative)
Trade idea 2: Price pulls back to 1988 before continuing bullish to 2020. (Some news events come out mixed)
Trade idea 3: Price pulls back to 1970 before continuing bullish to 2020. (Some news events come out higher than expected)

Gold broken above wedge new target $2,081Falling Wedge has formed on Gold since April 2023.
This has been a turn for the good.
We've seen the price breakout and now we can expect the demand to continue.
7=21>200 - Bullish
RSI >50 (Buy divergence with the level breaking the downtrend.
Target $2,081
This will reflect on gold companies too which we can be bullish on. Happy to go long here.

XAUUSD - KOG REPORT! (Weekly)In our last monthly chart update (linked below) we showed you the larger structure and the levels to look for. We mentioned that breaking above the 1835 will result in the price going to test the higher resistance levels and potentially the top of the trend. This level here is the last resistance level for bears to defend if this is to go anywhere below the 1835 level in the months ahead.
So now lets look at the weekly chart to get a longer term view of potential movement on Gold in the coming weeks/months. We can see the potential triangle which has broken to the upside with an engulfing candle and out of the range we had been trading in for the last couple of months. What we need to keep an eye on here is the next weekly candle, do we get another bullish candle closing above the support regions which have been illustrated on the chart? We have plotted in the weekly zones which show what you need to look for, breaks and close above or below levels! If we to speak technically on this chart then we would be looking for a 25-50% retracement on last weeks bullish candle, if we only get 25% or less there is still enough volume in the markets to drive this higher. In any case, most scenarios of trend and level breaks entail some form of retest. So are levels below here are 1850 which is a psychological level and below that the 1830-35 price region which we have said on numerous occasions has been used to propel the price in either direction.
Below is the monthly chart we have been using to keep us in the right direction coupled with Excalibur.
Please have a look at our previous post on the simple trading strategy. You can apply the same concept to the Weekly chart and look for the break and close of candle above/below weekly support and resistance levels.
As always, trade safe.
KOG

Will we see a flight to GOLD?Gold setting up a beautiful Bull Pennant on the week chart.
With Volatility increasing thanks to the tapering of QE, a flight to gold is a natural reaction.
A break and hold above $1 860 could result in a first price target back to local highs of $2 000.
I am bullish on Gold for the medium term.
Boom,
TheRaggy

Technical analysis update: XAUUSD (28th June 2021)After FOMC decision and subsequent fall of gold XAUUSD has been in neutral trend for more than a week now. This is well visible on 1-hour time frame and simultaneously reflected in low ADX value. On 1-day time frame RSI reversed from oversold area and gained bullish direction. MACD slowly loses momentum but Stochastics remains bearish. ADX value remains high and due to a reset soon. Price of XAUUSD steadily holds above strong support. Our short term price target remains 1810 USD per ounce.
1-hour timeframe:
Here we can see low ADX value.
Our thoughts from 18th June 2021:
Our thoughts from 17th May 2021:
Our thoughts from 16th April 2021:
Disclaimer: This analysis is not intended to encourage buying or selling of any particular securities. Furthermore, it should not serve as basis for taking any trade action by individual investor. Your own due dilligence is highly advised before entering trade.


XAUUSD GOLD bull flagGolds strong run doesn't look like ending anytime soon. Expecting for XAUUSD's next leg up to play out shortly.
Once the resistance between $1,965 and $1,973 has passed a push is likely to test the $2,000 zone.
Go long.

Gold Investor Trend lineGold made all time high in 2011 after 2007 financial crisis. How just one trend line predicted current bull mark with two buying opportunities.
Trend lines are the most popular technical analysis strategy among trader and investor. Since investor invest for long term, weekly chart is their favorite where all investor's consensus see clear about price


GOLD bull market This is still a good buying opportunity for gold. We’re in the beginning stages of the bull market soon to make new all time highs before years end. Healthy consolidation happening around 786 fib level, once through Gold will hit $2-2.5k easily by the end of year. Gold bull market just beginning with unlimited fed liquidity injections. Physical gold is the best to own. Gold trust ETFs should not be held in place of physical gold. Gold miners likely better than trust ETFs.

GOLD ANALYSIS|MARKET MAKERS DEAL|THREE SCENARIOS EXPLAINED
Hello friends,
To begin with, Gold is clearly in the uptrend on monthly, weekly and daily timeframes. Therefore shorts work with smaller probability. Just keep that in mind.
The asset is near a very important level of 1800 and the area around it, so some accumulation before a breakout attempt is expected. We are currently trading in a range , which is crossed by a diagonal support line.
I am convinced that the 1800 level will be tested sooner than later, so It might be so that the diagonal support stands and we see the red resistance breakout and then we might go long after pullback.This is a scenario when there is no volumes left to collect on these levels, and market makers will push the market higher, speeding up the events. That is scenario 1(black arrows)
However, this would be too easy, and the alternative scenario(blue arrows) is that the diagonal support gets broken and the range trading continues for some time.
This scenario is easy to trade, with the key question being: which way does the range go in the end. Well, the answer is that trading is probabilistic so we cant know, and therefore we will trade the range until a breakout either way. If the range breaks out higher, then the long scenario is valid again.
By the way, ranges are the ideal money making setups for market makers, which is more obvious in stocks, but remains valid for other assets too. Ride small waves, spook retail traders and collect the stops.
Scenario 3, is a breakout lower, and a short after a pullback. Gold market makers need liquidity and should they get a chance, read, if the buying is sloppy, they will push the mkt below the level, to collect retail traders stops and ride a way down to collect the volume. There, the market will accumulate strength to finally test the 1800 level/area.
Thank you for reading. Like and subscribe if you want more analysis.

Gold Fake Out Play at 1,700 Level1-Hour:
Price crossed below the 1,700 level and quickly retraced above it. It tested this level again, but held supported as well. This is the third wave where we're expecting bullish momentum to build up.
1-Day:
This 1,700 level is also apparent on the daily timeframe. However, we might end up seeing this pair range as it pulls away from this level. As a result, as I set a modest first target of 1,722 and will wait to see how momentum plays out closer to that level.

Buy the Dips in the REAL Bull MarketsBuy at the low end of the range and take some profits at the top end of the range.
The gold bull should be a core position and if you want you can trade around that core position like me.

Gold bullish structure formation1-Day:
The 1,700 level is a reversal point. Price dipped to this level and formed a daily doji.
1-Hour:
Over on the hourly, we're also seeing the structure change. Price is beginning to paint higher highs and higher lows. I currently have my entry set at the 1,733 level which is where the moving averages have converged. This is a good potential to ride the next wave higher.

SandStorm Gold - Shooting Star SignalThe combination of a shooting star (on an upward trend) combined with a red volume, signals a short-term reversal.

GOLD LONG GREAT RISK REWARDGOLD has broken above of the triangle it was trading in, and is now accumulating momentum for a surge up.
The risk reward is huge, and the trade is simple and beautiful.
The stop is just below the consolidation support line, and takes are at the resistance lines.
You can always take your 1:1 risk reward first take, but no more that 1/3 of the position. The trade is too good.
Like and subscribe for more trading signals.
Wish you all luck in your trading!
