Are Bullish for the Gold?Effect Rusia VS Ukraina it's warning for the Gold and the market. I see August 2020 had a same happening at Beirut and it's make the Gold Fly high and i think the gold can be fly high again and reach the top 2075 like before. Now, all the market is messy and be affected.
That's my opinion...
Have a nice day...
Goldbullish

🔔Don't miss the great BUY opportunity in XAUUSDHey dear Members . Hope you all are enjoying our ideas and analysis. Now we are here to update about XAUUSD . XAUUSD is exactly Moving according our analysis. Now it has Maximum chances it can Target Price level 1900.
Keep in touch we will update further soon.
🙏If you have an idea that helps me provide a better analysis, I will be happy to write in the comments🙏
❤️Please, support this idea with a like and comment!❤️

GLD Monthly Breakout Imminent!11 month accumulation with a big range expansion in Feb. There is the possibility to expect a second level target here which would bring the price target to around $204. I'll wait till the end of Feb before entering to await confirmation of a breakout.
As long as the price stays above ~173.80 we will have a confirmed breakout.
Closing for the month above $173.80 would make the monthly range expansion greater than the previous candle, confirming the breakout.

XAUUSD - KOG REPORT!KOG Report:
In last weeks KOG Report we suggested caution on the markets as the structure had broken and the higher KOG targets were open. We were looking for support to hold around the 1850 and below that 1835 levels for the price to propel to the upside with our first target being 1872 and above that 1888. We gave a level of 1865-70 to look for resistance in the early part of the week which we said would represent an opportunity to short the market into the immediate support levels below. All in all the short gave traders over 300pips down and the long from support gave traders over 500pips to the upside into the KOG targets. During the course of the week, we updated traders with the weekly levels and analysis suggesting these higher levels will be achieved which they now have.
We’ve tried to keep it level to level thus far highlighting key regions to short the market and key regions to long the markets. We hope you’ve benefited from the analysis and ideas shared.
So what can we expect in the week ahead?
We’ll start by saying this is going to be a difficult week for retail traders as long as the threat of war is looming. Although technical levels are achieved its the volatility and aggressiveness of the movement that catches traders out. We can expect more of this whipsaw price action with the market reacting to news updates., so play this on the defensive for a the beginning of the week and control your lot sizes. Always have a risk strategy in place!
So we’re going to go a little further in depth today and plan for each scenario that we can see potential for.
Our plan:
Scenario 1:
Price opens with and targets the upside. We have Excalibur targets above which are sitting around the 1905 , 1912 and 1917 price regions. We will want to see how the price reacts at these levels and potentially target the short trade back down into the immediate support levels as illustrated on the chart. We feel the retracement after the movement can be a little deeper than what traders will expect so we will be looking for the 1880 level first, then 1870 and below that 1855.
Scenario 2:
The price ranges here for a day or so to bring its mean up. This scenario entails caution, as if it does this its likely we will see another push to the upside targeting the Excalibur levels and potentially beyond that into the 1920 and above that 1935-42 levels which is the top of the trend. The fractal shows that there is potential for a double top around the 1940-50 price point so lets keep this in mind while we’re trading over the next couple of weeks. If this scenario plays out we will be trading this level to level only using Excalibur targets above as our destinations.
Scenario 3:
Price opens, stays below the 1900 level, shows signs of reversal which and breaks below the 1880 level with a 4H close. This will be the first opportunity to short the market back down into immediate support regions 1870, 1865 and below that 1845. Based on these support levels holding we feel an opportunity to long the market back up to target that 1900 level and above would be reasonable.
Our personal thoughts are this move to the upside could be limited with the high being around the 1940-55 price region, if it gets there! We still have targets below which we want to see completed in the months ahead so we’re not convinced we’re going to all time highs at the moment. However, lets trade it as we see at and continue with our plans.
As we usually do we will update traders with the daily reviews and levels keeping them in the right way of the markets.
Below is the chart we've shared on a few occasions showing the targets we had open, it was also shared on the KOG report last week. You can see we have the open target above so please keep an eye on this!
Daily chart structure:
We’re sharing the daily chart which we have been using to show you the market structure. Within this chart are the daily trends, support and resistance levels as well as the key levels. We’re sharing this so traders can see the importance of charting on the higher time frames and how the levels shown can be used to gauge potential movement. Alongside this you can use the trading strategy that we have shared on TradingView and look for the breaks and closes of daily candles within the trend. Trends are powerful so always use what ever comes first, the trend line of the support and resistance level!
This chart shows there is still room to the upside, however, there is still a lot of room to the downside to create the higher low. What we’re looking for here is how the price reacts to the trend along with the resistance levels above. For those who use “W” and “M” patterns you can also see there is potentially a very large W pattern that on the break of the trend to the upside could complete at the ATH!!
Please do support this analysis with your likes and comments.
As always, trade safe.
KOG


XAUUSD, expect to explode towards 1840 Last week bullish prediction had a little success in the Gold against Dollar pair, but it can be called slightly bullish accumulation zone with a false breakout not once but twice, This price action clearly suggest a spring effect to go up on the second week of February , I am sensing supply zone at 1839 ,
Analysis only for education purpose

Gold buyI could be wrong buy we might be going into a bullish week after it picks up the liquidity on the bottom line right below the price so watch out for that but be careful because its not like nasdaq it turns fast an unpredictably so set your tps and keep a close eye on your trades even if you are a swing trader cause you still can suffer some damage...

GOLD large move to the upside I'm very interested in GOLD buys around the area of 1790 to firstly take out 1820 and possibly higher. Their is a lot pointing to buys on gold including the trendline, reversal price action on multiple time frames and an obvious support level. Hope everyone has a fantastic week on and off the charts and let me know your opinions in the comments!

Will we see a flight to GOLD?Gold setting up a beautiful Bull Pennant on the week chart.
With Volatility increasing thanks to the tapering of QE, a flight to gold is a natural reaction.
A break and hold above $1 860 could result in a first price target back to local highs of $2 000.
I am bullish on Gold for the medium term.
Boom,
TheRaggy

#Gold Usd #Gold#Forex Idea ; 01
#GOLDUSD
#Gold
Gold Chart Have Cup And Handel On Weekly Chart Get Ready For More Expensive Gold 🥇
Chart

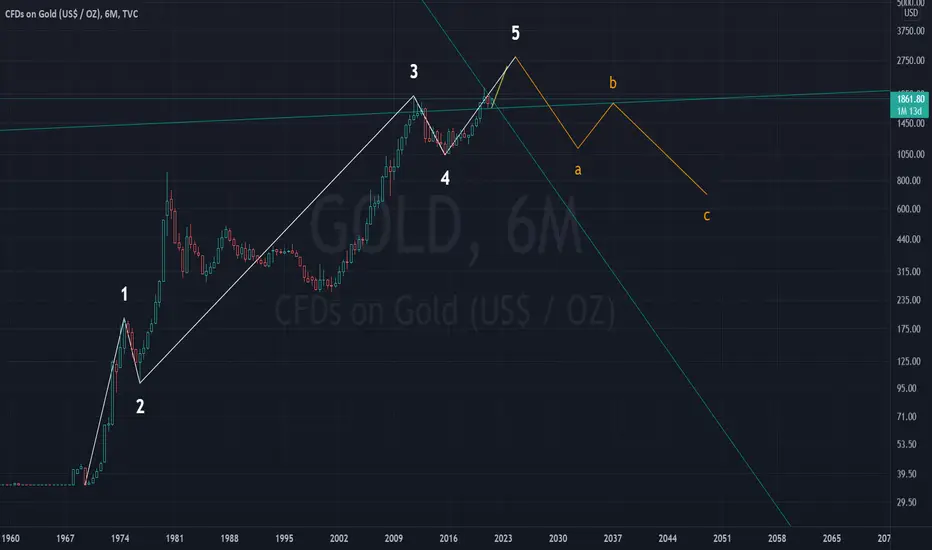
future of gold this analysis is based on wave count
i believe we are in the 5th wave of EWT and which will top out in 2024 around and after which we could see a bear market in gold this analysis also involves support and resistance. their is also bull flag formed
GOLD! BULLISH BUY AREASI haven't covered gold in a while but cant help but notice the possible upside potential from this metal (long term). There is a lot happening around the world and gold has always been there as the safe haven for big investors... over the past year price hasn't done much apart from move sideways and consolidate but does this mean something big is building? I hope so and these few areas I'm looking at that are hopefully going to put me in an opportunity to catch these big moves.

Gold time travels to... drum roll... $1967. Long Gold! :-)Chart says it all: Inverse H&S pattern :-) And, indicators are bullish. Finally, the govt. needs to do something to unleash gold as it's being left in the dust by Bitcoin. That won't last. Look out for something that is done by the Fed to assist the price of gold. The US holds 250M ounces of gold so...

GOLD (XAUUSD) TIME TO BREAKOUT THE BASE ???GOLD time to breakout from the base?? this is my personal perspective and my personal trading plan, Gold will going up to meet cluster area fibonacci and classic resistance

17th September 2021: XAUUSD Bullish is coming 1905.00Gold has been a target.
Gold has been misuse.
Gold has been abused.
HAVE A FAITH IN GOLD. IN GOLD WE TRUST.
This is the motto we all have been used to hear.
It has been haunted since childhood.
My father always told me there is nothing to compare when comes to 'Gods money 💰'
It has been since in generation around 1400 years ago and still being used until now.
In gold we trust. I have never lose faith.
Since August 2020 after the major peaked above $2000, gold has devalued down to $1783 today (article written)
Gold has been abused by trader withdraw their saving in gold trading and put all their gold basket into cryptos.
Gold has been reached to their worst value on $1680 after gold flash crashed. Now trending on $1783. While many speculative and analysis
betting on 1770,1780,1790 were gold's phycological value.
Printing money at their tremendous roar, people looking as stock and indices as their main portfolio investment while gold being misuse
by letting gold is the secondary option of trading.
All eyes on US dollar DXY.
All eyes on crypto as crypto will be skyrocketting above $50,000 by this week.
All eyes on FED on tapering by reduce their bond purchase monthly.
All millionaire self made crypto from 18 years old is the treat to the society trading environment for the all market pump and dumps.
While seeing all this risk putting into gold, gold will remain bullish and it is at its downtrend end this week, perhaps this month.
Zezu Zaza
2048

Gold on major level possible LONGGold has reach a major level and is probably looking for continuation of bullish momentum 1830 is strong resistance and price is looking to grab that liquidity

Gold bullishLast week Gold made its low to the major support and it is up from that level. I believe that Gold has the potential to go more up to $1800.

GOLD BUYLast week Gold test its 1750 support and than rise again and also new monthly candle started last week now Gold is expected to breach it 1800 level and test 1850 this Week For accurate entries Stay tuned

Outlook for Gold: Pullback presents an opportunity to buyHi everyone! Our call on gold last week is playing out nicely. For this week, we maintain a bullish bias on Gold, with prices holding above a key weekly and daily support area at 1763.14 - 1768.80, which lines up with the 78.6% and -27.2% retracement. A pullback to test this support zone presents an opportunity to play the bounce. Keeping in mind the views on the weekly time frame echo a bullish bias, a break above our H1 resistance could at 1794.50 could see more upside in gold prices, with 1820.20 as our next resistance target.

GOLD ANALYSIS ...I can See A lot Bull Power in market SO we can see two points which market can follow after that we can confirm the Market direction WHATS YOUR IDEA ? FEEL FREE TO COMMENT THANKS .

XAUUSD BUYS TO 1890.000 / 1900.000Daily close above resistance. Looking for continuation to fill the wick at 1890.000 and 1900.000.


IS THIS THE START OF THE BULL RUN FOR GOLD?We all know the story for gold. We all heard about it. Crazy estimates of 3000-5000 usd and even 10k usd price valuation. But after we hit over 2000 usd, price action went south really fast and nearly never corrected. Until it formed a double bottom recently. Bears cant go further and bulls started to win the fight. Now there is chance for a bull run. If price movement can close couple days above 50 day ema and previous support zone of 1756-1763, i do think we can be more optimistic about gold.
Also it is important to note that when summer arrives gold prices tend to go higher. This coupled with the fact that fed will not raise rates this year and they probably will not change their bond buying program can cause huge price increase in gold market. Also US bond rates does seem to chill a bit and this can lead gold price rise even more.
Everything looks optimistic for gold price if it can close couple candlestick on daily chart around this 50 day ema area. If not we cant be too optimistic until it close above this area. After all market expect decrease in quentitive easing and increase in interest rates in the foreseeable future.
What you think about gold? Im heavily long in gold, at least for the short term, and want hear your idea!
