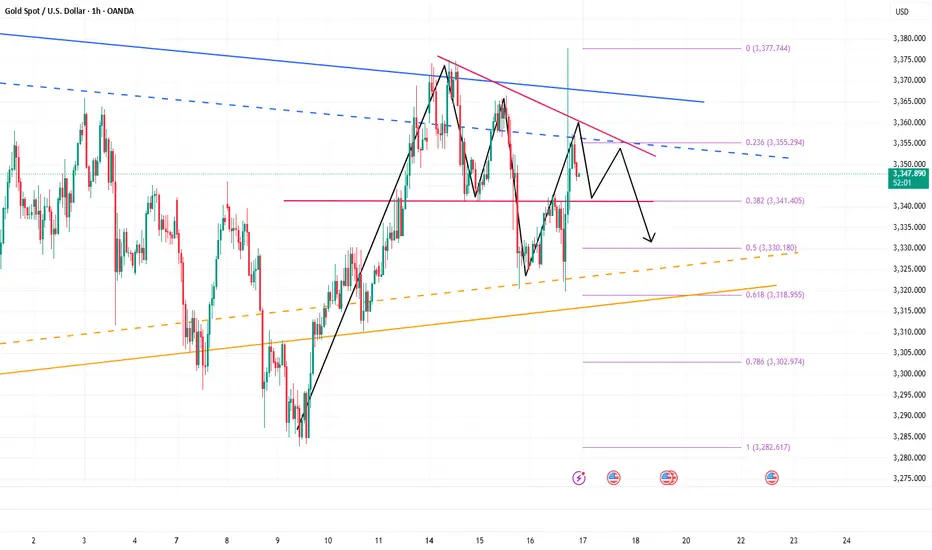
False breakout? Gold reverses sharply after news surgeBecause of the news that Trump hinted at firing Powell, gold surged strongly in the short term and passed to 3377, recovering the recent decline in one fell swoop. We went long on gold near 3323 in advance, and went long on gold near 3340 again after gold retreated, hitting TP: 3345 and 3355 respectively. The two long trades successfully made a profit of 370pips, with a profit of more than $18K.
Although gold has risen sharply in the short term and effectively destroyed the downward structure, it is mainly news that drives the market. After Trump denied firing Powell, gold rose fast and fell fast. So we can't chase long gold too much. First, the sustainability of the news-driven market needs to be examined, and second, the certainty of Trump's news is still unreliable. He always denies himself the next day.
After the gold price retreated quickly, a long upper shadow appeared in the candlestick chart, indicating that the upper resistance should not be underestimated. Therefore, we should not rush to buy gold. We can still consider shorting gold in the 3355-3365 area. We should first focus on the area around 3340. If gold falls below this area during the retreat, gold will return to the short trend and test the area around 3320 again, or even fall below this area after multiple tests and continue to the 3310-3300 area.
Goldchartpattern
GOLD - where is current Resistance? Holds or not??#GOLD... perfect holdings and bounced back and now market have his ultimat resistance area is 3382-84
Thats play key role from yesterday and in today it will be our key level.
Keep close and only hold shorts below that other use not
Note: above 3382 we will go for cut n reverse on confirmation.
Good luck
Trade wisely

GOLD DAILY CHART MID/LONG TERM UPDATEGOLD Daily Chart Update: 17the FEB 2025
Hello Traders,
Here’s the latest update on the GOLD daily chart, which we've been closely monitoring and trading. Below, we break down recent price movements, updated key levels, and provide actionable insights for the days ahead.
Recap of Recent Chart Success!
Our recent analysis has proven highly accurate:
ENTRY LEVEL 2744: ✅ Achieved
TARGET TP1 (2807): ✅ Achieved
TARGET TP2 (2870): ✅ Achieved
TARGET TP3 (2933): ✅ Achieved
What’s Next for GOLD? Bullish or Bearish?
Last week, GOLD reached an all-time high of 2942.59. Currently, the price is fluctuating between the gap above 2933 and the gap below 2870. 2933 is acting as a key resistance level, and an FVG (Fair Value Gap) has formed to reinforce this resistance. As a result, our GoldTurn levels are now activated as key support zones.
KEY LEVEL: 2870
Resistance Levels: 2933, 2990, 3051
Support Levels (GoldTurn Levels): 2870, 2801, 2744, 2671, 2595
EMA5 Behavior:
* Or If EMA5 crosses and locks above 2933, it strengthens the bullish case.
* If EMA5 fails to hold above 2870, cross and lock below this level 2870, expect a pullback to key GOLDTURN levels below.
Recommendations:
* Capitalize on Dip Opportunities: Use smaller timeframes (1H, 4H) to trade around GOLDTURN levels, targeting 30–40 pips per trade.
* Stay focused on shorter trades in this range-bound market to manage volatility effectively.
Long-Term Bias:
Maintain a bullish outlook while viewing pullbacks as buying opportunities.
Accumulate positions near key support levels for a safer approach instead of chasing highs.
Final Note:
Trade with confidence and precision. Our analysis ensures you’re well-prepared to navigate the evolving market landscape. Stay updated with our daily insights across multiple timeframes for deeper clarity.
Thank you for your continued trust! Don’t forget to like, share, and comment to support our work.
Best regards,
The Quantum Trading Mastery Team

GOLD 12H CHART ROUTE MAP ANALYSIS FOR THE WEEKGOLD 12H CHART UPDATE: 17th FEB 2025
Hello Traders,
Here’s the latest 12H GOLD chart update, offering a thorough review of recent price movements and key insights for the upcoming sessions. Since October 2023, our careful tracking has maintained 100% target accuracy, as reflected by the Golden Circle markers on the charts. Let’s explore the highlights and what lies ahead.
Recap of Recent Chart Success!
Our recent analysis has been highly accurate:
Entry Level 2814: ✅ Achieved
TP1 2858: ✅ Achieved
TP2 2903: ✅ Achieved
TP3 2948: ✅ Partially achieved
After hitting TP3, 2948 acted as the expected resistance level, causing a price reversal of over 40 pips down to the weighted GoldTurn levels of 2900 and 2856. These levels provided support, allowing the price to bounce back toward the resistance zone.
What’s Next for GOLD? Bullish or Bearish?
* Resistance Levels: 2942, 2993, 3041
* Support Levels (GoldTurn Levels): 2900, 2856, 2813, 2770, 2710, 2664, 2599
* FVG is providing strong resistance 2910 which will cause short bearish
EMA5 Behavior (Red Line):
Current EMA5: 2903.06
* EMA5 is fluctuating between two key weighted levels, with a gap above 2948 and below the 2900 GoldTurn level.
* A crossover of EMA5—either above or below the weighted level—will signal the next significant move for GOLD.
Bullish Targets
EMA5 cross and hold above 2814, will open the following bullish target 2858 ✅ DONE
EMA5 cross and lock Above 2858, will open the following bullish target 2903 ✅ DONE
EMA5 cross and lock Above 2903, will open the following bullish target 2948 ✅ DONE
EMA5 cross and lock Above 2948, will open the following bullish target 2993
EMA5 cross and lock Above 2993, will open the following bullish target 3041
Bearish Targets
EMA5 hold and cross Below 2900: will open the following bearish target 2856 ✅ DONE
EMA5 cross and lock Below 2856: will open the following bearish target 2813
EMA5 cross and lock Below 2813: will open the following bearish target 2770
EMA5 cross and lock Below 2770: will open the following bearish target 210
EMA5 cross and lock Below 2710: will open the following bearish target 2664 (Retracement Range)
Short-Term Strategy:
Anticipate possible reversals at weighted GOLDTURN levels 2856 and 2813.
Leverage 1H and 4H timeframes to capture pullbacks around these levels.
Target 30–40 pips per trade, focusing on shorter positions for effective risk management.
GOLDTURN levels provide reliable bounce opportunities, allowing you to buy at dip levels.
Long-Term Outlook:
Maintain a bullish bias while using pullbacks as buying opportunities.
Buying near key support levels ensures better entry points and mitigates risks, avoiding the pitfalls of chasing tops.
Final Thoughts:
Trade with precision, discipline, and confidence. Our accurate, multi-timeframe analysis equips you to navigate the market effectively. Stay updated with daily insights to remain ahead of market trends.
We appreciate your support! Don’t forget to like, comment, and share this post to help others benefit.
Best regards,
📉💰 The Quantum Trading Mastery Team

Gold - Trend continuation after deep correctionParallel Channel: A clear upward-trending channel indicating long-term bullish movement.
Consolidation Pattern: A triangular consolidation phase before a breakout.
Strong Support Level: Marked around 2,861.843, serving as a key price level.
Price Projections: Two significant measured moves showing price increases of 14.10% and 12.27%, with the latest target reaching approximately 3,037.055.
Current Price Action: The price is around 2,882.482, experiencing a slight pullback (-1.57%).
Key Elements of the Chart:
1. Overall Trend: Bullish Momentum
The chart showcases an upward trend in gold prices over the past several months.
A parallel ascending channel is drawn, marking higher highs and higher lows, indicating a sustained bullish trajectory.
2. Parallel Channel Formation
A parallel channel (black trendlines) has been plotted, highlighting a structured uptrend.
The price has consistently moved within this channel, bouncing off support and resistance levels.
3. Consolidation & Breakout Phase
A green triangular pattern is visible in the middle section of the chart.
This pattern represents a period of price consolidation, where gold traded in a tightening range before a breakout.
After breaking out of this consolidation phase, the price resumed its uptrend, confirming a bullish breakout.
4. Support and Resistance Levels
A strong support level is identified at 2,861.843, providing a key price floor.
The price has recently retraced and is testing this support zone around 2,882.482.
Resistance lies near the upper boundary of the parallel channel, with a target projection of 3,037.055.
5. Measured Price Moves (Projection Targets)
The chart includes two price projections using vertical arrows:
First measured move: A rally of 333.699 points (14.10%), suggesting a significant bullish leg.
Second measured move: Another 331.092 points (12.27%), confirming continued bullish strength.
The next target price level is around 3,037.055 USD, indicating further upside potential.
6. Current Market Conditions
The current price is around 2,882.482, reflecting a -1.57% daily decline.
The recent pullback suggests either a minor correction or a potential support test before the next leg upward.
Technical Summary:
Trend: Strong bullish uptrend within a well-defined parallel channel.
Support Level: 2,861.843 (marked as a strong area of buying interest).
Resistance Level: Around 3,037.055.
Breakout Confirmation: After a consolidation phase, gold has resumed its uptrend.
Market Outlook: The chart indicates the potential for further upside, but short-term corrections may occur.
The price remains within the parallel channel, gold could continue its upward trajectory, with 3,037.055 USD as the next key resistance level. However, if the support level (2,861.843) fails, a deeper correction may follow.

XAUUSD M30 EVENING STAR TECHANICAL ANALYSIS (READ CAPTION)hello trader's. what do you think about gold.
current price: 2710
So Some Support and Resistance i Find in The Daily Chart
Let's Find out on M30 Time Frame
First of all there is a Evening Star Candle in Gold Chart that's Means Gold can be Retest the Support's so we have support for today is 2705 then 2696 and The first Resistance is 2720 and then demand zone 2728
resistance zone: 2720.2728
support zone: 2706.2696
please like comment and follow

XAUUSD TECHANICAL ANALYSIS (READ CAPTION) The Winning Hubhello trader's. what do you think about gold.
current price: 2675
Today We Have (Core CPI) Deta in US Section
So Some Support and Resistance i Fond in The Daily Chart
Let's Find out on H1 Time Frame
First Support is the Last Day Low it's 2660 then 2656 and The first Resistance is 2685 and then demand zone 2697
resistance zone: 2685.2697
support zone: 2660.2656
please like comment and follow

XAUUSD (GOLD) EVERYDAY TRADE SETUPHello traders ,
This my idea for Short. XAUUSD (GOLD) The Zone 5MIN choch. then i will go to short.
this is my ideas only. what you are flow your trading statistics you can continue.
If you Like my ideas follow me...
