GOLD (XAUUSD) - Weekly Technical Analysis UpdateMidterm forecast:
While the price is below the resistance 2075.05, beginning of downtrend is expected.
We make sure when the support at 1790.00 breaks.
If the resistance at 2075.05 is broken, the short-term forecast -beginning of downtrend- will be invalid.
Technical analysis:
While the RSI resistance #1 at 57 is not broken, the probability of price increase would be too low.
A peak is formed in daily chart at 1931.40 on 10/21/2020, so more losses to support(s) 1851.00, 1817.75 and minimum to Major Support (1790.00) is expected.
Price is below WEMA21, if price rises more, this line can act as dynamic resistance against more gains.
Relative strength index (RSI) is 44.
❤️ If you find this helpful and want more FREE forecasts in TradingView
. . . . . Please show your support back,
. . . . . . . . Hit the 👍 LIKE button,
. . . . . . . . . . Drop some feedback below in the comment!
❤️ Your Support is very much 🙏 appreciated! ❤️
💎 Want us to help you become a better Forex trader ?
Now, It's your turn !
Be sure to leave a comment let us know how you see this opportunity and forecast.
Trade well, ❤️
ForecastCity English Support Team ❤️gol
Golddollar


Gold Eats Stops For Breakfast Lunch & Dinner - Target $2030Pretty Simple Analysis Here-
I'm bearish on gold from a weekly perspective, but we are still in what I'd call a Trap phase.
We have broken a daily trendline, but I think that there are a lot of early/eager bears thinking they caught a top (maybe they have)
But if I'm a banker or market maker I can see a ton of stop losses sitting above this triangle pattern.
I would want to trigger all of them, then sell gold off.
For that reason I will be buying into the stops, and selling once they clear.
My key level is 2027-2030. I've been waiting for them to mitigate at this price for almost two months now.
Check my prior posts,

GOLD (XAUUSD) - Weekly Technical Analysis UpdateMidterm forecast:
While the price is below the resistance 2075.05, beginning of downtrend is expected.
We make sure when the support at 1851.00 breaks.
If the resistance at 2075.05 is broken, the short-term forecast -beginning of downtrend- will be invalid.
Technical analysis:
While the RSI resistance #1 at 62 is not broken, the probability of price increase would be too low.
A peak is formed in daily chart at 1932.20 on 10/12/2020, so more losses minimum to Major Support (1851.00) is expected.
Price is below WEMA21, if price rises more, this line can act as dynamic resistance against more gains.
Relative strength index (RSI) is 48.
❤️ If you find this helpful and want more FREE forecasts in TradingView
. . . . . Please show your support back,
. . . . . . . . Hit the 👍 LIKE button,
. . . . . . . . . . Drop some feedback below in the comment!
❤️ Your Support is very much 🙏 appreciated! ❤️
💎 Want us to help you become a better Forex trader ?
Now, It's your turn !
Be sure to leave a comment let us know how you see this opportunity and forecast.
Trade well, ❤️
ForecastCity English Support Team ❤️

Gold Analysis 13/10/2020We have been ranging since London session yesterday with very little volume. We have three options for gold volume permitting.
If we break above the range we have been stuck in, we can look for a potential wickfill which would be 30 pips, however that is a risky move. Safer buys would be if we break resistance at 1933. We have clean traffic to the left and we can look to fill the range up to 1940.
For those looking to sell, if we break support at the bottom of the range at 1920, we have a clean range to fill to the downside, potential targets can be between 1912-1914.
As always wait for confirmations before you execute your trades and trade with caution.

Short GoldTarget 1881/1875
Main Stop Loss at 1908
*Disclaimer : I just shared my view. Please trade with your own and comfortable ideas. Thanks.

GOLD (XAUUSD) - Weekly Technical Analysis UpdateMidterm forecast:
While the price is below the resistance 1920.00, continuation of downtrend is expected.
We make sure when the support at 1747.50 breaks.
If the resistance at 1920.00 is broken, the short-term forecast -continuation of downtrend- will be invalid.
Technical analysis:
The Falling Wedge taking shape and as a bullish pattern suggests we will soon see another leg higher if price breaks and closes above downtrend.
While the RSI resistance #1 at 51 is not broken, the probability of price increase would be too low.
A trough is formed in daily chart at 1846.50 on 09/28/2020, so more gains to resistance(s) 1909.00 and maximum to Major Resistance (1920.00) is expected.
Price is below WEMA21, if price rises more, this line can act as dynamic resistance against more gains.
Relative strength index (RSI) is 46.
❤️ If you find this helpful and want more FREE forecasts in TradingView
. . . . . Please show your support back,
. . . . . . . . Hit the 👍 LIKE button,
. . . . . . . . . . Drop some feedback below in the comment!
❤️ Your Support is very much 🙏 appreciated! ❤️
💎 Want us to help you become a better Forex trader ?
Now, It's your turn !
Be sure to leave a comment let us know how you see this opportunity and forecast.
Trade well, ❤️
ForecastCity English Support Team ❤️

2 Buy opportunity in XAUUSD , Mid-Term & IntradayMid-Term Forecast:
Trading suggestion:
". There is still a possibility of temporary retracement to suggested resistance line (1909.00).
if so, traders can set orders based on Price Action and expect to reach short-term targets."
Technical analysis:
. XAUUSD is in a downtrend and the continuation of downtrend is expected.
. The price is below the 21-Day WEMA which acts as a dynamic resistance.
. The RSI is at 48.
Take Profits:
TP1= @ 1851.00
TP2= @ 1817.75
TP3= @ 1747.00
TP4= @ 1695.00
TP5= @ 1557.00
SL: Break Above 1934.00
-----------------------------------------------------------------------------------------------------------------
Short-Term Forecast:
Trading suggestion:
". There is still a possibility of temporary retracement to suggested resistance line (1909.00).
if so, traders can set orders based on Price Action and expect to reach short-term targets."
Technical analysis:
. XAUUSD is in a downtrend and the continuation of downtrend is expected.
. The price is below the 21-Day WEMA which acts as a dynamic resistance.
. The RSI is at 70.
Take Profits:
TP1= @ 1884.00
TP2= @ 1875.00
TP3= @ 1866.00
TP4= @ 1848.60
TP5= @ 1818.00
SL: Break Above 1925.00
❤️ If you find this helpful and want more FREE forecasts in TradingView
. . . . . Please show your support back,
. . . . . . . . Hit the 👍 LIKE button,
. . . . . . . . . . . Drop some feedback below in the comment!
❤️ Your Support is very much 🙏 appreciated! ❤️
💎 Want us to help you become a better Forex trader ?
Now, It's your turn !
Be sure to leave a comment let us know how you see this opportunity and forecast.
Trade well, ❤️
ForecastCity English Support Team ❤️

2 Sell opportunity in XAUUSD , Mid-Term & IntradayMid-Term Forecast:
Trading suggestion:
". There is still a possibility of temporary retracement to suggested resistance line (1909.00).
if so, traders can set orders based on Price Action and expect to reach short-term targets."
Technical analysis:
. XAUUSD is in a downtrend and the continuation of downtrend is expected.
. The price is below the 21-Day WEMA which acts as a dynamic resistance.
. The RSI is at 48.
Take Profits:
TP1= @ 1851.00
TP2= @ 1817.75
TP3= @ 1747.00
TP4= @ 1695.00
TP5= @ 1557.00
SL: Break Above 1934.00
-----------------------------------------------------------------------------------------------------------------
Short-Term Forecast:
Trading suggestion:
". There is still a possibility of temporary retracement to suggested resistance line (1909.00).
if so, traders can set orders based on Price Action and expect to reach short-term targets."
Technical analysis:
. XAUUSD is in a downtrend and the continuation of downtrend is expected.
. The price is below the 21-Day WEMA which acts as a dynamic resistance.
. The RSI is at 70.
Take Profits:
TP1= @ 1884.00
TP2= @ 1875.00
TP3= @ 1866.00
TP4= @ 1848.60
TP5= @ 1818.00
SL: Break Above 1925.00
❤️ If you find this helpful and want more FREE forecasts in TradingView
. . . . . Please show your support back,
. . . . . . . . Hit the 👍 LIKE button,
. . . . . . . . . . . Drop some feedback below in the comment!
❤️ Your Support is very much 🙏 appreciated! ❤️
💎 Want us to help you become a better Forex trader ?
Now, It's your turn !
Be sure to leave a comment let us know how you see this opportunity and forecast.
Trade well, ❤️
ForecastCity English Support Team ❤️


GOLD (XAUUSD) - Weekly Technical Analysis UpdateMidterm forecast:
While the price is above the support 1901.20, resumption of uptrend is expected.
We make sure when the resistance at 2075.05 breaks.
If the support at 1901.20 is broken, the short-term forecast -resumption of uptrend- will be invalid.
Technical analysis:
The symmetrical triangle taking shape and as a continuation pattern suggests we will soon see another leg higher if price breaks and closes above the downtrend line of the triangle.
While the RSI support #1 at 45 is not broken, the probability of price decrease would be too low.
A peak is formed in daily chart at 1991.10 on 09/01/2020, so more losses minimum to Major Support (1901.20) is expected.
Price is above WEMA21, if price drops more, this line can act as dynamic support against more losses.
Relative strength index (RSI) is 52.
❤️ If you find this helpful and want more FREE forecasts in TradingView
. . . . . Please show your support back,
. . . . . . . . Hit the 👍 LIKE button,
. . . . . . . . . . Drop some feedback below in the comment!
❤️ Your Support is very much 🙏 appreciated! ❤️
💎 Want us to help you become a better Forex trader ?
Now, It's your turn !
Be sure to leave a comment let us know how you see this opportunity and forecast.
Trade well, ❤️
ForecastCity English Support Team ❤️


XAUUSD . Weekly Technical Analysis Update for GOLDMidterm forecast:
While the price is below the resistance 2075.05, beginning of downtrend is expected.
We make sure when the support at 1818.00 breaks.
If the resistance at 2075.05 is broken, the short-term forecast -beginning of downtrend- will be invalid.
Technical analysis:
While the RSI support #1 at 45 is not broken, the probability of price decrease would be too low.
A peak is formed in daily chart at 1991.10 on 09/01/2020, so more losses to support(s) 1916.20, 1862.45 and minimum to Major Support (1818.00) is expected.
Price is below WEMA21, if price rises more, this line can act as dynamic resistance against more gains.
Relative strength index (RSI) is 49.
❤️ If you find this helpful and want more FREE forecasts in TradingView
. . . . . Please show your support back,
. . . . . . . . Hit the 👍 LIKE button,
. . . . . . . . . . Drop some feedback below in the comment!
❤️ Your Support is very much 🙏 appreciated! ❤️
💎 Want us to help you become a better Forex trader ?
Now, It's your turn !
Be sure to leave a comment let us know how do you see this opportunity and forecast.
Trade well, ❤️
ForecastCity English Support Team ❤️
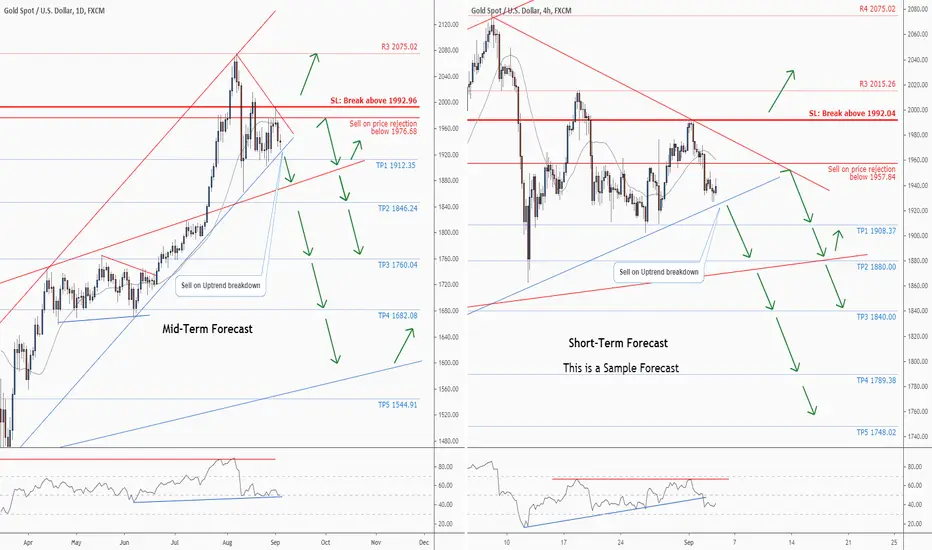
Two great sell opportunities on this chart for GOLDMid-Term Forecast:
Trading suggestion:
". There is still a possibility of temporary retracement to suggested resistance line (1976.68).
if so, traders can set orders based on Price Action and expect to reach short-term targets."
Technical analysis:
. GOLD is in a range bound and the beginning of downtrend is expected.
. The price is below the 21-Day WEMA which acts as a dynamic resistance.
. The RSI is at 50.
Take Profits:
TP1= @ 1912.35
TP2= @ 1846.24
TP3= @ 1760.04
TP4= @ 1682.08
TP5= @ 1544.91
SL: Break Above 1992.96
-------------------------------------------------------------------------------------------------------------------
Short-Term forecast:
Trading suggestion:
". There is still a possibility of temporary retracement to suggested resistance line (1957.84).
if so, traders can set orders based on Price Action and expect to reach short-term targets."
Technical analysis:
. GOLD is in a range bound and the beginning of downtrend is expected.
. The price is below the 21-Day WEMA which acts as a dynamic resistance.
. The RSI is at 40.
Take Profits:
TP1= @ 1908.37
TP2= @ 1880.00
TP3= @ 1840.00
TP4= @ 1789.38
TP5= @ 1748.02
SL: Break Above 1992.04
❤️ If you find this helpful and want more FREE forecasts in TradingView
. . . . . Please show your support back,
. . . . . . . . Hit the 👍 LIKE button,
. . . . . . . . . . . Drop some feedback below in the comment!
❤️ Your Support is very much 🙏 appreciated! ❤️
💎 Want us to help you become a better Forex trader ?
Now, It's your turn !
Be sure to leave a comment let us know how do you see this opportunity and forecast.
Trade well, ❤️
ForecastCity English Support Team ❤️

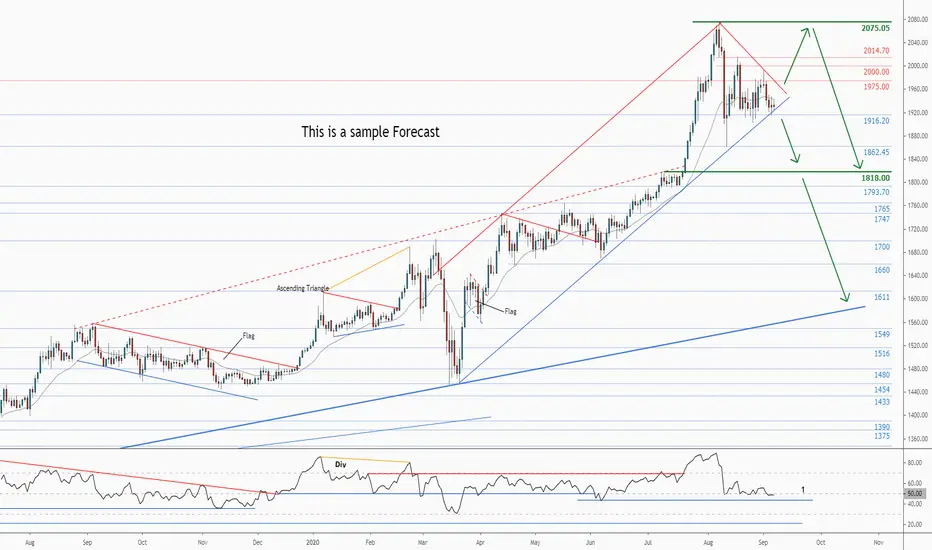
GOLD (XAUUSD) - Weekly Technical Analysis UpdateMidterm forecast:
While the price is below the resistance 2075.05, beginning of downtrend is expected.
We make sure when the support at 1818.00 breaks.
If the resistance at 2075.05 is broken, the short-term forecast -beginning of downtrend- will be invalid.
Technical analysis:
While the RSI uptrend #1 is not broken, bullish wave in price would continue.
A peak is formed in daily chart at 2014.90 on 08/18/2020, so more losses to support(s) 1916.20, 1862.45 and minimum to Major Support (1818.00) is expected.
Price is below WEMA21, if price rises more, this line can act as dynamic resistance against more gains.
Relative strength index (RSI) is 51.
❤️ If you find this helpful and want more FREE forecasts in TradingView
. . . . . Please show your support back,
. . . . . . . . Hit the 👍 LIKE button,
. . . . . . . . . . . Drop some feedback below in the comment!
❤️ Your Support is very much 🙏 appreciated! ❤️
💎 Want us to help you become a better Forex trader?
Now, It's your turn!
Be sure to leave a comment let us know how do you see this opportunity and forecast.
Trade well, ❤️
ForecastCity English Support Team ❤️

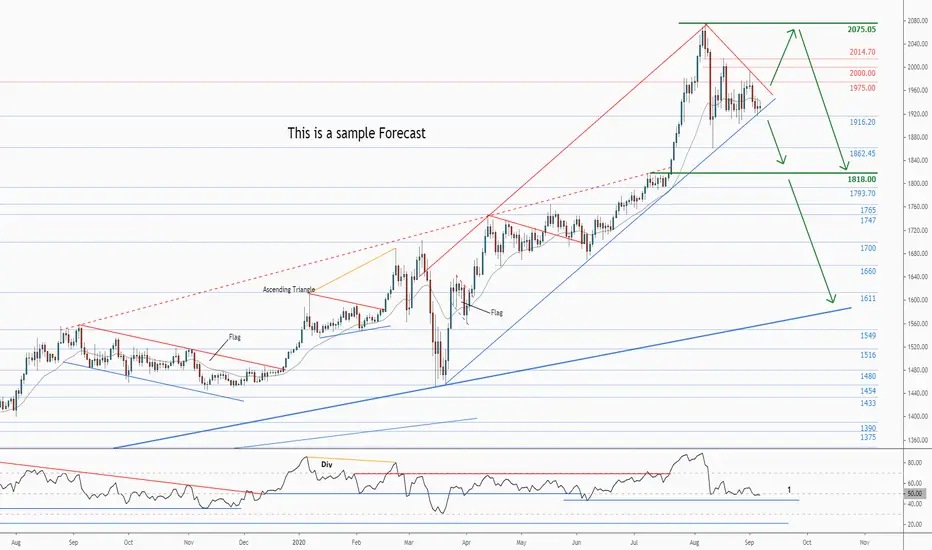
GOLD (XAUUSD) - Weekly Technical Analysis UpdateMidterm forecast:
While the price is below the resistance 2075.05, beginning of downtrend is expected.
We make sure when the support at 1818.00 breaks.
If the resistance at 2075.05 is broken, the short-term forecast -beginning of downtrend- will be invalid.
Technical analysis:
While the RSI uptrend #1 is not broken, bullish wave in price would continue.
A peak is formed in daily chart at 2014.90 on 08/18/2020, so more losses to support(s) 1916.20, 1862.45 and minimum to Major Support (1818.00) is expected.
Price is below WEMA21, if price rises more, this line can act as dynamic resistance against more gains.
Relative strength index (RSI) is 51.
❤️ If you find this helpful and want more FREE forecasts in TradingView
. . . . . Please show your support back,
. . . . . . . . Hit the 👍 LIKE button,
. . . . . . . . . . . Drop some feedback below in the comment!
❤️ Your Support is very much 🙏 appreciated! ❤️
💎 Want us to help you become a better Forex trader?
Now, It's your turn!
Be sure to leave a comment let us know how do you see this opportunity and forecast.
Trade well, ❤️
ForecastCity English Support Team ❤️

