DPW : EV + BlockchainDPW : Looks good to add below $6.50 IMO. Golden crossover soon. Fundamentally strong company.
Goldencross

Legend of The Golden Cross FET/BTC #Fetchai $FET #fetHere we see our FET daily chart from Binance . You'll notice we are about to have a very Bullish event on this chart ! The Golden Cross . What is a Golden Cross ? Well,that's when our light blue 50MA ( or 50 week moving average ) is going to cross up and go through our dark blue 200 MA ( or 200 week moving average. ) These are long-term moving averages and are fairly good indicators of bullish upside coming when they cross like this ! You see the purple rocket on my chart ? That looks to be approximately where we will get a cross up , could be in early March . This should be extremely good for FET and remember FET also has a Mainnet coming in March ! All good stuff ! Looks great ( also I hope you are having a great day . )

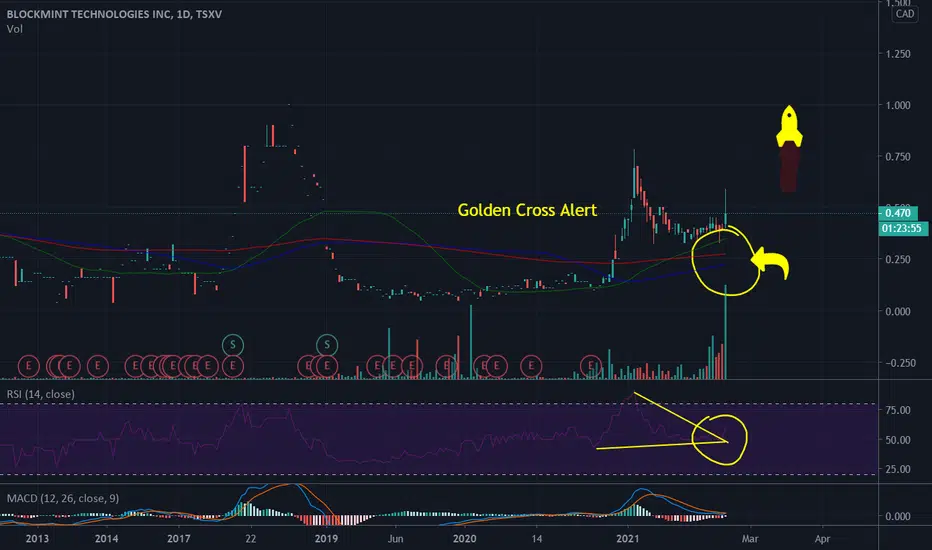
$BKMT / $BKLIF Alert!Cup and handle, golden cross, and Mac D cross on the the daily chart.
Amazing time to get a position before the price moves up!

$BKMT Golden Cross Alert!Golden Cross on the daily. We will see volume come in fast and price will pump. Will it 2 or 3X in price?
We will see soon enough!
$BKMT #BMKT
$BZWR Golden Cross Alert#Goldencross alert on the daily
Cup and handle in play
Look what $MINE did when i posted the Golden cross alert before it popped! 200+%
Please click a like if you have or going to take a position

MGR - Uptrend Confirmed. Next Buying opportunityBullish trend confirmation indications:
1. Downtrend line broken.
2. Impulsive price action at the break of the trendline with High Volume
3. After the impulsive break, price is pulling back.
4. I would be a confident buyer within the Buy Zone which is the Fib Retracement Level Zone of
50-61.8 % and support of the trendline. The ideal Buying zone is between $2.20 - $2.40.
5. Good Buying Opportunity if it closes positive or prints a Bullish candlestick patterns in the Buy Zone area and on or near
the trendline with Bullish Price Action follow through. That will be a trade with confluence.
Please note these are my own notes, by no means trading advise. Please do your own research before entering into any trade.

CYRN. Test entry, watching for breakthrough of $1.80-$2.00 zoneCYRN just had the "golden cross" where the 50 DMA crossed the 200 DMA. TRIX and momentum are also trending up. The weekly and monthly trend keep hitting higher lows, but there seems to be some resistance at the 200 WMA. Further, the monthly chart has triple top "pinbars" indicating selling pressure, keeping the price below the $1.80-$2.00 zone. I'll be looking for a pullback to $1.05-$1.15 for a small test entry. I want to see CYRN cross the 200 WMA, then the $1.80-$2.00 resistance zone. If it breaks out of that zone I'll be looking to buy more. Otherwise, I'll probably sell the test entry if it bounces off the 200 WMA.

PERLUSDT/1DIn short term It seems that PERLIN WILL RAISE UP to THE STRONG RESISTANCE.
In Neutral term If PERLIN will breakout from its resistance, then we will see a nice raise for it.
DO YOU SEE GOLDEN CROSS ??? STAY TUNED!!!

TRXUSDT/1DWHAT A MOMENT FOR TRXUSDT!!!
For neutral term I just can say that :
Price is on resistance zone and trying to breakout from this area.
If price will be able to move ahead and breaking also, then who will be able to stop it ?!
Stay tuned for it and keep it up!!!

Gold - correction is over.the task of hunting liquidity from above.
buying after a breakdown of a key level.
last idea...Worked out 100%
Push like if you think this is a useful idea!
Thanks for your support!

GOLD - sell zone (correction) Preconditions:
- Key level
- Historical level (7 days)
- False break out level
Push like if you think this is a useful idea!
Before to trade my ideas make your own analysis.
Thanks for your support!

$FLYY Golden Cross Alert Golden Cross Alert
Volume will move in and price will go parabolic
#CSE #TSX #roundingbottom #goldencross #stocktowatch #stocksignal

$FLYY Golden Cross Incoming Super bullish #Goldencross playing out on the 4 hour chart
Exciting times ahead

GOLD RUSH?! Bullish indicators
- Macd positive cross
- cross BB midline
- Ma cross on 2hr chart
- Volume increasing
After predicting the dropped gold has seen in the last few days, I had also expected that we would see a run-up to test the top pennant resistance line at around 1845, which is what this chart depicts.
Be sure to keep a tight stop loss as a failed break of the bottom pennant support/ now resistance line could mean a return to the 1784 range
''Buy Big Sell BIGGER'' - MegaWhale

ONEUSD ATH retest incomingONEUSD printing higher highs after hitting its all time low back in March 2020.
The main basis for this bullish bias is the recent golden cross (DMA 50 and DMA200 crossing over) that occurred on February 6th. Last time this happened was on July 1st, when the same pattern occurred and sent prices up 270%.
A new golden cross pattern forming up right now could send prices to another 270%, which coincides with the ATH level.
The RSI appears slightly oversold, if prices retest the 0.0084 Fibonacci level (lowest green line) it'd offer an excellent opportunity to get in. If prices clean break the second lowest Fibonacci level, at 0.00128, instead of retracing, the long opportunity should still be considered as prices would be rallying towards the ATH target by then.
Good luck to everyone out there.

$gsx - gap to fill, making its way back to pitchfork medianno real resistance until 99 area.
lets see if the death cross can become a golden gross once again....
on watch this week

$Mine Golden Cross #Shroomboom Mine Golden Cross in play. Going to see allot of volume coming in and price will move fast. Hold long on this one and you will be rewarded greatly.
#Shoomboom is starting and its only the beginning.
Please give a like if your as excited as i am.

$Mine Golden Cross #ShroomboomMine Golden Cross in play. Going to see allot of volume coming in and price will move fast. Hold long on this one and you will be rewarded greatly.
#Shoomboom is starting and its only the beginning.
Please give a like if your as excited as i am.

$Mine Golden Cross Mine Golden Cross in play. Going to see allot of volume coming in and price will move fast. Hold long on this one and you will be rewarded greatly.
#Shoomboom is starting and its only the beginning.
Please give a like if your as excited as i am.

FLT - Retracing Nicely towards Support.FLT seems to be retracing nicely to the trendline Support at around $12.80, as it has shown strength previously also, and made a Higher High. We can also see that it has made a Golden Cross, with RSI about to reach the the Oversold region. The High Profile Volume Zone lies at around $13.80 and 200 SMA in the Buy Zone between $12.80 - $13.80 (many Confluences). I think the Green Box should provide good support, and I expect a bounce off from that Zone.
If it does bounce off, we can expect it to go towards the previous highs giving a potential return of 40% at TP.
Please note these are my own notes, for my future reference only. By no means trading advise to anyone. Please do your own research before entering into any trade.

ETHBTC More on the Inverted head and shouldersMy Exhortation
A few more people are talking publicly about this inverted head and shoulders, which is good. The fact that it hasn't taken over some of the crytpto-verse is a bit unusual considering how recognizable the formation is and how quick ideas can get around these days. Please, do you own analysis and if you agree or disagree post an idea to get the conversation going. I have seen a lot of ideas or youtubers mention specific parts of it but few are talking about this big picture. I have been going on about it privately since early December and publicly since the week of Christmas. Generate some ideas. This should go around like the BARR bottom on BTCUSD in April 2019 so we can all make some money (not financial advice)
Analysis
A new addition to my posts on the inverted head and shoulders is including the 50 and 200 week SMAs onto the chart by using the cm_ultimate to get it on the daily chart. Price action initially stalled and pulled back after coming out of the falling wedge like a beast on pre-workout. We have finally seen price action pop above and now the question is how far will it run before it needs a retest of the 200 week, or will it even need a retest of the 200 week?
Some basic analysis of the VPVR has a low volume node between 0.44 and a high volume node around 0.0500. This LVN is where I would expect a quick movement and consolidation would happen at the HVN. I would expect this to be a relatively quick consolidation compared to the longer consolidation I expect to happen at the green area at the next low volume node. The green area is where we can no longer count on the inverted head and shoulders for target setting with some leeway for under and over performance.
Below is a wider view and what happened the last time there was a similar situation on ETHBTC. This time the 50 and 200 period SMAs match the chart on the 3 day which gives us a good intra-week view. I also like what I see on the Average True Range confirming that a low is in.
Timing-wise I don't know how long the price action will consolidate on top of the 200 week and I don't know how long we will be at this high volume nodes. What I do suspect is we will have a golden cross on the weekly in less time than it took us to have the death cross and then the valley on the 50 week SMA. Maybe six months.
Conclusion
This is a major move. I mentioned the BARR post that took over the crypto-verse in April 2019. My first linked idea was a reminder I did when the crypto-vese moved on and people forgot about the long term moves and they were back to the 4 hour chart. This inverted head and shoulders make still take over six months to reach target and you can get blow out either way with poor risk management. I myself didn't make anywhere as near as enough money as I could because I closed my longs too soon and that was a major lesson for me to see the bigger picture as I trade and invest. Letting your winners run is a very hard lesson to learn. You can have whatever strategy you want but my bias is toward ETH and other premier alts over bitcoin until this formation plays itself out.

GOLD - triangle breakout.Preconditions :
- Local downtrend
- Triangle breakout
- Made a false breakout / Retesting the support level
Push like if you think this is a useful idea!
Before to trade my ideas make your own analysis.
Write your comments and questions here!
Thanks for your support!

$MINE Golden cross on the 1 hour chartThe hourly chart looks like we have a golden cross coming the next day or two. A golden cross is extremely bullish and price goes parabolic.
#goldencross #mine
Give the chart a like if you like what you see!
