potential inv head & shoulders could double ADA's current priceCardano has been taking a bullish upturn recently along with much of the alt market. . .but if it can trigger a breakout of the current inverted head and shoulders patern on it's 1 day chart, it still has the potential to double its current price. Current 1 day stochrsi is alreeady over extended so it may meet resistance for a few days or so at the neckline before finally breaking upward but considering its had its golden cross sustained probability is inf avor of a validated breakout before too long. target 17-18 cents.
Goldencross

OMGUSD looks ready to trigger Adam & Eve double bottomOmisego is another fundamentally sound alt that has recently had a golden cross on the daily chart..it is now above the neckline of its adam and eve double bottom pattern too and looks ready to have a bullish breakout.

LTC is leading the market/giving hints at what btc will doAfter looking closely at the parallels between LTCs price action after it's 1 day golden cross, and BTC's current price action, I'm convinced BTC is taking a very very similar path that LTC has taken and that LTC is leading the market and can be looked at to get a clue of where BTC wiil soon head. For example, from the point of LTCs 1 day golden cross in March to when it finally saw a correction, the price action rose 118%. If we measure a 118% increase from where BTCs golden cross occurred we get a range of around 9.9k we also conveniently have a very valid horizontal resistance line at that range that if we did wait until then to correct we would have the set up for a very valid looking and massive cup and handle on btc. Exactly like we are currently now seeing LTC do. As soon as LTC corrected it began forming its inverted head and shoulder handle as shown here on the chart. It also corrected 31% which if btc continues to follow ltc from there it tells us btc could correct after hitting that horizontal resistance line from 9.9k all the way back down to that 6.6k range. it would then spend 1-2 months creating a handle to that cup before it finally broke back above the neckline and at that point if it triggered a breakout from there the breakout target would be 16-17k! As we can see on LTC it is now throwing wicks above its cup and handle neckline and if it were to trigger its breakout it will more than double in value from where it currently is now. All of this potential price action also finds further confluence with the breakout target of the total market caps falling wedge that we charted way back in February thats target would essentially cause the total market cap of crypto to triple to quadruple. We are ow almost halfway to the total market caps target with still plenty of room to go up. You can find that chart in my archives. Anyways keep a close eye on the correlation between LTCs price action and BTC's because I have a strong feeling LTC is going to be giving us hints at what BTC may also do.

SOLVE cup and handle + Golden cross soon, ultimate buy!Hello,
First of all, please take a look at the fundamentals and the great development team of Solvecare, this a great project for the long term.
Second, look at the chart! There is a clear cup and handle pattern forming and I believe that we will experience a golden cross soon, this wil take us to the goal of 0.0005367 BTC and eventually 0.00006547.
I call this a low risk, high reward potential investment.
Trade safe!

BTCUSD: Bears Are On Holiday! Crypto Market Cap just passed +$200 billion.
Bitcoin Target 1 & Target 2 done.
Fibonacci Retracement 61.80% reached.
Elliott Fifth Impulsive Wave in process.
Golden Cross MA200 & MA50 done.
Relative Strength Index (RSI) bullish.
Bitcoin Hits 8-Month-High at $6,785.
Bitcoin Surges +118% since 15/12/18.
Bears Are On Holiday!

FTSE 100: Approaching a short term support. Potential bounce.FTSE 100 is close to complete the -5.30% decline after being rejected on the Lower High of the 1W Channel Down (RSI = 49.506, Highs/Lows = 0.0000). The Golden Cross (MA50 over MA200) on 1D was the signal both on the Lower High and the one on the late May 2018 All Time High. 1D is fully bearish (RSI = 33.998, MACD = -8.850, Highs/Lows = -159.7305) even oversold on the stochastic trade action, meaning that a relief rally should follow. With MA200 supporting we are targeting 7,400.
** If you like our free content follow our profile (www.tradingview.com) to get more daily ideas. **
Comments and likes are greatly appreciated.

EOS - LONG- Bitmex - Golden CrossA golden cross on the daily chart.
RSI looks good, above the 50 level.
Target: 1.618 fib level
Low Lev, max 3X

AUDUSD at Resistance*You can see price is at resistance.
*And a GOLDEN CROSS. which indicate soon downtrend.
*if price hold below resistance then go short.
* double top
HIT LIKE IF YOU LIKE MY ANALYSIS

GOLD RUSH, WHO'S READY?Okay guys, bit of a confusing one but on the daily chart gold has been travelling in a horizontal channel marked out with the blue rectangles, we recently saw a move from bottom to top and as it was it formed an ascending channel, we saw a false breakout of the channel to the upside at the top of the channel however it dropped back into the channel.
As of now price just hit the bottom of the channel and its making its way up, we believe price will test the descending trend line that is marked out in black which lines up with the 0.618 perfectly and make its way down to the -0.27 extension level. THAT MEANS THE ASCENDING CHANNEL WILL BREAK!
IF PRICE HITS STL , PRICE WILL MOST LIKELY FOLLOW THE RED LINE.

XMRUSD Golden CrossXMRUSD Daily chart Golden Cross. Falling volume looking like a bullish spring for price.

EMA golden cross on the daily (BTC 4/30/2019)A look at the daily shows another bullish indicator. Will BTC bounce? Only time will tell. The cloud over the weekly is scary. But I am seeing more and more bullish indicators. Im optimistic

Massive increase in short positions after golden crossInteresting. Massive increase in shorts after such a widely followed bullish technical indicator is triggered.

BTC DOMINANCE IS IN THE RISING CHANNEL. BTC.D MIGHT FALL Hi everyone.
We are in the btc golden cross period. And It is very bloody for altcoins.
Altcoins has lost huge amount of their value in this period.

Bullish S/R flip and DMA Golden Cross on UPS.UPS is currently building support on top of old resistance around $112 (which confirms the bullish support and resistance flip), and is consolidating in what looks to be a bull flag-like pattern. We also have a daily golden cross (50 day moving average crossing the 200 day moving average) and we could see the momentum continue to carry this stock higher. R/R is pretty good here, but I've had what I thought were good setups turn south pretty quickly (EA and SQ for example), so be cautious and use proper risk management if you decide to take this trade.
Moving average guide (All daily for this post):
50 day moving average in Green.
100 day moving average in Yellow.
200 day moving average in Red.
Entry: 112.30-114.50
Target 1: 118.00
Target 2: 120.60
Target 3: 125.00
SL: 110.50 (below the 50 and 200 day moving averages, and below our support zone at 112.)
-This is not financial advice. Always do your own research and own due-diligence before investing and trading, as for investing and trading comes with high amounts of risk. I am not liable for any incurred losses or financial distress.


The Actual Golden Cross Hasn't Happened Yet - EMA50/EMA200Good day Traders
Bitcoin price action has been showing exhaustion for the past few days now so not too surprised that we finally corrected. Perfect timing for the tether FUD to act as a catalyst again, although this time things are a bit different it seems.
If you recall in October 2018, when Bitfinex lost yet another banking relationship, everyone piled out of USDT into other stable coins, and apparently into bitcoin, spiking BTCUSD to $6750 in a matter of minutes. This time round there hasn't been that rush into BTC, in fact quite the opposite, maybe people are starting to become immune to tether FUD after the upteenth time!
The New York Attorney General seems to be on Bitfinex's case about a $850 million shortfall which was covered using tether holdings, although this is all narrative yet again imo unless Bitfinex is actually in financial difficulty which I find quite hard to believe based on recent trading volumes at the exchange.
Most traders have been watching for the daily SMA50/200 golden cross when this actually gave us a false signal in 2015 on the 1st attempt with price crossing back below both moving averages after the first attempt before finally crossing months later. I believe we have the same situation today.
If you go back to 2015, a more reliable golden cross was actually the daily EMA50/200 . Whereas SMA50/200 had a failed cross on the 1st attempt, EMA50/200 hadn't actually crossed on that attempt, instead we had EMA50 kissing EMA200 before dropping back and the only cross we had was the actual buy signal. Today, we currently have EMA50 kissing EMA200 but we probably won't have the golden cross just yet for a few months to come imo.
Looking back we seem to be printing a large bear flag with a flag pole reflecting a 63% drop from the pole height to our 2018 lows. I suspect we have 3 options here depending on which support holds, although I still believe the 3rd option is most viable:
1) Bitcoin drops back to and finds our uptrend support around $3800 before going on to print a higher high.
2) Bitcoin drops below our uptrend support back to the trendline resistance turned support from our ATH, somewhere around $3300 before breaking back above our prior uptrend support and the $4-4.2k horizontal resistance.
3) Bitcoin breaks down from bear flag support. The target is based on the same pole height from the recent $5600 resistance which gives us a target of around $2k. From $5k, I think we head back to our $4-4.2k horizontal support for a failed retest. After $4k doesn't hold, $3800 will probably not hold either and we'll head back to support of our main trend line from our ATH which we broke above in March, to somewhere around $3300. We should bounce from $3300 back to our $4-4.2k horizontal resistance and flag support turned resistance, in the process printing a right shoulder of a larger H&S pattern which will have us targeting $1850 - $2100 after breaking neckline support.
Both targets coincide with strong horizontal support around $1850 and a 1.214 fib extension of the flag pole height, although we could potentially have a 1.382 fib extension wick down to $1k with enough sufficient panic since we only had a 38.2 fib retracement recently.
We also have strong sell signals on the daily NVT, the weekly NVT, with no buy signal yet, and we're just about to have a bearish DMI crossover with strong ADX trend!
Good luck and happy trading!
Here is the 2015 scenario. Notice the EMA 50/200 cross, the 1.272 fib extension, the NVT buy signal after bottoming, and the 60% drop from bull trap highs :

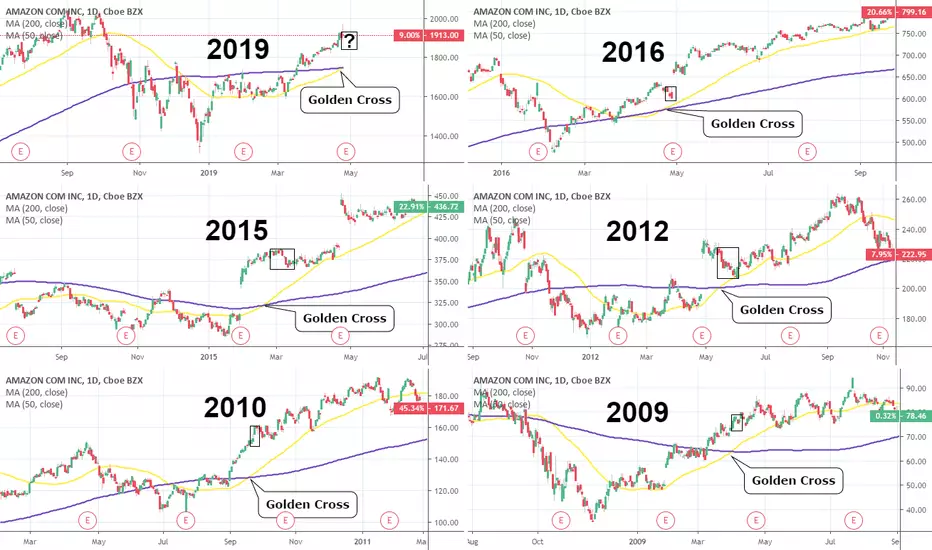
Amazon: Golden Cross spotted. How did this trade in the past?AMZN posted a Golden Cross formation on 1D (MA50 crosses over the MA200) yesterday following an impressive EPS. Technically this is a heavy bullish signal.
It is productive to look at how this pattern traded in the past. Since the 2008 Sub-prime mortgage crisis this pattern has been printed another 5 times:
* In 2016 it emerged shortly after a Death Cross (the opposite formation) and after an initial 4 day pull back it gaped up aggressively.
* In 2015 it emerged shortly after (around 20 days) a gap up and after an initial pull back and consolidation it gaped up again aggressively.
* In 2012 it emerged again shortly after (around 20 days) a gap up and after an initial pull back and consolidation it rose aggressively. Note that the candle action is quite similar to the 2019 setting in duration and formation (Death Cross followed by Golden Cross).
* In 2010 it emerged after a strong bullish run, consolidated and continued higher on a steady Channel Up.
* In 2009 it emerged after the 2008 crisis bottom was formed (a little over 4 months), and continued higher on a steady Channel Up. Note that the candle action is quite similar to the 2019 and 2012 settings in duration and formation (Death Cross followed by Golden Cross).
As you see in all cases AMAZON rose significantly after the occurrence of the Golden cross. In 3 out of the 5 cases the price even pulled back on the very first few days, so if that happens again it shouldn't mislead investors. Also in all cases the formation occurred after a Death Cross, with 2015 being the longest, 2016 the shortest and 2012, 2009 very similar to the current (2019) candle sequence.
Taking into account all the above, we are remain bullish on AMZN targeting initially 2,040 and 2,300 in extension.
** If you like our free content follow our profile (www.tradingview.com) to get more daily ideas. **
Comments and likes are greatly appreciated.
Bitcoin Price Action Update (day 343)Disclaimer: If you are primarily interested in copying other people’s trades then this is not for you. However, if you are willing to put in the work that it takes to learn how to trade for yourself then you have found the right place! Nevertheless please be advised that you can give 10 people a profitable trading strategy and only 1-2 of them will be able to succeed long term. If you fall into the majority that tries and fails then I assume no responsibility for your losses. What you do with your $ is your business, what I do with my $ is my business.
Click here for my Comprehensive Trading Strategy | Click here for my Comprehensive Trading Process
Consensio: S EMA getting close to crossing L EMA
Patterns: Bottom of descending triangle is at $5,800
Horizontals: R: $5,589 | S: $5,306
Trendline: Kind of looks similar to gold with a long term bull TL starting from the top of the price with a recent broken bear TL.
Parabolic SAR: $5,115
Futures Curve: Backwardation
Funding Rates: Longs receive 0.03%
Shorts: Really starting to increase
TD’ Sequential: Coming off G9 + bearish spinning top
Ichimoku Cloud: Daily starting to C Clamp. Weekly stilll without bullish TK Cross.
Relative Strength Index: W: 60 | D: 70 with bear div
Average Directional Index: Daily showing strong signs of exhaustion. Looks very similar to BTC selloff to $3,000.
Price Action: 24h: +1.01% | 2w: +8.94% | 1m: +40.69%
Stochastic Oscillator: D SS & W OB
Summary: The golden cross is incoming and the price is pulling back into it, however I am awaiting further confirmation before buying. The market is heavily overbought and I believe it is due for an extended correction (1 month+). Furthermore we recently had a news development that could be very significant.
The current market structure is very much an inverse of what we saw during the selloff in December of 2018. First notice the bull divergence on the RSI that occured from November 24th - December 16th. That occurred right alongside two daily red 9’s. We currently have a bear divergence following two green 9’s.
The Average Directional Index is also showing striking similarities. Spiking above 70 and then rolling over right as the bear divergence was taking place. This tells me that we are in for another extended period of consolidation.
If that occurs between $4,200 and $5,600 (what I think is most likely) then it will likely cause the 50 and 200 EMA’s to cross back and forth which would whipsaw anyone using that signal to enter / exit. If instead we consolidate between $4,700 and $5,000 for a few weeks then I will likely be a buyer. That would mean that the price is staying above the 50 and 200 EMA and a whipsaw would be much less likely.
Something else to pay attention to is the CME futures expiring tomorrow. The price has a strong propensity to experience volatility following expiration of CME futures despite the small relative volume. Perhaps this is a result of crypto exchange volume being largely fabricated , as was argued by Bitwise Asset Management last month. If that is the case then the actual volume on the CME futures could be far more significant than many realize.
Earlier this afternoon it was announced that the New York Attorney General will be prosecuting Bitfinex . The allegation is that they commingled client funds to cover up a $850 million loss. The NY AG maintains jurisdiction because he believes Bitfinex has been servicing clients in the state of New York.
The price fell 8.5% in the 30 minutes following the press release. Now it has started to stabilize around $5,000. It will be very interesting to see if that support can hold much longer despite the overbought conditions and negative news.

Perfect Rejection Played Out ? What will happen now ?Hello Hoomans.
I'm making a part 2 of my TA because my previous call was perfectly on point, so i'm here to catch up with you guys.
As you can see on the daily charts both of the sticks got closed below the line showing a great resistance in the weekly and daily chart, and that was exactly wat i called on my previous TA (test of the 100MA weekly & 350 daily)
At this point i'm very confident it is topping out but i'm not leaving out any retests at this point, if bitcoin holds support at the 5350-5400 there is a big chance that may happen.
Please like & subscribe so i can keep making TA's & Positions
MY PREVIOUS CALL:

Bitcoin (BTC) Chart Shows First Golden Cross Since 2015Bitcoin's 50-day moving average officially crossed above its 200-day moving average on Tuesday as the price surged to $5,600.

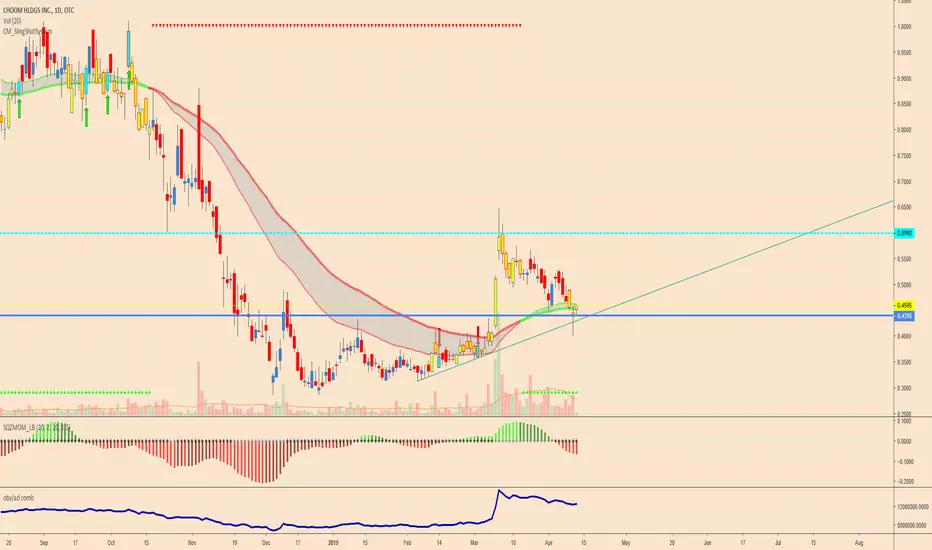
$CHOOF - $ACB LARGE STAKE - MJ PLAY - 4/20$CHOOF - $ACB has a large stake, MJ play for April before the 4/20
Low float runner could go ballistic to dollars, slingshot daily is now in a confirmed uptrend. Golden cross is imminent.
NULS/BTC - Setting up for potential 62% upswing soon!I am seeing several bullish signals in the NULS/BTC chart here that I would like to share with you. Most importantly we have a golden cross with the daily 50 EMA crossing above the 200 EMA. We also see price maintaining above the volume profile POC and a few huge spikes in volume that signal major accumulation. This one has potential to go much higher than the targets I have listed but I would be locking in some profit at those levels.

BTC Pushing higher... again! Golden Cross! Resistance incoming?Last chart we were sitting down around $5200's and ideally looking for BTC to hold that support area between $4900-5200. Bulls continue to show up and were able to get another push higher. I am changing to daily time frame now as BTC is really starting to look good again.
Only near resistance I had left on my last daily chart posting was up at $5665 (a previous high from back in November) and the move last night came within $15 of touching that level. Assuming the bulls are eventually able to break through that level, I will be watching a fairly decent range of what I anticipate will be heavy resistance. I have outline it within the colored box and it runs roughly between $6,000 and $6850 where BTC sat range bound for over 2 months in late 2018. Other things worth noting here on the daily chart. Supports are there and outlined a few key levels (green lines) with $4778 continuing to be crucial level but would love bulls to hold $4945 (or call it $5000 for those who enjoy more rounded/key levels). Also keep a close watch on daily 12 EMA. Bulls have held this as support for nearly a month now which is very impressive. And lastly we saw a Golden Cross occur (highlighted with the circle)... this has not occurred in BTC for years and should be a bullish sign. Lets see if the bulls can keep the climb, maintain their supports and start testing this box of resistance above!
Just My 2 Sats!
