Bitcoin (BTC) MA Death/Golden Cross Analysis (Part 10) --> +40%Welcome to my 10th segment in my golden/death cross live trading analysis series! My strategy is simple: trade the waves and lock in profits. We're making USD on long segments and making BTC on short segments. Forget trading on the absolute highs and lows, we're trading on reliable signals that have been successfully backtested and confirmed in this analysis! Don't believe me? I'm not calling shots after the fact, so go back and see the other trades. We've lost money on a few but have made a lot more than we've lost!
We're still on our 5th segment here, and the metrics are as follows:
Segment 5
04/08/2018 - BUY $6,900
04/25/2018 - SELL $9,000
TBD - BUY TBD
Beginning ($): $10,700
Ending ($): $13,950
Beginning (BTC): 1.55
Ending (BTC): TBD
This was by far our longest bull run here, and we locked in a bunch of profit because of our previous gains against BTC! Let's keep up this magic! Stay tuned for my live trades!
Goldencross

DNTBTC short-term (slight pumps ahead)Back to DNT/BTC after its peak 1050. Now I see the chance to pumps up slightly with the golden crossed.
Why "slightly" cause I see RSI isn't having much room for growing.
The support line of the symmetrical triangle works well, aslo for the RSI.
Stragtegy:
- buy area is from 900-980
- stoploss 850
Target:
- target 1: 1070
- target 2: 1401
Happy trading!
Linh,

~ Golden Cross ~not every same patterns make same result. dont be afraid with 2014's patterns, we just should be careful to take action. thank you ^^

ETHUSD - Golden Cross vs Bearish Gann Fans, Volume, MomentumIt's a battle! MAs vs massive downtrend, who will win? We should know very soon!

A golden cross has just appeared!Look at how the 50-day EMA (blue line) crosses from above the 200-day EMA (red line), forming a golden cross which is a sign of the bull market.
Trade safe!


Adam & Eve + Golden CrossHi all,
Salt has been in a downtrend for a long time like most of the altcoins and price is a real bargain atm. It retraced all the way down and uptrend is ready to begin.
Adam & Eve formation is about to be formed ( better on dailiy chart ) and there is a golden cross on 4h.
Volume increase is also seems great.

ON WATCHGolden Cross pending on hourly w/ + Momentum ready to begin on daily and MACD pointed up on 0 is an overall good technical indicator. Volume profile matches typical H&S.

Bitcoin (BTC) MA Death/Golden Cross Analysis (Part 8) --> +7%Welcome to Part 8 of my BTC tracking analysis. I'm using a simple wave analysis to capture gains while BTC continues to decline in price. At the beginning of this, I outlined that this is my only investment in the crypto market, as altcoins don't tend to do well when new money is not flowing into the market. Some have done well, but this is much riskier than the method that I'm using here. At the end of our last leg, we were up 55% on BTC and we're not up 7% against USD.
Segment 4
04/01/2018 - BUY $7,150
04/04/2018 - SELL $6,900
TBD - BUY TBD
Beginning ($): $11,100
Ending ($): $10,700
Beginning (BTC): 1.55
Ending (BTC): TBD
The MA is flat now, so this may also be a short segment depending on where the price moves here! Follow along and trade!


Finally seeing bearish priceaction post deathcross; bearpennant?It was confusing to me why there was such an unexpected bull surge recently immediately following the death cross on the 1 day chart on bitfinex. We climbed almost to the last recent climb but couldn't attain a higher high above it before now finally seeing a bearish reversal...This may be because even though the 2 moving averages have crossed on the current day candle...those moving averages can be moved until the current 1 day candle closes and then their positions for today are set in stone....so maybe it was a last ditch effort by some big holders to somehow take us high enough to push the death cross back apart before the 1 day chart closes 8 and a half hours from now. That would unfortunately take about 5 times the bull impulse we've currently seen which now that we've turned back around without even surpassing the last high seems unlikely which should set the death cross into stone by the time this 1 day candle closes. We are currently forming an equilateral triangle with price action that will likely be a bear pennant and once todays 1 day candle closes and sets the deathcross in stone on the bitfinex map will likely cause all other exchanges where the deathcross has yet to happen yet to occur....this will create a bloodbath on April Fools day with people thinking bitcoin is doomed...however I think that will be cryptos Aril Fool's Joke....I still hypothesize that it will only dip to the price level of the low we reached on february 6th (5700-5900) which I think will trigger a massive double bottom at that point and see us skyrocket back up and into the bull market just in time for the second quarter after triggering a goldencross soon thereafter....this is all just a gut instinct and is in no way shape or form meant to be taken as gospel or financial advice. We will soon see in the next couple days. Make your own decisions, choose wisely and good luck!

ELF Marines are ACCUMULATING this 100% gainELF Marines are ACCUMULATING this 100% gain
Elf has entered accumulation zone and it has proved to be quite resilient here. The 200 and 50 MA are positioning for a golden cross. ELF MARINE!!!

Bitcoin 4hr Golden Cross, bullish action but can it hold? [BTFD]So as our amazing TA expert Tom predicted we have a swing of the MA's creating a golden cross on the 4hr chart on BTCUSD
I made this chat for the daily about a week ago, with a few predictions, just wish i published it earlier now (12th Match)
we had some bullish divergence which brought the level up to over $9k but its not pushing over that, 9300 was my next test which still not touched.
my last shorts got closed and opened up some new ones around CMP, so short term im bearish and looking for a another monthly low and long term Bullish, just dont get cought out in the bull traps right now
if your a swing trader Bitcoin must be sending you nuts right now
here is what im going on with wave analysis...
"If Bitcoin can get above resistance at 9620-10K this could open the door to further gains - and it would also make it very likely that the wave 2 correction is complete, and that a wave 3 move higher is starting "
good trades all

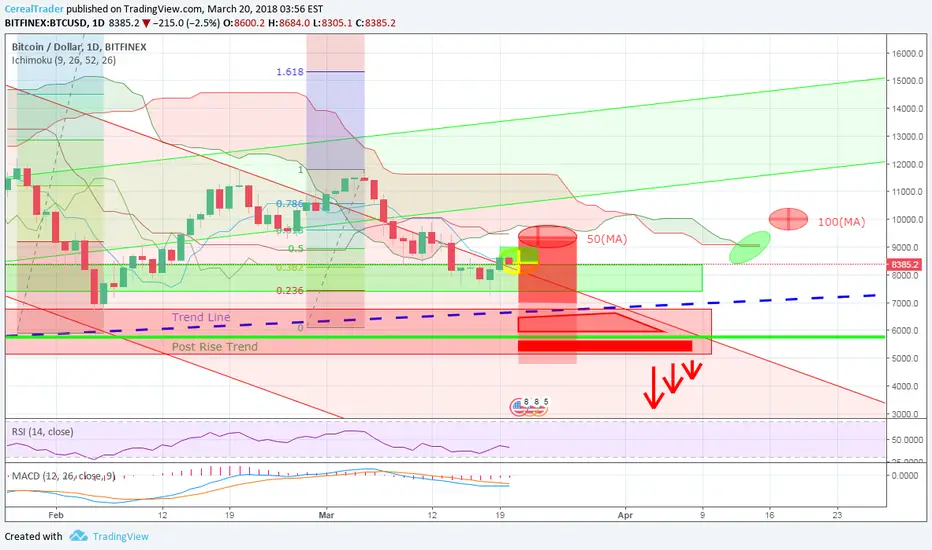
Bitcoin - Support Zones/Future DirectionSupport analysis of both, the previous parabolic move as well as the current slow decline, show areas of support aligning along with impending doom. Currently holding 0.382 Fibonacci, the area below is vulnerable up until the Trend line . At this point an expected rise from the Golden cross approaching within hours (200MA crossing below the 50MA, indicating short term trend upwards) on the 1hr chart along with the longer Weekly chart indicating doom with both the 50(MA) as well as the 100(MA) impending Death Cross (50MA crossing below the 200MA, indicating large waterfall drop, or couple days of trending downwards)
The necessity that these cross-overs must occur before uptrend can be established is nothing new although the alignment/strength of both the 50(MA) and the 100(MA) cross-over within close proximity, along the 1hr Golden Cross reversing within this time period to another Death cross, could be a triple threat add pressure to trend downwards.
Ichimoku cloud squeezing price range under $10,000 and seems it would take rally similar to last to enable support from this indicator, with volume stagnate, only rising in bursts, realistically 2 times lower then needed, this is currently not possible.
RSI currently holding 40, small room with the golden cross approaching before being oversold. Would expect large rise in RSI and price to rebound after/during cross leading along trend line .
MACD would need to see some price action to cross-over into positive rise, this could be possible if the Golden Cross plays out, could push price higher during this short few day period although the divergence appears to be slowing.
Taking a monetary view of the market, USDT trading was very slowly being replaced with real USD, volume non-existent, FUD, the only "support" channel seems to be along the trend line . this would increase pressure on this support in such a weak and reactive market and only a sharp incline in price would allow Investors back in (Investors don't buy dips, they buy on the rise).
Underlining the whole situation is trader's don't believe in the underlying technology (if anything only bitcoin -2.58% ), announcements are being held back until dust settles and constant FUD right at critical support levels. Although the technology hasn't changed from last year, the market has. It seems all indicators are at lowish levels in which a market with "legs" would jump on, but carnivorous nature of this risk built market would ensure lows are low and highs are high.
Short term trade, wait for the indicators to mature and align with others, a rise should be expected within the Golden Cross up until the Death Cross comes into play (50MA expected 23rd March), Alt coin funds will be indicator of reversal, flowing heavily into tether (USDT) and BTC at this stage. One indicator that I don't have access to is if large enough funds have a Fake-out planned...and can pull it off...and hit stop losses. A correction would still occur, long term hold your ground, the market will survive.
BTC -2.62% is seeing some tough times , so I should write this:
***Education Purposes only***
DDD: Buy the breakout and the crossoverBackdrop
Since the positive pre-announcement of last week, the stock has popped and broken its up-channel resistance at $12.
All the while, the SMA 50 has crossed the SMA100 to the upside, providing a "golden-cross" positive cross-over setup.
The stock has since given back some 8% - Been waiting for it to consolidate towards the resistance-turned-support.
Trade setup
Today, it looked compelling to buy the shares, which were further consolidating in a weak market.
Purchased DDD at $12.15, just above the support.
Expect the target to be reached in 4 months.
Risk analysis
Target $16
Stop $10
R/R 2x

ARN up trend opportunity!Welcome to everyone!
ARN has been looking for a break out and it finally happend!
Now there are 2 profitable scenarios that might happen in the future, which I will only trade based on the price action on that very moment since that can still have a enormous impact since this
is a very speculative trade setup. Trade setup 1, we go in a uptrend and we find our higher low which is likely to be found soon since the RSI and EMA's are indicating on a overextended up movement combined with a Doji indicating a shift in the buying and selling power.
Trade setup 2 is that we completely ignore the potential up trend and go back to sideways movement at the previous bottom which acted as a strong support for a fairly long time period. For each of these setups there are stop losses and buy zones. You could trade both setups but I'd suggest
Going on the lower end of the buy zones if you are going to attempt that, to lower your potential risk of losing funds.
Trade setup:
-The trade is based on the golden cross of the EMA 100 and 50
-Break out of the pattern indicating a opportunity for a uptrend
-Support and resistance areas which are crystal clear
-BB over extension and short term uptrend confirmation
-Risk vs Reward ratio
A more aggressive, simplistic and overall speculative trade which is different from my normal trades but it might just pay off, lets watch what is going to happen in the coming weeks!
I'm not using a large volume for this trade since the risk/reward is great because of the step outside my normal trading strategie.
All information found here, including any ideas, opinions, views, predictions, forecasts, commentaries, suggestions, or stock/cryptocurrency picks, expressed or implied herein, are for informational, entertainment or educational purposes only and should not be construed as personal investment advice. These are not facts but my personal views and opinions.
I will not and cannot be held liable for any actions you take as a result of anything you read here.
