BITCOIN : Moon SignalHi everyone,
Let's show some positive news!
The trend shows us that we probably started a new BULLISH Trend :
We get an amazing GOLDEN CROSS that appeared very recently... Each time we get this Golden Cross, we has started a great bullish trend and for sure, ALTCOINS will follow (after a little delay).
Anyway, I'm waiting to see a very hard and fast correction (US recession?) between the end of 2023 and the spring 2024. Just a normal part for a cycle market...
Let's get the ball rolling!
Stay safe!
PS: it's not a Financial Advice.
Goldencross

Shopify Macro Pattern Bullish Until Proven OtherwiseHi Guys! This is a Macro Technical Analysis on Shopify (SHOP) on the 1 Week Timeframe.
Its to add to my previous analysis while keeping it brief and concise.
Recently we Broke through and confirmed BELOW both the Uptrend Channel and the 21 EMA.
Normally this spells TROUBLE, especially if we confirm BELOW 21 EMA, as this moving average normally holds SUPPORT through BULLTRENDS.
Even more so that the MACD has crossed BEARISH as well.
However digging deeper, its seen that the channel and 21 EMA break was followed by DECLINING VOLUME.
Normally, for Trend Reversals and for the direction of a trend to actually go that way you need a spike in VOLUME.
(Watch VOLUME in the coming weeks. Can give us hints to what will come next.)
Comparing our current move to previous moves, look to "Similar Pattern". It may be probable that we just move side ways before continuing our UPTREND.
Notice how to the T, our current move follows the previous example. The 21 EMA is also flattening out, indicating this sideways movement.
Another likely scenario, if volume picks up can be a test of the 50 SMA (Green moving average).
BUT provided this Weeks candle closes ABOVE we are testing support. So if we can stay ABOVE this, 50 SMA is less Probable. So pay attention to this weeks candle close and for CONFIRMATION.
Also NOTE we have had a BULLISH CROSS of the 21 EMA above the 50 SMA.
Along with how previous history BUllish move played out.
This makes me think we are in the Early phases of a BULL run in Shopify.
This is NOT a DEFINITE, Sure thing but we may be mirroring the "Similar Pattern".
But always remember that things that happened before does not have to happen again.
I think other than Volume, another MAJOR thing to watch is the MACD.
Particularly, the main focus should be staying ABOVE the 0 level.
Going BELOW 0 level, may indicate further price DECLINES.
So watch how the Histogram bars shape up, we want smaller RED bars that change to a lighter RED color. Eventually would like to see GREEN bars in the coming weeks. That would give confidence that BULLISH momentum is coming back to Shopify.
Take a look at how the MACD shaped up during the "Similar Pattern". If we stay ABOVE 0 level, all is good.
Keep that in the back of the mind as you follow the MACD.
RSI also gives some clues. The area between the RED & BLACK Horizontal lines, coincides with being BELOW 21 EMA.
If we are below the RED line, normally its a good area to add to your position during a BULL run.
The warning sign is if the RSI drops towards and BELOW the BLACK line, that would lead to further PRICE Declines.
Using both the MACD and RSI in combination will help remove false signals. If you see that the histograms are turning light red, to light green and the RSI curved back up towards and ideally above RED line. This would likely push Price back ABOVE 21 EMA, and continue our BULL Run.
I think this week, its important to stay ABOVE the SUPPORT line. Staying above may bring in more confidence.
__________________________________________________________________________________
Thank you for taking the time to read my analysis. Hope it helped keep you informed. Please do support my ideas by boosting, following me and commenting. Thanks again.
Stay tuned for more updates on SHOP in the near future.
If you have any questions, do reach out. Thank you again.
DISCLAIMER: This is not financial advice, i am not a financial advisor. The thoughts expressed in the posts are my opinion and for educational purposes. Do not use my ideas for the basis of your trading strategy, make sure to work out your own strategy and when trading always spend majority of your time on risk management strategy.

Crude going for bullish run check EMA going to push price to 95 in coming days.
50 crossing 200 very bullish
good risk management setup can bring best returns

Tesla Pullback Targets + Major Bull Signal NearingHi Guys! This is a Technical Analysis on Tesla (TSLA) on the 3 Day Timeframe.
So we are continuing the move on Target from our Rejection, our Downtrend held by the Resistance Trend Line.
A break and confirm above the Resistance Trend Line will indicate a "Trend Change".
Till then we are being pushed DOWN in track on hitting our Targets:
1. 0.618 FIB level, around $224
2. Blue Moving Average, the 100 SMA
3. Green Moving Average, the 50 SMA
4. 0.5 FIB level, around $200
Our 1st target is the 0.618 FIB level, but notice how the 100 SMA is hovering just below it. So its likely that we test both.
So the natural order of things is that when Price moves above a Moving Average, we need to test it as SUPPORT before moving higher. So this is why i believe we test both 0.618 level and 100 SMA, since we have not yet tested SUPPORT.
Watch how we interact with this moving average.
Depending on when momentum comes in (indicated by indicators), we may have a strong bounce here due to convergence of 100 SMA & 0.618 FIB and continue upwards.
For this reason, this would be my 1st BUY ZONE.
Also Note the 50 SMA:
We are currently curved upwards, indicating further movement UP. So this line is continuosly changing. Since currently its ABOVE 0.5 FIB level, this area would be my 3rd target to watch.
If we end up breaking the 50 SMA, we may go to the 0.5 FIB level. But for now its less probable.
A Major event is also nearing. The 50 SMA/ 100 SMA GOLDEN CROSS.
Notice on your own charts, how everytime this occurs, TSLA explodes in price.
This cross may also prevent TSLA from reaching the 0.5 FIB level.
We would need to keep an eye out on the Macro timeframes for further specifics as well.
To get details on the Momentum lets look at the MACD.
We have recently crossed BEARISH on the MACD. With increasing size and number of RED histogram bars.
We need to see lighter colored RED bars. Eventually seeing GREEN bars for momentum to change BULLISH.
Also NOTE -> I'd prefer the BLue/Orange lines stay ABOVE the 0 level, indicating the continuation of the overall BULL trend in TSLA.
The STOCH RSI -> Also a momentum indicator. We have moved below the 20 level. It's crucial to watch out for the BULLISH cross (Blue line over Orange line) back above the 20 level. This will indicate injection of momentum back into TSLA.
The RSI -> Notice our current pattern where the Orange line has CROSSED below the Black line. Normally this indicates Price Declines.
So watch where the downward curve of the Black Line and downtrend of Orange line stops
Look for a Bullish cross of Orange line getting ABOVE Black line.
And just to give perspective, the Price we are at right now while i post this idea. We are 20% cheaper from th current highs.
TSLA has out performed many stocks in 2023. So this pullback presents great opportunity. Continue to watch these levels. Take action accordingly.
__________________________________________________________________________________
Thank you for taking the time to read my analysis. Hope it helped keep you informed. Please do support my ideas by boosting, following me and commenting. Thanks again.
***Read my Previous Analysis BELOW From 08/03/23 For More Context!
Stay tuned for more updates on TSLA in the near future.
If you have any questions, do reach out. Thank you again.
DISCLAIMER: This is not financial advice, i am not a financial advisor. The thoughts expressed in the posts are my opinion and for educational purposes. Do not use my ideas for the basis of your trading strategy, make sure to work out your own strategy and when trading always spend majority of your time on risk management strategy.

Death-to-the-Golden Cross // BTC 100d-MA & 600d-MA During the previous 2 cycles, once CRYPTOCAP:BTC 's 100d-MA fell below the 600d-MA (death cross), CRYPTOCAP:BTC 's price proceeded to capitulate to at or near the bear market lows.
Once CRYPTOCAP:BTC 's 100d-MA moved above the 600d-MA (golden cross), the 100d-MA did not come back down below the 600d-MA until the following cycle's lows.
Moving now to the current cycle, CRYPTOCAP:BTC 's 100d-MA once again fell below the 600d-MA on May 13 2023. CRYPTOCAP:BTC 's price then proceeded to capitulate down to the current cycle's low (~$15,473).
Then on July 26 2023, CRYPTOCAP:BTC 's 100d-MA moved above the 600d-MA.
Now we just need to wait and see if the trend holds.
Confirmation won't be known until either the next bull cycle really kicks off, or if the 100d-MA is not able to hold above the 600d-MA before price can reach a new ATH.
Death to the Golden Cross

U - Bullish DivergenceU had been building a base since Last Sept (10 months in the making now) and had remained above its 200-day moving average since 6th June this year. We also saw a Golden Cross on 28th June. Hence the longer-term picture of U remains potentially bullish except that it has been very volatile since its first attempt to break above its basing neckline @ 42-43 on 16 June.
U has now broken up its neckline for the 3rd time (since 16th June) and once again, experienced another steep pullback (for the past 5 days). The pullback now appears to be stalling at the neckline and a bullish divergence is between its price and RSI is also emerging.
Could this bullish divergence be a clue to its earnings announcement (expected on 2nd Aug)?
However, bear in mind there is always an inherent risk to trade during earnings.
Should the stock be able to stay above its neckline in the coming days, then the odds have increased that it's uptrend could gain more stability (just hopefully though!). Meanwhile, buying the dips is still a safer way to approach this stock.
Disclaimer: Just my 2 cents and not a trade advice. Kindly do your own due diligence and trade according to your own risk tolerance and don't forget that money management is (probably the most) important! Take care and Good Luck!

CTRM Jumps Today Reports in the MorningOn the 15-minute chart, I see CTRM as being well-positioned among traders for
high volatility on the report of earnings. The pump today has printed a tight flag
pattern with consolidation this afternoon. If earnings are okay or even better I see
this penny stock making another 10-15% move just like today. If on the other hand,
if there is a miss, a drop of 5-8 % as a retracement could easily unfold ! The meat of
the matter, is reading the price action and volumes in the premarket and preparedness
overall. Stop loss 0.497 below the Doji candle. First target 10% second 15%

🔥 Bitcoin 3-Day Golden Cross: Begin Or The End Of Bull Trend?If you enjoy this analysis, please give it a like and a follow.
As seen on the chart, Bitcoin has now experienced a golden cross on the 3-day chart. A golden cross means that the 50-period moving averege (blue) crosses the 200-period moving average (yellow) from below, which is often seen as a bullish thing in the financial markets.
Seeing that we only have two datapoints, we can't really make a statistically feasable forecast whether the price will go up or down from this point.
Another way to look at it is to argue how the market looks. Does the market look like it wants to go on some crazy bullish move, potentially even make new all-time highs in the next 6-12 months. Or, does the market look like it wants to stabilize, potentially even correct after several green months.
With both bullish and bearish outlooks being plausible, I think a bearish correction over the next months is more likely than a bullish move.
Share your thoughts in the comments below 🙏.

USDJPY Bears Are ScreamingUSDJPY turned down exactly from 61,8% Fibo. resistance and after reaching equal wave length of waves W=Y of a complex correction. So, seems like bears are screaming and we should be aware of more weakness in upcoming days, especially if breaks below 139.10 region, just watch out for short-term pullbacks.

FUBOTV moves before earnings LONGWith upcoming earnings on August 4th, as shown on the @H chart, FUBO is moving.
The set of three EMAs (35/70/280) show an impending crossover the longest EMA
and a golden cross between the other two has already occurred. The MACD demonstrates
the bullish momentum. The dual time frame RSI has the low/green line crossing the 50
level from well below it and then the high/ black line in the 60 range another confirmation
of bullish trend strength. I can appreciate that other traders are anticipating a bit of
a jump in the event of an earnings beat. I will join that group. The target is the level of
the double top of mid-July. The stop loss is the level of the golden cross of the EMAs.
An identified options trade is the strike of $ 3 expiring 8/11.

📈Golden Cross and Death Cross: Decoding Forex Trading Signals📉
✅When it comes to analyzing the Forex market, traders often rely on various indicators and patterns to make informed decisions. Two popular patterns that can provide valuable insights are the golden cross and death cross. In this article, we will explore what these terms mean, how they can be identified, and how traders can use them to their advantage.
✅Golden Cross:
The golden cross is a bullish signal that indicates a potential uptrend in the market. It occurs when the shorter-term moving average, typically the 50-day moving average, crosses above the longer-term moving average, usually the 200-day moving average. This crossover suggests that the price is gaining momentum and that buyers are becoming more active.
Traders often interpret the golden cross as a confirmation of a strong market sentiment, leading them to open long positions or increase their current holdings. It is seen as a positive sign as it suggests that a positive trend is likely to continue.
✅Death Cross:
On the other hand, the death cross is a bearish signal indicating a possible downtrend. It occurs when the shorter-term moving average crosses below the longer-term moving average. Similar to the golden cross, the death cross is typically identified using the 50-day and 200-day moving averages.
The death cross can be interpreted as a confirmation of a negative market sentiment with increased selling pressure. Traders may consider opening short positions or reducing their existing long positions in anticipation of a downward trend.
✅Using Golden Cross and Death Cross in Forex Trading:
While the golden cross and death cross patterns can provide valuable insights, traders should not solely rely on them for making trading decisions. It is important to consider other indicators, fundamental analysis, and overall market conditions.
🟢Confirmation: Traders should look for additional confirmation, such as increased trading volume or other technical indicators aligning with the signal, before entering a trade.
🟢Timeframes: Different timeframes (hourly, daily, weekly, etc.) can produce different crossing signals. Traders should select the timeframe that suits their trading strategy and goals.
🟢False Signals: It is crucial to acknowledge that golden cross and death cross signals are not foolproof. In certain market conditions, they may generate false signals, leading to incorrect trading decisions. Thus, it is advisable to use them in conjunction with other technical analysis tools.
✅The golden cross and death cross are popular patterns used in Forex trading to identify potential bullish and bearish market conditions, respectively. These signals provide traders with valuable information about market sentiment, allowing them to make more informed trading decisions. However, it is important to use these patterns in conjunction with other indicators and analyses to increase the probability of success. Remember, understanding these patterns is just the beginning of the trading journey – continuous learning and adaptation are key to becoming a successful trader.
I hope this post was helpful to some of our beginner traders😊
Dear followers, let me know, what topic interests you for new educational posts?

DDOG of the DAQ?NASDAQ:DDOG is struggling to make new highs. It needs to hold this support. The doji that formed at the end of the day does not bode well for a breakout. Does this mean their dream to chase down NASDAQ:SPLK market share may have to wait?
Bullish Case - This is a tough level but not impossible. If they can add more value to shareholders, it can attract more investor support. Earnings are due sometime in August or sooner, so this can provide what we need to break out. 91.80 is not a bearish level to watch but a discount for bulls to buy in.
Bearish Case - Bulls are trying and failing all at once. How can there be a golden cross and yet no new high? That means we will retest the 50 and possibly the 200, which BOTH are below the bearish level that will become resistance when we break it. This gravestone doji will play true and destroy supports along the way as we blow past the 91.80 price.
Conclusion - Consolidation after having a very bullish signal is a sign of accumulation, but the bears hold serve by dishing out a gravestone at the end of the day. This is why 91.80 is both a support and the potential curse if price breaks below. Can the bulls keep the accumulation going for 3 more weeks?
Bullish above - 102.88
Bearish below - 91.80

Inv h&s on XLMUSD points to a .147 - .15 targetYou can see here on the 1 day chart xlmusd has formed an inverse head and shoulder pattern with it only just recently rounding out the 2nd shoulder and returning now back to the neckline. As always I must wait for a breakout confirmation above the neckline and some confirmation from volume before basing my buys off of this but I anticipate it will likely confirm in the not so distant future considering the recent move by coinbase to use stellar for USDC. I’m hoping to get a retracement too before a full breakout above the neckline in which case I will try to wisely piece meal buys on the dip. I have placed an arbitrary dotted measured move line where I think a potential breakout could occur in which case the target is somewhere aroun 14-15 cents. *not financial advice*

🔥 Bitcoin Bear Market Officially OVER - Golden Cross PartyIn this analysis I want to take a look at the 50-period and 200-period moving averages, plotted on the 3-day chart of BTC.
Historically, golden crosses (50-period crossing over 200-period) has always officially signaled the end of the bear market, meaning that there's no new lows to be made. This would mean that 15,500$ was the low of the current bear market and that a new bull-cycle has started. The blue and white line haven't crossed yet, but it won't take more than a couple of weeks.
I'm aware that this analysis has missed the bottom, but that's often the case with lagging indicators such as moving averages. This analysis is a confirmation of another analysis I made back in January where I argued that the bear-market bottom was most likely in. See below.
On the other hand, macro conditions are now vastly different compared to the other two golden crosses, so a new low is not to be excluded.
Nevertheless, I think that the most likely scenario would be that 15,500$ was the bottom and that we're going to trade within a 20,000-40,000 range for another year or so.
Do you think the bottom is in? Are we going to make new lows? Explain your thoughts in the comments 🙏

GNRC - trending upAnother typical example of a stock breaking up (into a new uptrend) after forming a base:
1. Broke out of the neckline and did a classic retest of this neckline a few days later, affirming the neckline as the new support
2. trading above it's 200 day moving average
3. Golden cross for additional confirmation that the stock is in "recovery"
Recent volume was not exceptional though, hence how far the stock could rise remains to be seen. Initial stop loss just under 131 (below most recent pivot low @ 131.35).
Watch out for earnings expected around 26 July. Might be prudent to take some profits off prior to earnings release.
Disclaimer: Just my 2 cents and not a trade advice. Kindly do your own due diligence and trade according to your own risk tolerance and don't forget that money management is (probably the most) important! Take care and Good Luck!

ZS - opportunity to buy this dipZS gapped and broke above a neckline "zone" (142 - 145) on 2nd June, eventually hitting a high of 162.67 before retracing all the way back to the neckline. The stock is still in the early stage of an uptrend as it is now trading above it's 200 day moving average (with a golden cross that happened last Thur).
"Breakup and retest of a neckline" often provides a 2nd opportunity to long as stock rebounds back above the neckline. However, in ZS' case, the rebound that followed after the initial retest of the neckline was feeble at best. After whipping around the neckline for slightly more than a week, there was a sudden more aggressive sell off last Thursday (6th Jul) as it attempted to close the gap @ 135 that formed just prior to the breakup. The gap closing mission did not succeed as it appeared bulls came back in force resulting in the formation of a small pinbar (bullish) by the day's close.
The trigger to long however, came only this morning as ZS began to rise above the neckline decisively. The bulls appear to be back in control again with today's strong bullish candle thus far (a variation of "morning star" formation) . Currently stop loss should be placed just below the mini pin bar that formed on 6th Jul (ie under 138). I suspect we won't see anymore attempt to close the gap @ 135 in the near future (although nothing is guaranteed!)
Disclaimer: Just my 2 cents and not a trade advice. Kindly do your own due diligence and trade according to your own risk tolerance and don't forget that money management is (probably the most) important! Take care and Good Luck!

CRWD - opportunity to buy this dipCRWD broke up both above its neckline @ 139 as well as it's 200 day moving averge on 18 May. Traded to a hgh of 162.25 before retracing all the way to retest it's neckine. It formed a mini pin bar right at the neckline, affirming that the neckline is now the "support" in the near term.
This is a 2nd opportunity to long if we had missed the breakup, with an initial stop loss just slightly below the neckine of $139.
Expect some resistences should it able to rise towards old supply zones around 167,181,195 and 205 etc).
Take partial profits and also trail stops up along the way according to one's risk appetite and trading style (short or longer term).
Disclaimer: Just my 2 cents and not a trade advice. Kindly do your own due diligence and trade according to your own risk tolerance and don't forget that money management is (probably the most) important! Take care and Good Luck!

CVNA - Trending but volatileCVNA had broken out of its basing formation neckline (a region between $17- $20) on 8 Jun on huge volume. It hit a high of 28.52 on 16 June before pulling back to retest near the neckline @ 20, then rebounded again from there.
IT's trend is in earlys stage yet with immediate suport @ 20. However be mindful that lower priced stocks tend to have huge volatility (both up and down). Hence it is important to position size accordingly or chose to exit if it pulls back beyond a certain % and wait for entry again once there are signs that the short term correction is over.
Watch out for resistences on the way up around $42 and also around $53+. Also be careful around earning releases.
Disclaimer: Just my 2 cents and not a trade advice. Kindly do your own due diligence and trade according to your own risk tolerance and don't forget that money management is (probably the most) important! Take care and Good Luck!

CFLT - New trend emergingCFLT broke above a basing neckline on 2nd June and has now pulled back to retest this neckline for since the last few days. So far, this neckline is still proving to be a support and it could be a good time to stake into the new uptrend that is emerging (with initial stop loss below the neckline at $31.50).
Other technical factors that have lined up to increase its odds of success are:
1. Basing for the last 12 months (the long the basing period, the more sustainable the new trend)
2. now trading above it's 200 day moving average with a golden cross on 31st May
3. good increase in volume (ie., accumulation) seen in the weeks leading to the breakup on 2nd June
The next area of strong resistence (aka supply) could be around $43 - $45 (which is 22-25% upside from here). There is a reasonable chance that it could go beyond this level in the coming months, however, I will manage trade with trailing stop loss along the way up. Sometimes it is ok to be stopped out prematurely (high chance in a volatile market) but we can always re-establish a position once the consolidation is over and momentum returns.
Disclaimer: Just my 2 cents and not a trade advice. Kindly do your own due diligence and trade according to your own risk tolerance and don't forget that money management is important! Take care and Good Luck!

BTC GOLDEN CROSSBTC is having a rare golden MA cross, that is Bullish if you look at the charts... Price is going up

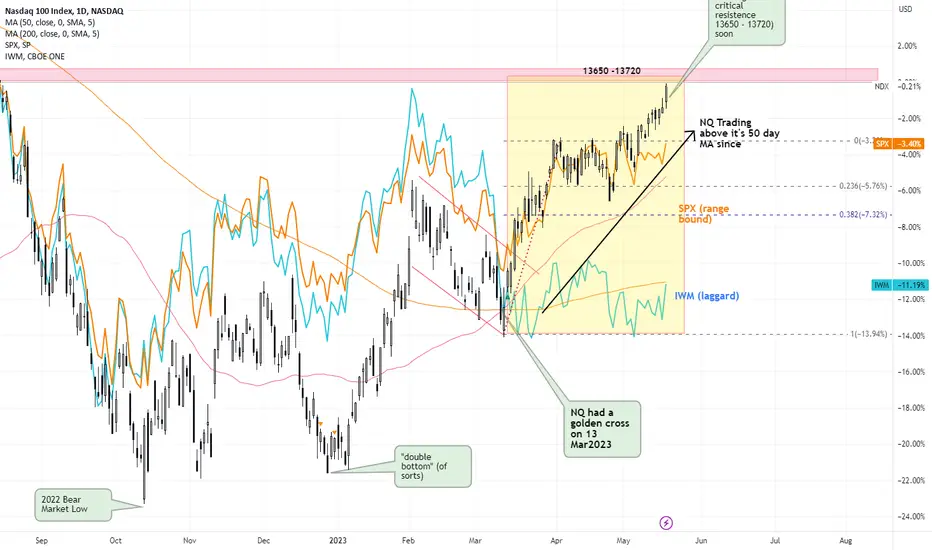
NQ - Bull intact but approaching near term resistence Despite a generally choppy market since February this year, Nasdaq had a Golden Cross on 13 March which turned out to be sustainable and some encouraging signs are also observed since:
1. NQ began to lead the other indices (namely SPX and IWM), a sign of a "risk off" sentiment as it means more money had been piling back into "riskier" tech & discretionary stocks
2. NQ had stayed above it's 50 day moving average (> 2 months now) with rather "shallow" retracements no more than 38% of each mini swing.
3. However, SPX was mostly stuck in a range for the past 1.5 months (despite being above it's 200 day MA), hence it can still make trading the wrong stocks rather frustrating.
4. IWM (Russell 2000, ie., small caps) has been the laggard, still unable to rise (much, if at all). This is normal during an "early" bull market.
Small caps usually begin to rise in a more sustainable manner when the bull market is well underway, and should they start to get extremely bullish, then it is usually a sign that a market top might be in the horizon.
Now that Nasdaq has been taking leadership (especially the FAANGS) for the past 2 months+, the sentiment remains sanguine.
Some caution now as it is approaching a critical resistence zone 13650 - 13720 (prior peak in Aug2022), and some pullback in the near term will not be too surprising
The depth of the next retracement going forward will give a clue if the uptrend is still intact.
Should NQ be able to clear this resistence zone (13720) eventually, then the overall market sentiment could get a good boost (including the small caps). Perhaps the resolution of the Debt Ceiling could be the catalyst?
But until then.
Just my take. Let's see :)
Disclaimer: Just my 2 cents and not a trade advice. Kindly do your own due diligence and trade according to your own risk tolerance and don't forget that money management is important! Take care and Good Luck!
NZDCADWill NZDCAD bounce from strong area of value? Retracement of Fib golden ratio and retest of strong broken support seems to be on table.
Don't forget to share your review.

DUOL - buy the dipsDUOL broke out of a base formation neckline @ 114 strongly on 2nd March this year and then did a classic retest of the neckline on 13 March, affirming that the neckline @ 114 has now become support. It then went on to hit a high of 147 before retracing all the way back down 116.82 (triggering a trailing stop loss @ 130).
A bullish morning star pattern than formed on 5th May and a re-entry was triggered on 6th May. However with earnings reporting on 9th May, one has to decide whether it was worthwhile to take the risk to long here. With the stock already dipping 20% from it's high of 147, the odds of an earnings surprise to the upside could be higher. Nevertheless, risking no more than just a small position (before earnings) seemed prudent.
Now that earnings is out of the way (upside surprise), there is a chance it could break it's last recent high of 147 in the near term. On the bigger picture, the stock is now on an uptrend and there is room to rise in the coming months. However market could continue to be volatile hence it could be less risky to buy any near term dips rather than to chase breakouts.
Learning to manage a position in such volatile conditions is paramount. I would still place trailing stops and am prepared to get stopped out but re-enter at the next bullish trigger, but only if the chart still looks bullish on the bigger picture.
Disclaimer: Just my 2 cents and not a trade advice. Kindly do your own due diligence and trade according to your own risk tolerance and don't forget that money management is important! Take care and Good Luck!
