DKNG - breaking out form base DKNG has been forming a (double dip) base for almost a year now, ticking off a number of criteria that could increase it's odds of being a successful medium term trade going forward:
1. Series of higher hi's (HH) and higher lo's (HL) since hitting the low on 28 Dec2022.
2 Golden cross on 28 Feb2022
3. It's 200 day MA has begun to turn up
4. Every dip (since hitting the low in Dec) did not violate it's 50 day moving average, signs of strength.
It just broke above the base formation neckline (on average volume however) last Friday. It is possible for it to slip back below this neckline in the near term. I will be interested to stake any dips going forward (provided the dip is within 50% fib retracement of it's most recent mini upswing).
Earnings is expected on 5 May hence do be mindful of volatility around then.
Disclaimer: Just my 2 cents and not a trade advice. Kindly do your own due diligence and trade according to your own risk tolerance and don't forget that money management is important! Take care and Good Luck!
Goldencross

RRGB - Great price action so far (buy the next dip)RRGB has the hallmarks of a stock that could potentially be a great winner. It broke out of it's base formation on 1st March on earnings beat with a strong breakaway gap (Breakaway gaps signify the beginning of a new trend and does not get filled in the near term).
It then proceeded higher over the next few days before pulling back to the breakup level @ 10.60 on 14 Mar, and then bounced right off again from there. This classic "break up and retest" establishes the neckline as the new "resistence turned support".
If one had been watching this stock, going long shortly after this "retest" would have been ideal.
However, since it is likely the trend is still in early stage, any near term dip (eg to fib retracement levels of 38-50%, or formation of bull pennant or flag etc) would still be a good opportunity to long. Let's see if the opportunity presents soon.
Disclaimer: Just my 2 cents and not a trade advice. Kindly do your own due diligence and trade according to your own risk tolerance and don't forget that money management is important! Take care and Good Luck!

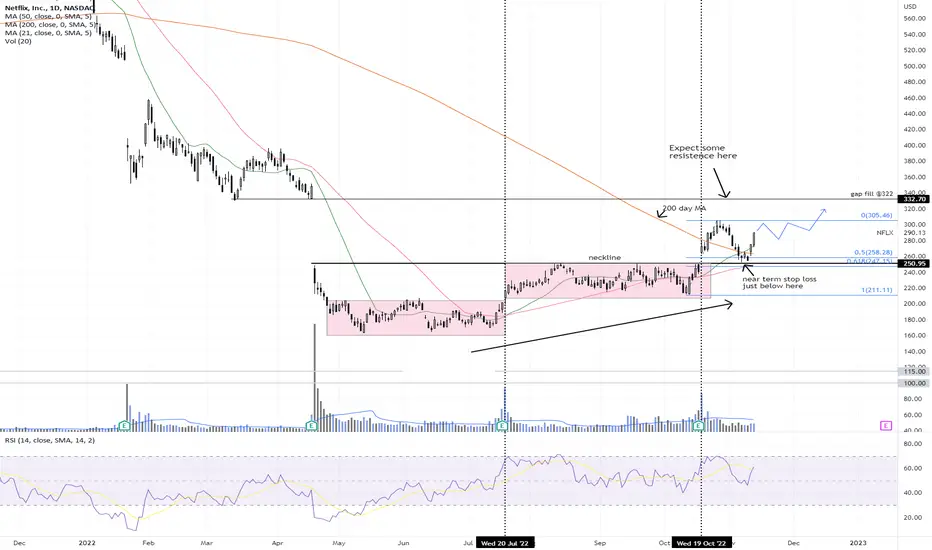
NFLX - uptrend NFLX fell 77% from it's peak before finding bottom @ 162.71 on 12 May 2022. It began to trade sideways for the next few months until it propelled out of this range on 20 July after earnings beat. After this, it again traded sideways in this new higher range for the next 3 months until another earnings beat on 19 October that finally propelled it above a rather significant neckline @ 251.
1 week+ after the breakup. it began a steep pullback that brought it all the way back to the neckline before rebounding strongly from there.
By now, it is clear that NFLX has turned the corner and is in fact now above it's 200 day MA (potential Golden Cross on the horizon).
Buy the dips going forward and trail protective stops up accordingly. Expect some resistence as it approach a major gap fill @322 area.
Disclaimer: Just my 2 cents and not a trade advice. Kindly do your own due diligence and trade according to your own risk tolerance and don't forget that money management is important! Take care and Good Luck!
$HUT: Inverted Head and Shoulders with an Incoming Golden Cross.We have an Inverted Head and Shoulders with a small Bullish Channel within the Right Shoulder while we are above the Major Moving Averages and are getting ready to Golden Cross. If we can pivot from here I think it could easily hit the 0.382 Retrace up at $6.819 and if we're lucky it could go up much higher to hit the remaining retrace levels above.

Long $DYDX for Financial Freedom #TheCryptocracyNot financial advice! God tier setup, doesn't get much better. Inverse head and shoulders, breakout retest, and golden cross. I am looooong! (macro market plz don't wrek me) #TheCryptocracy

Near top top 🌳🌪️The technical analysis currently reveals a promising bullish trend in the NEAR market. The price is approaching a long-term simple moving average (SMA) and demonstrates a strong bounce. This positive momentum could lead to the appearance of "golden crosses", where a short-term SMA crosses above a longer-term SMA (another strong line). These technical signals bolster optimism for the continuation of the ongoing upward trend in NEAR.
On some day, it will jump

ALGN - Will earnings be the catalyst?ALGN gapped up strongly on Earnings beat during its last earning on 1st Feb23. It then subsequently corrected and partially closed the gap, finding support eventually @ 297 the previous neckline region (now tuned support) and also right at the 38.2% fib retracement of the big recent upswing AB.
Since it's last Earnings, the stock had been wedging in a range but what is clear is that the bogger trend is likley still on the upside as there was a Golden Cross that occured on 14 Feb (nearly 2 month ago) with both the 50 and 200 day MA sloping up now (mild slope for the 200 day MA as it will take a longer time to refect the new trend). Plus the fact that the stock has been holding above it's basing formation neckline.
Any dip back towards the neckline region (297-303) could be an opportunity to long. I suspect the coming earnings expected on 26th April could provide the catalyst to propel it above this trianglle pattern. However, trade earnings at your own risk.
If trade works out, I will be watching to scale out (partially) from 425 - 455, and manage the rest of the position with trailing stops.
Disclaimer: Just my 2 cents and not a trade advice. Kindly do your own due diligence and trade according to your own risk tolerance and don't forget that money management is important! Take care and Good Luck!

🌀Golden Cross And Death Cross Patterns Explained🌀
💱Today, we're talking about the exciting world of technical analysis, specifically the golden cross and death cross patterns.
💱So, what exactly are these patterns? Well, let me break it down for you. The golden cross pattern is a bullish signal in which a shorter-term moving average rises above a longer-term moving average. On the other hand, the death cross is a bearish signal in which a shorter-term moving average falls below a longer-term moving average. Simply put, the golden cross is a sign that the stock is on an upward trend, while the death cross indicates a downward trend.
💱Now, I can hear some of you thinking, "Why are we talking about crosses? Shouldn't we be discussing actual trends and data?" And I get it, the terminology can be a bit confusing. But the reason these patterns are so important is that they can give you an early indication of an approaching trend.
💱For example, let's say you're a savvy investor on the hunt for the next big thing. You spot a stock that's been on the decline for months, but suddenly, the shorter-term moving average crosses above the longer-term moving average, creating a golden cross. This could be a good sign that the stock is about to turn around and start heading upwards.
💱On the flip side, if you're already invested in a stock that's been doing well, but suddenly a death cross appears, it could be a sign to cut your losses and sell before the stock drops further.
💱Now, don't get me wrong, these patterns aren't foolproof. There are plenty of instances where a golden cross or death cross doesn't accurately predict a trend. But it's still a valuable tool to have in your toolbox when it comes to analyzing the markets.
💱So, whether you're a seasoned investor or just dipping your toes into the world of stocks, keep an eye out for those golden and death crosses. They may just give you the edge you need to make informed trading decisions. Happy investing!
I Hope you guys learned something new today✅
Wish you all Best Of Luck👍
😇And may the odds be always in your favor😇
Do you like this post? Do you want more articles like that?

SE - Formed a BaseSE hit it's lowest point on 9 Nov22, several days before an earnings beat pushed gapedthe stock up strongly. However the rebound since had been volatile until another earnings beat on 7 Mar23 gapped the stock up strongly again, this time well above it's 200 day Moving Averae, and a Golden Cross materialised a few days later. The Gap that happened this time had remained unfilled since.
The stock has clearly turned the corner. Looking to accumulate at this recent dip. However, more momentum might materialise only if and when the stock eventually is clear and stay above the neckline @ 92.
Disclaimer: Just my 2 cents and not a trade advice. Kindly do your own due diligence and trade according to your own risk tolerance and don't forget that money management is important! Take care and Good Luck!

Inverted Head & Shoulders with Golden CrossIt's not a coincidence that Elon was on twitter having a who wore a golden cross better with the pope.
This idea is using the 200D and 50D golden cross and an Inverted Head & Shoulders and a price target of 300.
Be Warned. TSLA has faked out many large structures and major MA crosses to trap both Bulls and Bears.
I bought weekly OTM puts on TSLA before close on Friday but I will stop out and enter long should this structure retest.
It really depends how the Biden Admin handles this most recent surprise OPEC+ supply cut just as they need to restock SPR.
This could be the moment the FED has to pivot and Powell turns back on the printer to pay for it or someone is getting their hand slapped.

Bull FlagSuku has formed a nice bull flag here after breaking out of its falling wedge.
Confluence: Golden cross on the 50/200 day MA (dotted), and has been sitting in between the 50 and 200 day EMA for 40 straight days now, and is one of few in the crypto market that has yet to break above its 200 day EMA.
Targets remain the same as on my previous post. We could even see 15 cent area near the 200 day SMMA since this has been dragging out so long. Previous posts are here and here:
Higher targets near 15.6, but awaiting channel break:
Original falling wedge post:
Long-term, but long-shot hopium chart:

XRP Golden Cross Incoming XRP broke out after making a bullish pennant. Price is testing the .786 fibonacci level while the ADX is at 47 signalling a strong trend with D+ over D-
Looking for a break above the descending trend line to break out of the descending triangle (weekly).
20 EMA crossed over the 200 SMA and the 50 SMA is setting up for a golden cross.
Targeting .59 , .63, .78 short term

CRM - approaching neckline @ 195CRM had been basing for about 10 month now (since last May), the first sign that the worst could be over was when it broke above the 200 day movving average on 27 Jan, then a retest of this MA a month later on 27 Feb which validated the 200 day MA as the new "support".
Several days later on 2nd Mar, it gapped up strongly on earnings beat, stopping right at a significant neckline around 195. Then proceeded to pullback and almost closing the entire gap in the coming days. While the stock has been staging a recovery since hitting the low in Dec last year, it also experienced steep pullbacks on the way up. Buying the dips would certainly had been a better option in this chopping conditions.
Despite the volatility, what is clear however is that the stock is still on it's way to recovery, forming higher hi's (HH) and higher lo's (HL), with RSI staying at 50 or higher since early Jan, and a Golden Cross since 10 Mar.
It could attempt to break the neckline @ 195 again in the coming days and if and when it is finally able to break and stay above this level, then we could (hopefully) see more a more steady rise with pullbacks that are less steep (ie within 50% fib retracement of each mini up swing). And the next target could be around 220.
We can "predict" price targets but it is important to manage our risk with trailing stop losses and see what the market gives us.
Disclaimer: Just my 2 cents and not a trade advice. Kindly do your own due diligence and trade according to your own risk tolerance and don't forget that money management is important! Take care and Good Luck!

GOLD💥1H-TIMEFRAME ANALYSISGOLD💥1H-TIMEFRAME ANALYSIS
💗Hello ladies and gentlemen
This is my new idea for 💥GOLD
I hope my idea is clear
Support me by like and share thank you
Stay Safe💯💲💲💲
Good luck💰😍

SPX: Bullish Reaction Above Golden Cross.• The SPX is doing a very powerful reaction above a critical support level;
• First, as seen in the daily chart, it hit the 3,949 support, and it is doing a powerful reaction. Last Thursday it did a Bullish Engulfing, and las Friday, it broke the 21 ema and the 4k;
• In the weekly chart, it is doing a Hammer candlestick pattern, a bullish reversal pattern that works 60% of the time (according to Bulkowski – Encyclopedia of Candlestick Charts);
• In addition, this Hammer appeared just above the purple line, which was a previous resistance when the SPX was inside a Descending Channel;
• Moreover, this Hammer appeared above the 200 ma, after the index made a Golden Cross (the 50 ma broke the 200 ma upwards);
• All these signs indicate that although the index may look overbought short-term wise, it has decent chances of maintaining the bullish bias mid/long-term speaking, especially if look at the weekly chart;
• I’ll keep you updated on this.
Remember to follow me to keep in touch with my daily analysis!

SNX/USDT Golden Cross LongGolden Cross Accrued on Binance 1d Chart pattern of SNX /USDT Pair 50 EMA Cross 100 Ema Next Support and Resistance Available , if you have your idea about SNX Please share with us.

MKR/USDT Golden Cross Golden Cross Accrued on Binance 1d Chart pattern of MKR /USDT Pair 50 EMA Cross 100 Ema Next Support and Resistance Available , if you have your idea about MKR Please share with us.

A potential BTC price action rH&SWhen we look on a larger time-frame, foremost 1D, we can see more and more evidence that BTC moves with a channel, respecting the FIBO retracements. Also on a global scale we can see a reverses head and shoulder formation, that could lead to a short and rather rapid price explosion towards the uptrend.
the RSI 13 illustrates that BTC returned from overbought to a normal level, expecting to retest or maintain top upper channel from 50 RSI 13 above. Recharging for a larger move.
We also see that there is not much liquidity at higher price levels, hence the cohort of investors is not deciding to sale, but rather take profit and move some liqudity into the Altcoins, which pop-up.
On a larger time frame we see a massive resistance at 27.5-31.5k, indicated with a red rectangle .
The bitcoin seems to follow closely recovery from 2019 bottom, with a rapid uptake towards higher prices. Will this scenario play-out? This is a bit foreseeing but we see on the chart even more evidences for potential price speculation towards the uptrend.
Important to highlight is the analysis of social sentiment: a large cohort of investors yet believes that this is a suckers rally, hence they do not participate in the market, but their belief may be invalidated when breaking out 25.3 and maintaining this regime, pushing them to loss aversion due to missing the opportunity (also known as FOMO).
A confluence of:
- The rH&S, FIBO extension
- Massive volume resistance at arround 27-32k
- VPVR at around 27-32
- Potential resistance line draw from the 2021 Mai ATH, that has been respected
- On-chain analysis suggesting that the peak of the last bulllrun was in fact in Mai 2021
- On chain analysis, mainly aSOPR but also other parameters suggest a change in Investor's perception of the market towards the bull trend
- Historic fractal pattern from 2019 bottom that has been a black swan event too
- Golden Cross on 1D
- PRice action multiply respecting the 50% retraction
- MACD
- STOCH RSI (not shown in analysis)
This is surely a bet, but backed by several parameters that confluence.
Good luck with trading

Theta 1.32Theta broke the trendline and retested it late January now we are coming up on a golden cross just the catalyst we need to break 1.32 and head up to the next resistance maybe even right through it

Back to Basics video on examples of golden and dead crossoversCriteria for a dead crossover is that the short term moving average crosses below a longer term moving average while both are pointing lower.
Criteria for a golden crossover happen when a shorter term moving average crosses above a longer term moving average while both are turning higher
IN this example I have used a 55 and 200 day simple moving average.
Disclaimer:
The information posted on Trading View is for informative purposes and is not intended to constitute advice in any form, including but not limited to investment, accounting, tax, legal or regulatory advice. The information therefore has no regard to the specific investment objectives, financial situation or particular needs of any specific recipient. Opinions expressed are our current opinions as of the date appearing on Trading View only. All illustrations, forecasts or hypothetical data are for illustrative purposes only. The Society of Technical Analysts Ltd does not make representation that the information provided is appropriate for use in all jurisdictions or by all Investors or other potential Investors. Parties are therefore responsible for compliance with applicable local laws and regulations. The Society of Technical Analysts will not be held liable for any loss or damage resulting directly or indirectly from the use of any information on this site.

iotx golden crosswe have possible 90% upside on iotx with the golden cross pushing us out of resistances
0.036
0.040
0.044 are the last resistances
then i am targeting
0.064

BTC BULLISHWe observe a bull penn on the 4hr with a 29k target
a golden cross 50 crossing 200 is happening on the daily today
we have closed above 24400 yesterday and remian above halfway through today
Targets DYOR
But i will say if we break 26 there seems to be very little stoping us all the way into the 28ks

BITCOIN and the Daily CrossThis is a continued post from The Desperate Push to 26k, the avoidance of the weekly death cross.
Please review previous post before reading and boost/share for visibility.
Simplifying the outlook, these are the only two things I am currently looking at. The Daily and Weekly, golden cross vs death cross. I'll take the shorter timeframe in this bout, so a golden cross on the daily to turn the death cross on the weekly around. To do this Bitcoin will have to move up from this range shortly to the 26k-30k range.
The last 5 golden crosses on the daily have resulted in:
21,Sep,2021: 46k>68.5k
16,May,2020: 10k>64k
17,Feb,2020: 10k>market bottom
21,April,2019: 5.5k>13.7k
28,Oct,2015:$300>20k
This is not financial advice. Please take this as an analysis only and trade on your own terms.
