BTC VS TOTAL 1W - Pattern invalided? During Deathcross BTC creates first the cross then TOTAL
During Goldencross TOTAL creates first the cross then BTC
The last Goldencross now in February (2023) BTC created first the cross then TOTAL.
Is the cross invalided?
Furthermore the next levels are 9% to next Reversal Point. Price: $26780
The average of 35% (based on the 2 previous Golden Cross) gets us to $29200.
Date Date. Days of. Price. Price
Start End Type Differene Open Close Difference Market Days 1st 2nd
01/04/18 08/04/18 Deathcross 8 $6.808,00 $7.020,00 3,02% -5%. 8 BTC. TOTAL
19/04/19 24/04/19 Goldencross 5 $5.258,00 $5.416,00 2,92% 150% 63 TOTAL BTC
13/10/19 26/10/19 Deathcross 13 $8.280,00 $9.244,00 10,43% -37% 36 BTC TOTAL
14/02/20 18/02/20 Goldencross 4 $10.360,00 $9.684,00 -6,98% -53% 25 TOTAL BTC
25/03/20 02/04/20 Deathcross 8 $6.737,00 $6.751,00 0,21% 50% 46 BTC TOTAL
19/05/20 21/05/20 Goldencross 2 $9.800,00 $9.071,00 -8,04% 35% 95 TOTAL BTC
19/06/21 07/07/21 Deathcross 18 $35.767,00 $33.836,00 -5,71% -22% 38 BTC TOTAL
31/08/21 16/09/21 Goldencross 16 $47.116,00 $47.775,00 1,38% 36% 39 TOTAL BTC
14/01/22 23/01/22 Deathcross 9 $43.097,00 $36.224,00 -18,97% -19% 9 BTC TOTAL
07/02/23 13/02/23 Goldencross 6 $23.243,00 $21.780,00 -6,72% ONGOING BTC TOTAL
Goldencross

DASHUSD golden cross; testing inv h&s neckline If it can sustain the golden cross then it should validate this inv h&s breakout and head to the $70 target. We can see it has already broke above the neckline once need to see it back above again and maybe close a weekly candle or 2 above it. On its way to the 70 dollar target it would create bigger inv h&s patterns/necklines along the way that would also most likely confirm a breakout from and lead to even bigger targets but we must take this one step at a time first….as of now we haven’t even confirmed this first one will breakout just yet. *not financial advice*

GOLDEN CROSSToday, Medipharm Labs's 50-day moving average line crossed above its 200-day moving average line, forming a GOLDEN CROSS, a STRONG BULLISH signal.
Today, the stock went up by 13.33% on more than 4 times average daily volume.
Tradingview's technical analysis summary is BUY:
www.tradingview.com
GLTA!

Balance point - BTCCross point for the EMA and the possibility that the BTC price can exactly touch the cross at the moment of contact.
Same crossing point with regards to ADX, while for RSI one could see an inflection point at 50 points as a descent looking for a rebound to 30 points.
The situation has never been so balanced between bears and bulls.

Bitcoin Golden cross is happeningBitcoin Golden cross is happening.
Last golden cross was on oct 2021 after that btc reach all time high on Oct 2021. Then the crypto was crashed until now.

NVDA golden crossNVDA Golden Cross after a declining trend
Bullish to continue into new trend
Tailwind with AI tech needs computing power

$BTCUSD Golden Crossed!!!Ok, I know there is A LOT of technicals out there, Fibonacci, moving average, pivots, Elliot wave, RSI volume, price volume, etc., However, one that is sorta high up on the priority list is the Golden cross (50 day moving average crossing above the 200 ma). Any technician knows about.. the flip side is the death cross.
Well Bitcoin just golden crossed this morning. So that’s now, the Dow Jones (golden X’d in mid December), the S&P500 (golden X’d on Friday 1/27/23) and Bitcoin..the Nasdaq has not crossed yet.

Battle Of The Crosses We are in for either a death cross on Weekly or a golden cross on daily, which one will play out first and pump the market in one or the other direction?

IMMINENT GOLDEN CROSSMedipharm Labs's 50-day and 200-day moving average lines are a quarter of a penny from forming a GOLDEN CROSS, a strong BULLISH signal.
Extrapolation of these lines strongly suggests that they might form a GOLDEN CROSS this coming week.
Also, the Accumulation/Distribution indicator has clearly been trending upwards.
Tradingview's current technical analysis summary is STRONG BUY: www.tradingview.com
GLTA!

Pitbull Token price crossed over EMA 200 Daily!!!Pitbull Token price just crossed over EMA 200 Daily after several months..I hope it can fly soon!
Not Financially Advised!

🟩 GOLDEN CROSS turns $100k to $72M 👇WHAT IT IS
A Golden Cross occurs when the 50ma crosses over the 200ma. Having the 50ma above the 200ma is commonly considered a bullish market condition – and generally it is. Before we have looked at SPX Golden Crosses dating all the way back to 12/31/1928.
BY THE NUMBERS
How does the GOLDEN CROSS Compare against Buy&Hold from 1928 to 2023
👉 Golden Cross turns $100k to $72M
👉 Buy&Hold (SPX) turns $100k to $16M
Annual Return % for Golden Cross 7.25% vs 5.57% on the SP500

SPX / NQ - Bull confirmed (ok nothing is 100%)I wrote on Jan 18 that SPX had been looking "optimistic" technically as there were several factors favoring the bulls.
After FOMC meeting yesterday, the bull case has now received further affirmation:
1. Both SPX and NQ are now above their 200 day moving averages
2. Both have broken above a long term trendline resistence
3. SPX is about to "Golden Cross" (ie 50day MA crossing above 200 day MA)
4. SPX has also broken above it's diamond shaped formation
5. Rotation has been back into tech stocks in the past week with Big Techs gaining solid ground
Prior to this, I have mentioned several times that many stocks were forming basing patterns (rounding bottoms, inverse head and shoulder, Adam & Eve) etc. There were several false breakup at the beginning but lately there were more stocks that had golden crosses and with successful breakups.
Many people were looking at the "tree" (in this case the indices eg SPX or NQ) but forgotten about the forest (a whole bunch of stocks which were exhibiting basing patterns, although they still took months to confirm a breakup). Forget the noise, trade the technicals. Keep things simple
We could have pullback in the coming days, but as long we have higher lows or above the 50 or 200 day moving averages etc, the bigger trend is still up. Until these are negated, the risk-reward favor the bulls right now.
p/s not saying to jump blindly into stocks right now (if you haven't done so) but look for those with good entries (either momentum breakup or buying the dips for stocks already trending).
Disclaimer: Just my 2 cents and not a trade advice. Kindly do your own due diligence and trade according to your own risk tolerance and don't forget that money management is important! Take care and Good Luck!

BBY - emerging uptrendConfluence of factors to support this view:
1. golden crossed on 4Jan23
2. 200 day MA is now flattening out
3. beginining to break out of a 2 month sideway consolidation (>86.89)
It is possible that the stock could dip back briefly into the consolidation range in the near future but we are likely to see a higher low should this happen.
Disclaimer: Just my 2 cents based on pure TA and not a trade advice. Kindly do your own due diligence and trade according to your own risk tolerance and don't forget that money management is important! Take care and Good Luck!

XAUUSDSell GOLD
Note: To reduce the risk on your balance
you have to use only 2% of your balance.
-
-
-
-
-
-❤️If you have any questions, please, ask me in the comment section.
Please, support my work with like, thank you!❤️.

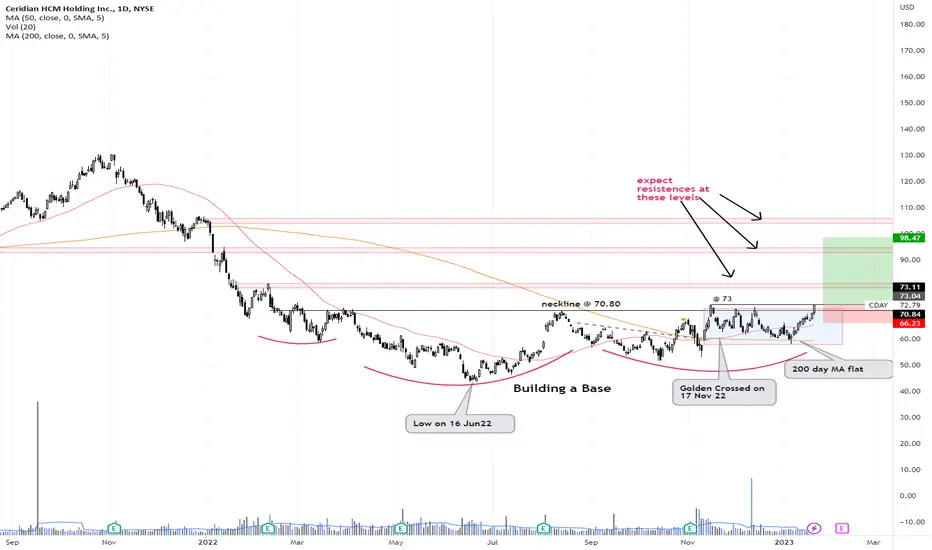
CDAY - on the verge of trending up?CDAY had been basing since hitting low on 16 June 2022 (7 months now). It formed a Golden Cross on 17Nov 2022 (2 months+ ago) but continued to trade flip flopped within a sideway range while it's 200 day moving average began to flatten out.
With it's 200 day MA having shifted from a downtrend to a flat line, the odds have increased for start of a sustainable up trend in the near future esp when it can start trading above it's last recent hi @ 73.
Let see!
Disclaimer: Just my 2 cents and not a trade advice. Kindly do your own due diligence and trade according to your own risk tolerance and don't forget that money management is important! Take care and Good Luck!
LTC inv h&s appears to be validating; golden cross soonUnlike the tezos, and algo inv h&s patterns which ended up being takeouts and have now been nullified, the ltc inv h&s seems to still be legit and is currently attempt to validate its breakout. We can also see it is just 1-3 daily candles away from its golden cross adding bullish confluence to this breakout. The breakout target had to be readjusted slightly lower than the original target because price action dipped back below the neckline. The new target is $91.79. I will put a link to the previous litecoin idea about this inverse head and shoulders pattern below. *not financial advice*

SHOP - Ready to trend soon?SHOP had been building a rounding base for the past 9 months with 2 (failed) attempts to break it's neckline @ 45.30. The stock finally had a Golden Cross a few days ago on 18 Jan, further solidifying that it is bottoming out.
Even after golden cross has occurred, some stocks can continue to remain volatile within a range for another 2 or even 3 months. Hence a better time to enter long is to wait for a break above a significant neckline (in this case 45.30).
The aggressive trader would enter as the stock starts to break above the neckline (entry 1) although there is a chance this could be yet another false break (but with diminishing odds as the moving averages are now aligning to the upside).
A more conservative trader could wait for further upside momentum by waiting for the 1st pullback above the neckline, and then enter only when the stock starts to break above the last pivot high (entry 2).
Disclaimer: Just my 2 cents and not a trade advice. Kindly do your own due diligence and trade according to your own risk tolerance and don't forget that money management is important! Take care and Good Luck!

NVDA - approaching neckline (bull watch)NVDA was gyrating in a wild and wide base in the last 6 months. On 14 Dec it even went above the 200 day moving average but alas it proved to be shortlived as it began to retace 61.8% of the swing (AB) , forming what is now apparent a potential inverse Head & Shoulders pattern.
As of now NVDA is trading above it's 200 day moving average again (a postiive) and a golden cross could happen (although not yet) in the near future (2nd positive if and when it does happen). The odds of a successful breakup is higher than it was earlier.
An aggressive trader would buy the next breakup @ 184 (#1 in chart) with initial stop loss below 170 while a more conservative approach is to wait for the 1st pullback after the breakup and only enter the trade as it rebound and starts to surpass the first high above the neckline (#2).
The #2 or more conservative way of going long is to wait for the upside momentum to be firmer such that retracements are likely to be less steep by then.
Disclaimer: Just my 2 cents and not a trade advice. I may or may not enter into this trade. Kindly do your own due diligence and trade according to your own risk tolerance and don't forget that money management is important! Take care and Good Luck!

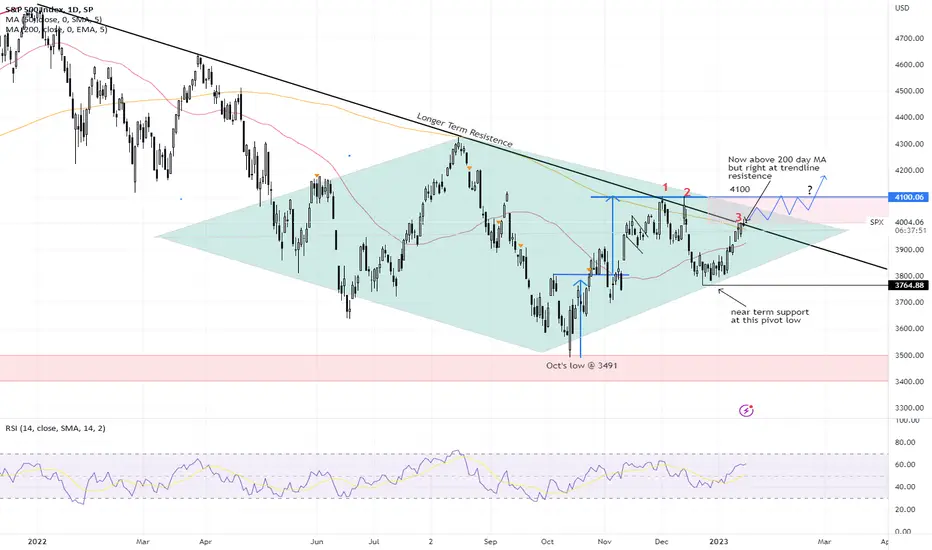
SPX - case for optimismOn Jan 3, I posted that SPX had been trading in a diamond pattern since late May, a potentially bottoming formation in a bearish market. It has been 2 weeks since and this pattern continues to play out.
2 days ago, SPX managed to close above its 200 day moving average and stopped right at the critical longer term trendline resistence again. This is the 3rd attempt testing the 200 day MA as well as the trendline resistence in the past 1.5 months.
The odds have increased that it will eventually test the 4100 level in the not too distant future, We may face some resistence at 4100 but the next pullback could be an opportunity to buy the dips, especially if pull backs do not bring it below the 200 day moving average again or formed a higher low.
Signs that a new bull could have returned (in the following order):
1. trading above both longer term trendline resistence (black) AND 200 day moving average
2. Golden cross, ie 50day MA crossing above 200day MA. May happen within the next couple of weeks? However, the market could continue to gyrate wildly for weeks more until the 200 day MA can flatten out
3. finally, trading above the 4100 level and by then the 200 day MA could be starting to slope upwards
Let's see.
Disclaimer: Just my 2 cents and not a trade advice. I may or may not enter into this trade. Kindly do your own due diligence and trade according to your own risk tolerance and don't forget that money management is important! Take care and Good Luck!
MELI - could be ripe for breakup soonThere are several factors that are aligning in MELI's favour for sustainable recovery in the near future (minor pullbacks not withstanding):
1. Since hitting the low in June2022, it began to whip saw sideways within an ascending triangle pattern. This is a possible reversal pattern when formed after a downtrend.
2. A golden cross on 22 Dec2022: another signal that the trend is possibly reversing up although the stock could still continue to whipsaw for several weeks (sometimes up to a couple of months) until the 200day moving average could flatten or start turning up.
3. Very strong volume in the last 2 days that propelled the stock to move 15.6% in just 2 days to retest the neckline of the ascending triangle.
Watching to see if a (valid) breakup will materialise in the near future (perhaps after the next minor pullback).
Disclaimer: Just my 2 cents and not a trade advice. I may or may not enter into this trade. Kindly do your own due diligence and trade according to your own risk tolerance and don't forget that money management is important! Take care and Good Luck!

MATIC | Golden Cross Potential & Looking PumpableDropping this idea for a good TV buddy here who was about to shart it.
I have no fundamentals atm, just pure TA and hopefully it plays out well for you.
Key Features :
1. Reverse Fib from High
2. 50/200 EMA's heading for convergence / cross over above
3. Pitchfork (theoretical) looking like it wants to fill the upper channel
4. Volume Profile looks a bit supportive and converging with EMA's
5. Market over all in relief mode
For the sharters, I'd look for something a bit higher as indicated by the arrow.
I wouldn't necessarily long this here but I can't say it'd be a bad idea off the 236 reverse Fib, there's a slight reversal pattern / bottom shaping up in there too but DYOR.
Again, I whipped this up on the super fly, totally jammed over here.
* * * Not Investment Advice * * *
Good luck!

$IWM Daily Chart GOLDEN CROSSPotential Golden Cross incoming which can provide some drastic movement to the upside. Golden Cross is when 50 day (blue) MA crosses over 200 day MA (orange) for any new traders. Higher probability when using higher time frames like the daily, weekly or monthly chart. The higher the time frame, the stronger the signal IMO

ETSY- Flag formationETSY has been trading above it's 200 day MA since 10 Nov22 and a Golden Cross since 30 Nov22. The trend is still up despite the steep pullbacks that this stock is prone to. At the moment we are seeing yet another "flag" formation, the next buy will be triggered should it start to break above this flag (124-127 depending on when the breakup occur, if it happens).
So let's see!
Disclaimer: Just my 2 cents and not a trade advice. Kindly do your own due diligence and trade according to your own risk tolerance and don't forget that money management is important! Take care and Good Luck!
