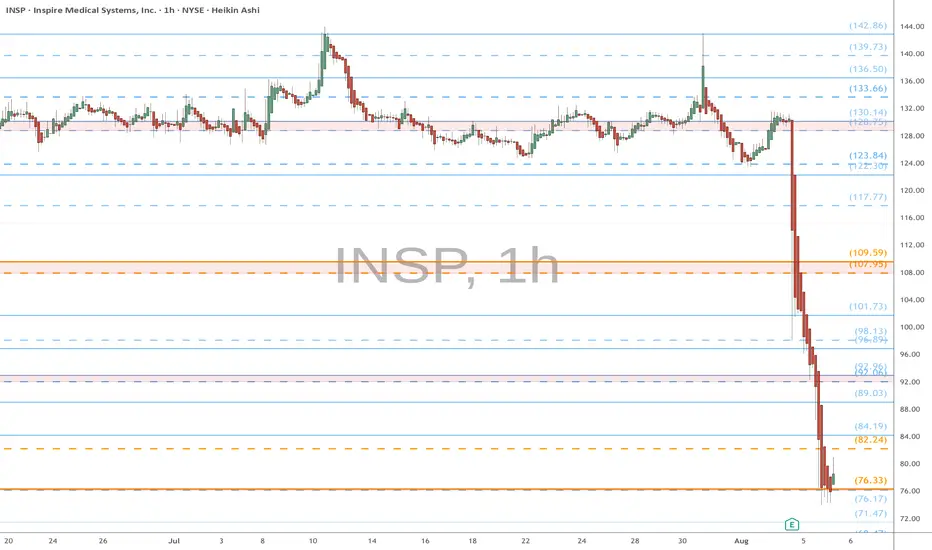
INSP eyes on $76: Double Fib needs to hold the earnings DUMPINSP earnings started a massive dump of 30%.
Free Fall came to abrubt stop at a Double Fib.
$76.17-76.33 is critical support for bulls to hold.
Goldenratio
AMD eyes on $178: Serious Resistance zone that may give a DIPAMD bouncing back from market wide dump last week.
Approaching a significant resistance at $177.79-178.59
Look for a Dip-to-Fib ideally to green at $163.30-163.61

WTI watch $70.34-70.43: Resistance zone that may STOP the surgeUSOIL spiked on Trump/Russia/Iran tariff threats.
Just hit a significant resistance at $70.34-70.43
Look for a Dip-to-Fib or Break-n-Retest for longs.

TMUS watch $227.03-227.69: Key support zone to end downtrend? TMUS has dropped a lot from its ATH a few months ago.
Currently testing a key support zone at $227.03-227.69
Look for a clean bounce to signal end of the downtrend.

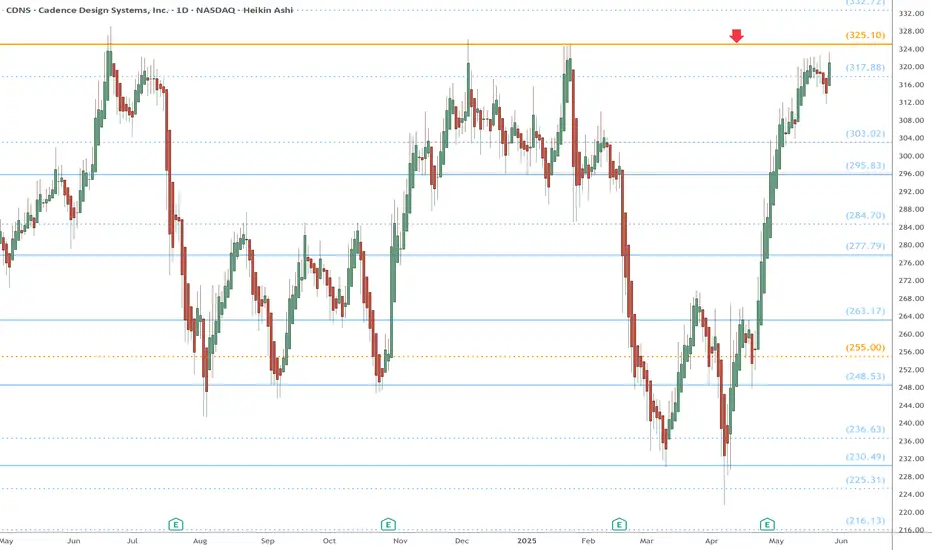
CDNS watch $325.10: Golden Genesis Fib ceiling for over 2 yearsCDNS has topped here many times over the last 2 years.
Golden Genesis fibs are massive landmarks for any asset.
This one has marked THE TOP for over 2 years thus far.
It is PROBABLE that we "Orbit" this a few times.
It is POSSIBLE that we reject for another top.
It is PLAUSIBLE to Break and run to new ATH.
=================================================
.
SHOP watch $126.79-127.28: Major Resistance may start a RetraceSHOP surged into a significant resistance at $126.79-127.28.
Zone of a Golden Genesis fib paired with a Covid Simulus fib.
Looking for a Break-n-Retest or Dip-to-Fib for long entries.
.

WMT eyes on $95.68 above 93.38 below: Double Golden fibs are KEYWMT has been orbitting this Double Golden zone.
$95.68 is a Golden Genesis, $83.38 a Golden Covid.
This is the "highest gravity" cluster any asset can have.
This is a very important landmark in this stock's lifetime.
==================================================
.

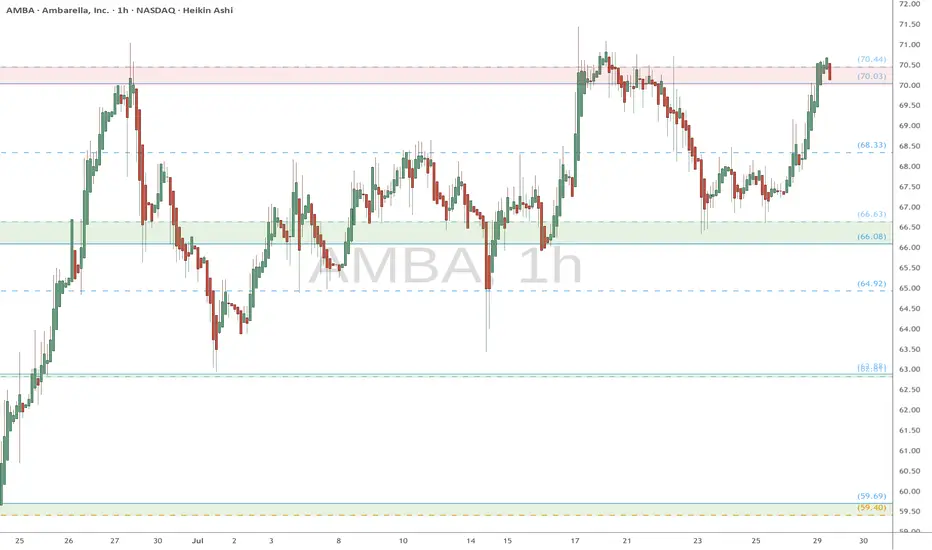
AMBA watch $70.03-70.44: Proven resistance holding up new highs AMBA has been trying to float upwards with the market tide.
Currently struggling against a proven resistance $70.03-70.44
Looking for a Break-n-Retest ideally or Dip-to-Fib for entries.
META watch $779 then 798: Dual Golden fib barrier to 800 round META earnings blew away the analyst expectations.
Surged into dual Golden fibs at $779.61 then 797.90
This "high gravity" zone will likely hold price for a bit.
.
See "Recent Publications" for previous charts ------------>>>>>>>>>
Such as this one that caught an HUGE BREAKOUT
Hit BOOST and FOLLOW for more such PRECISE and TIMELY charts.
=========================================================
.

NLR eyes on $111.03: Golden Genesis fib holding up new ATH NLR NLR struggling with this Golden Genesis fib at $111.03
Ultra High Gravity fib has shown its strength repeatedly.
This push might be "the one", the one to finally break away.

OSK eyes on $125.42/52: Double Golden Fibs likely to Orbit a bitOSK has been rising with the market and industrials.
It is hst just hit Dual Golden fibs at $125.42-125.52
Expecting a few orbits and possible dip from here.
.
This pair of Fibs called THE PREVIOUS TOP:
.
The smaller Golden Sisters also called THE BOTTOM:
Hit the BOOST and FOLLOW for more such PRECISE and TIMELY charts.
=============================================================
.

UPST watch $67.57-68.55: Major Support might hold earnings DUMPUPST earnings were apparently not pleasing to the Street.
We got a bull trap then a dump to support zone at $67.57-68.55
Looking support to hold and Break-n-Retest to start adding longs.

ANF watch $103: Proven Resistance zone holding up next major legANF trying to paint a bottom after a downtrend.
Now testing a proven Resistance $103.14-103.97
Look for a Break-n-Retest, dips not interesting

ADM heads up at $57.77-78: Double Fib resistance may stop Surge ADM earnings report gave a nice surge upwards.
It is now approaching Double Fibs at $57.77-78
Looking for a Dip or a few orbits around them.

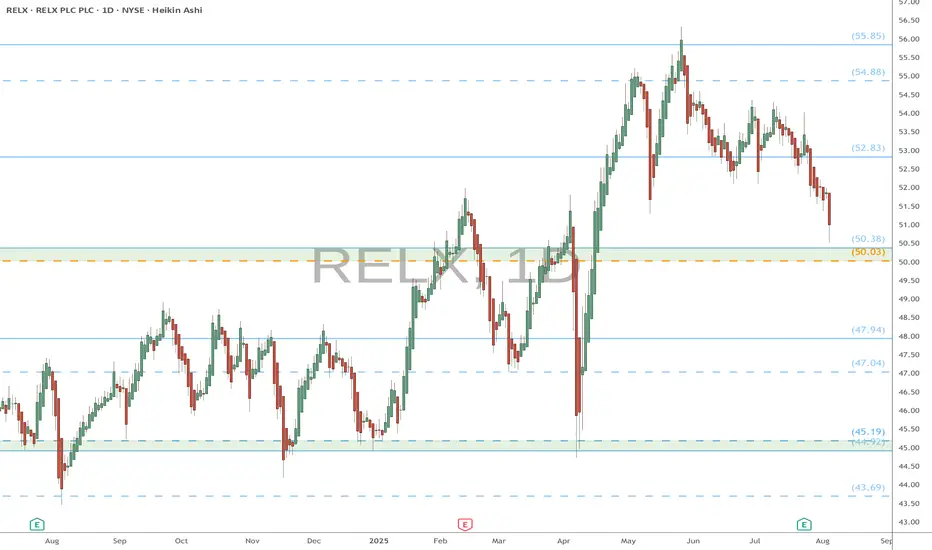
RELX eyes on $50: round number supported by Major Fib zoneRELX has been pulling back from its record highs.
About to hit a major support zone $50.03-50.38
Looking for a clean bounce or not interested.
YETI eyes on $30.20/25: Double Fib break should RUN YETI testing a well established resistance at $30.20-30.25
Looking for a Break-n-Retest of this zone for long entries.
If rejects then look to the Fibs below but not ideal scenario.

SYK watch 365-366: Proven Resistance to tariff recovery wave SYK struggling with previous highs now resistance.
The key zone for bulls to break is $365.54-366.31
If it dips, not much support until $343.86-347.98

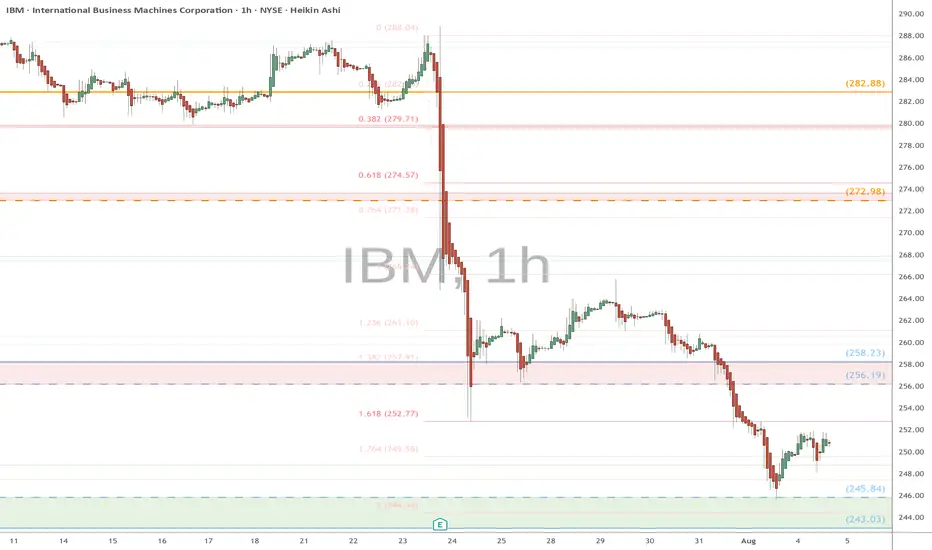
IBM eyes on $243-245: Serious Support zone should give a bounce IBM was dipping on earnings even before market swoon.
It has take a second leg down to support at $243.03-245.84
Should get a decent bounce, even if going lower afterwards.
.
See "Related Publications" for previous charts ----------->>>>>>>>>>
Such as this plot which caught the EXACT BOTTOM:
Hit BOOST and FOLLOW for more such PRECISE and TIMELY charts.
===========================================================
.
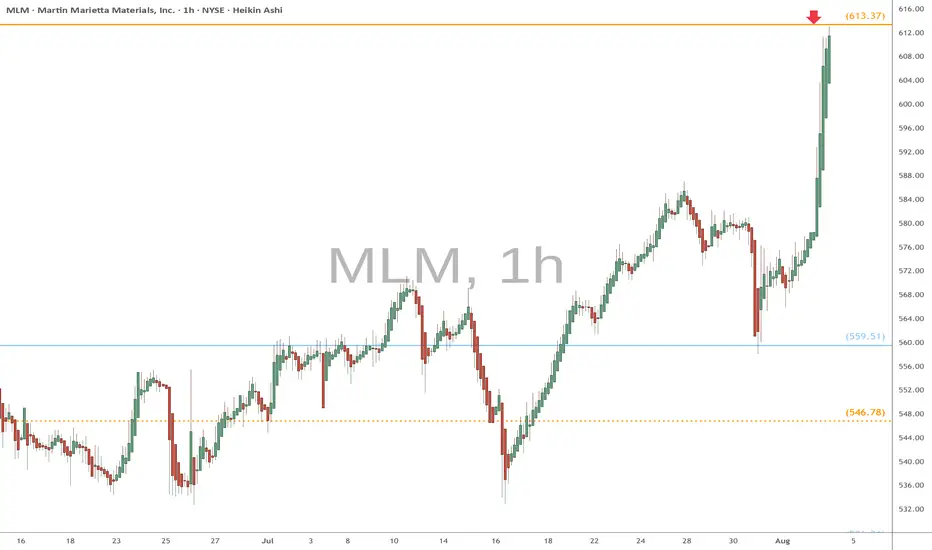
MLM heads up at $613.37: Golden Genesis fib may STOP the SurgeMLM had news of acquisition and a partnerhip.
It has just hit a Golden Genesis fib at $613.37
Look for a Dip-to-Fib or Break-n-Retest to join.
Previous Analysis that caught the BREAK OUT up to this fib:
Hit BOOST and FOLLOW for more such a PRECISE and TIMELY charts.
==========================================================
.
HSBC eyes on $53.xx: Key Resistance to recovery of UpTrendHSBC looking quite strong compared to other banks.
Just poked through a key Resistance at $53.01-53.40
Strong break should retest highs above at $58.11-58.65
.
Previous Analysis that caught a long PERFECTLY
=================================================

WMB eyes on $61.xx: Significant Resistance should give a Dip-BuyWMB moving up nicely with energy stocks for AI.
Just hit a significant resistance at $61.14-61.26
Looking for a Dip-to-Fib or Break-n-Retest here.

PII eyes on $59.27: Golden Genesis may give a Dip-to-Fib entryPII earnings report spiked it into Golden Genesis at $59.27
Looking for a dip to enter on the strength of earnings.
Golden Covid below at $56.59 or green zone around $54

ARKQ heads up at $83.xx: Proven Resistance break should RUN hardARKQ about to try a well proven resistance again.
Dual fibs mark the rejection zone $82.83-83.34
Looking for a Break-and-Retest for long entries.
