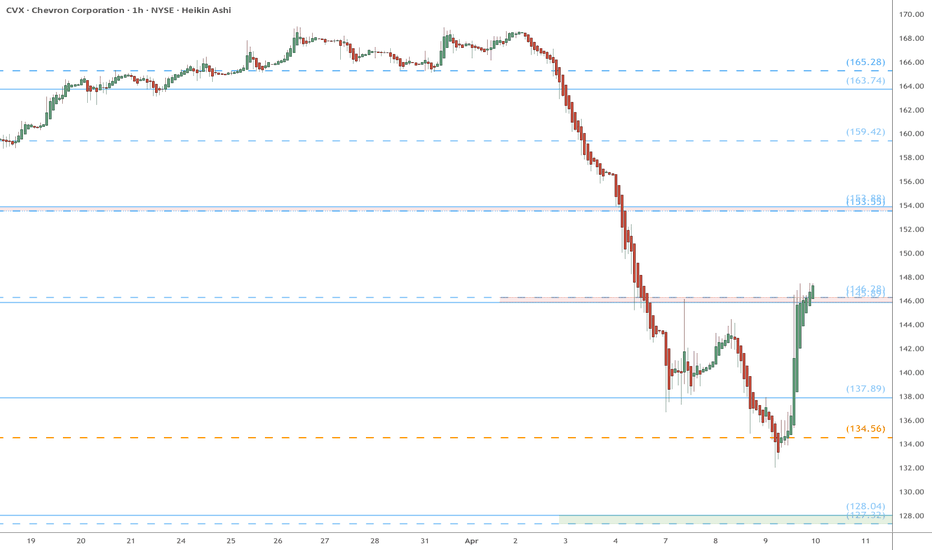
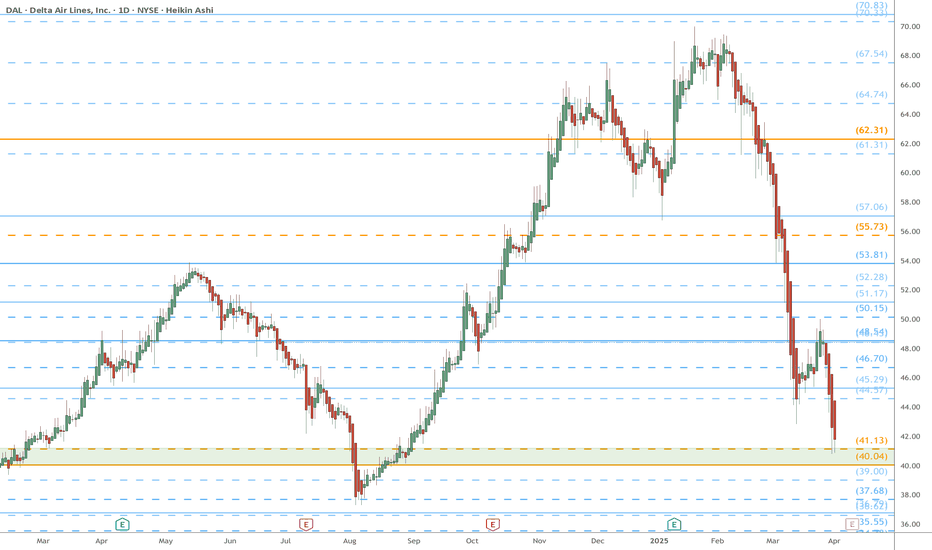
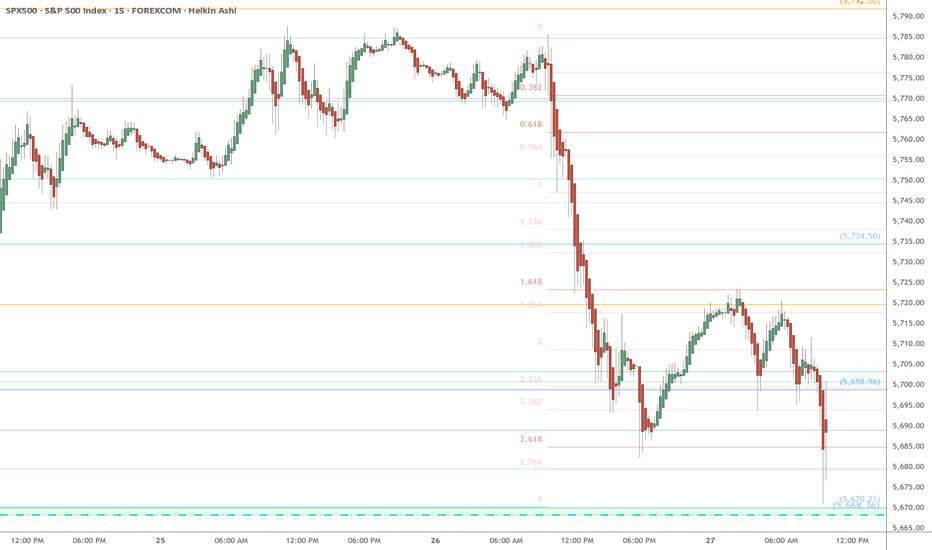
Possible yum yum style breakout for $SNDL! The chart is looking great on the 5.5 hour (333 minute) chart. Could this be a yum yum style breakout, or will it be a flop?
I have a bunch of call options with a strike price of $1.50 that expire today. Could we see a bull run within the day that brings us to $1.50, or will it be over the next few days/weeks? Either way, this seems like a tipping point to me!
We also have the new news that New York State legalized recreational cannabis for adults! Not sure how that will affect this stock!
Happy trading!
Not investment advice
Goldenratio
Possible breakout situation for Sundial!This fledgling cannabis stonk has a great future ahead of it in my eyes. Just peep their instagram! They're definitely seemingly in-the-know. I'm thinking of this position as a long hold. But also will probably reach a short term peak soon.
Have fun!
Not investment advice
BTCUSD Long - Wave AnalysisPrice showing ABC correction after initial 5 part bullish wave and rising wedge pattern.
Expecting price to retrace into the golden zone (62% retracement level on 1D timeframe) and touch the 50 EMA for additional confluence at $50,000 institutional figure by next week.
I will go long at $50k and hold until the end of the year.
Potential yum yum style reversal for the behemoth TeslaA few weeks ago, in February, I pointed out that Tesla is looking bearish on the weekly chart. Now I have a feeling it may push through resistance and try push prices of $850, $900 or higher.
My position is 10 call options contracts that expire 3/26/21 with a strike price of $515, so you can see how confident I feel about the potential of this yum yum style.
I see it in the days ahead, hours too. It may go down for a bit today/first, which may be an ideal time to snag some.
Have fun!
Not investment advice. just ideas.
GoldenEye VRA/BTC #Verasity $VRA #VRAHere we see our VRA 3 day chart which had a great couple of days pumping well past my previous target of 48 sats !! Of course it's cooling off a bit now sitting at 32 sats . That's expected after a large pump, there will always be a retrace and cooling off before more continuation . But what is our mid-term target here for VRA ? Where can it hit in the next couple of months for instance ? Well... if you look at my chart you will see a green dotted line . That line sits at the level of our .618 fib . Also sometimes called the Golden fib , this sits near 125 sats . I'm thinking this is a probable target and would be about 4x up from where we sit now or 400 % . Now we can definitely dump more- this isn't necessarily our bottom (though it could be. ) And we can definitely pump way more than 125 sats too ( as you can see from the recent crazy pump !! ) Will VRA go to Binance this year ?? That's a wild card . And if it happens VRA could have an unstoppable year .
Looks like Apple is breaking out on the daily chart!! Yum yum!!It's sweet to see the behemoth of ESG, Apple, perking up and breaking out! I've bought calls for September 2022 because I think that this stock is going to yum yum heaven, more and more so as it approaches the release of Apple car. The company's goal with their supply chain for all products is to be completely closed loop, using only materials from their old products. Now, that's ESG!
Apple seems like a great long hold. REMEMBER it's not just iPhones... it's a severely underpriced electric vehicle company!
Not investment advice 😊
PS: Should I sell my signals? Would you buy them? Comment below
I should have called it sooner, but this is a breakout situationLordstown motors, makers of electric work vehicles, looks yummy on the medium long term! I bought it around 14 and a half dollars, I would. have called it sooner but wanted to make sure it didn't keep sinking!
Do ya research, and check out the stock!
Could be yum yummiest of styles!
Not investment advice
A surprise, very erect looking candle hath appeared? What next?!This is a stochastic surprise this morning! Is this a moon Friday? Let's see! I have 44 call options contracts with a strike price of $5 so it would be awesome if it went in that direction! Anyways, this is an odd looking candle and could be a breakout! This children's educations stock has a lot going for it! Value ESG investing but hella volatile and profitable...
Not investment advice.
A setup for what could be the most severe meow meow style ever!Within the year, we've seen price action from $.04 to $.08 for a 100% profit. Now I believe this gorgeous stonk is setting up to do multiples. I'm YOLOing much of my portfolio on this stock in order to pay for the development and launch of the app for activism I invented so I really really hope this moons!
NOT investment advice.
Have fun!!!
Warning: this stock is EXPLOSIVE and possibly life changing!
There was an AI buy signal on the chart yesterday... Today!?What will happen today? I smell the thick juicy aroma of yumyumstyle burgers in the air. This is the yum yum style of the century? May we have another underpriced value stock on our hands? Could this be the Gamestop of ESG?
Pole Dancer formation - do we have a yum yum style breakout?The chart is looking good! Companies like this are the future of cgildren's education. This stonk may be YOLO worthy...
Do your research!
May the yum yum season begin! Sundial looking bullish on the 4HYou didn't think ya girl would lead you wrong, did you?
Wowza, I called it at a lower price, it dropped a bit lower and now I think we MAY have a breakout. I repeat, we may have breakout! It's up after hours and perhaps in during the regular market hours it will start off trading at a higher price than it closed at yesterday.
WHO's to say?
Very exciting. What are your moves? Comment below!
Not investment advice!
SPX liquidity was needed - bullish trend intactHello traders and analysts,
A quick note:
This is tagged as long, for the wider outlook.
Zone colour Master Key:
Blue = Monthly
Purple = weekly
Orange = Daily
Grey = 4hour
Pink = 1 hour
Here is an update to the previous idea - keep in mind the imbalances in the wider time frames.
What does this chart show?
Well, the trendline has been tested, but a higher low has been created suggesting that a correctional move was imminent.
Why in this "sell off" remaining cool, calm and collected is important here.
The emotional move in profit taking is crucial, but this move was needed.
see the Fibonacci aligning here;
This was another opportunity to add a long position - all be it small as price is at a costly price to buy in. But the power of compounding and average price will allow for these moves to take on a short term horizonal risk.
The Fibonacci retracement aligns and a buy order can be placed.
Note* this 61.8% maybe broken in the short term for a trendline retest of a false breakout to pin a bearish move.
See the correctional move from the channel below. Notice how price is back within the lower green target. The trendline has been tested of 6 losing days consecutively.
The 2021 analysis:
Price has followed the path prediction thus far to a almost perfection at this moment in time. The reason for this is using the daily, weekly and monthly. The probability of the imbalances remain clear
Multi time frame analysis:
SPX is in need of a correctional Rolling returns - historical data .
Using the base model of 3 year rolling returns,
the simplified explanation of the model shows a 41/50 years have returned a positive growth. As opposed to 6 years of negative returns. With 2020 closing out 16.26% return .
*Note - the 6 years where the rolling return is negative - the dot com bubble only stood to lose 6.2%* Est.
SPX is in need of a correctional move
using the monthly time frame
Daily time frame:
A four hour perspective of where price has moved from for the bullish scenario in the short term.
SPX vs the Vix
The Vix to be maintaining below 35 max positional moves will show correctional patterns of distribution flows in the smaller timeframes where price engineering will take place to allow discounted prices to occur.
This will tend to steady the recovery but also give the rally base rally move a chance to breathe.
SPX vs Emerging:
What does the emerging markets show us?
Well the imbalances are within the same as the US market, but the economic recovery in terms of imbalance price driving in the EEM - shows that whilst fundamentally there is more volatility . The activeness of these markets provides a telling Fibonacci extension target is not to dissimilar along with the SPX . The commodities such as Copper , Silver , Gold and Platinum will now provide a solid buy opportunity now the demand will grow.
The second image shows the return % of the fund upon a scale against the SPX on a daily chart close.
Fundamental failures, to ensure imbalances are made clear for the bullish scenario.
The FED injecting 22% of all USD in circulation within one year.
A Staggering amount of est $9T USD was injected to save the US from collapse, despite its ever mounting debt of as it stands 11. 01 .2021
$27.775T USD
www.usdebtclock.org
The question remains as the USD loses value - in order to promote cheaper investment and more prospects for cheaper imports - the country will have a real issue with the constant cycle of financing debt upon debit.
With the Global fiscal policy to remain between 1.5-2% - this should keep the FED side lined for a few years monitoring the US and world economy.
What we would expect to see will be the growth of EM and commodity based countries in terms of FX to continue the growth against the USD.
Last comparison;
Inflation ETF vs SPX500 .
If you as a trader are interested in the price ratio of Shiller P/E ratio , the market is at this moment 35.83x, with low inflation at the moment, the bulls are on the run. Watch this space.
Do you enjoy the setups?
We have 10 years combined analysis experience in world markets.
Offer our technical breakdowns here
Focus on technical output not fundamentals
Position and swing trades
Provide updates where necessary - with new updated ideas tracking the progress.
If you like the idea, please leave a like or comment.
To all the followers, thank you for your continued support.
Thanks,
Team LVPA MMXXI