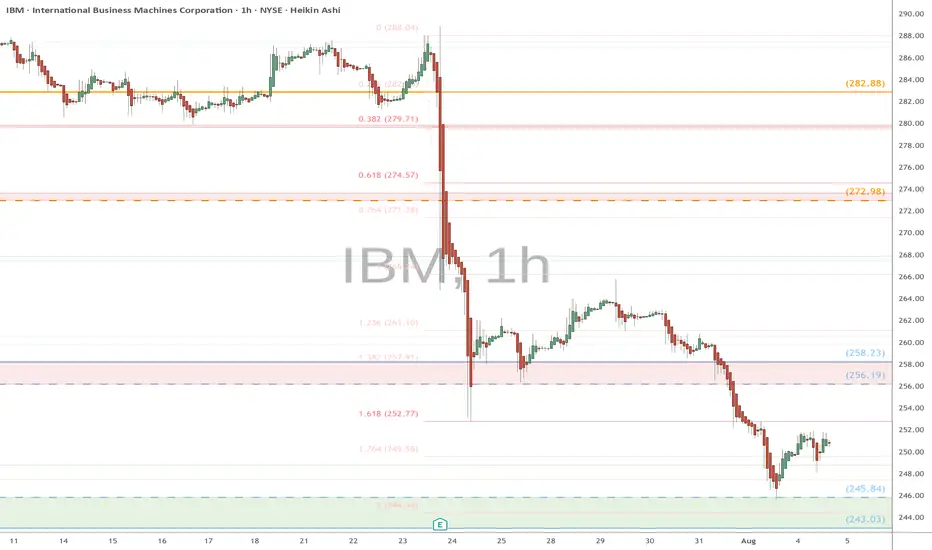
IBM eyes on $243-245: Serious Support zone should give a bounce IBM was dipping on earnings even before market swoon.
It has take a second leg down to support at $243.03-245.84
Should get a decent bounce, even if going lower afterwards.
.
See "Related Publications" for previous charts ----------->>>>>>>>>>
Such as this plot which caught the EXACT BOTTOM:
Hit BOOST and FOLLOW for more such PRECISE and TIMELY charts.
===========================================================
.
Goldenratio
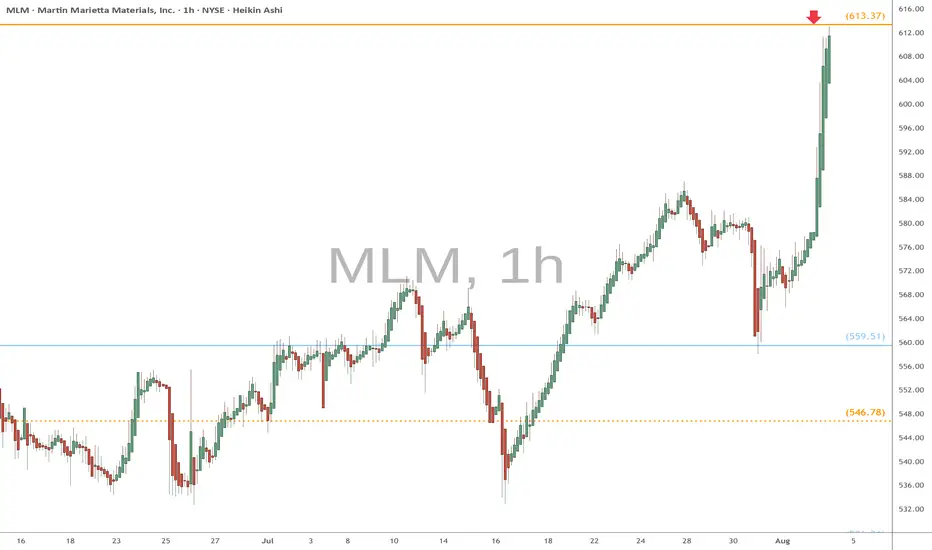
MLM heads up at $613.37: Golden Genesis fib may STOP the SurgeMLM had news of acquisition and a partnerhip.
It has just hit a Golden Genesis fib at $613.37
Look for a Dip-to-Fib or Break-n-Retest to join.
Previous Analysis that caught the BREAK OUT up to this fib:
Hit BOOST and FOLLOW for more such a PRECISE and TIMELY charts.
==========================================================
.
HSBC eyes on $53.xx: Key Resistance to recovery of UpTrendHSBC looking quite strong compared to other banks.
Just poked through a key Resistance at $53.01-53.40
Strong break should retest highs above at $58.11-58.65
.
Previous Analysis that caught a long PERFECTLY
=================================================

WMB eyes on $61.xx: Significant Resistance should give a Dip-BuyWMB moving up nicely with energy stocks for AI.
Just hit a significant resistance at $61.14-61.26
Looking for a Dip-to-Fib or Break-n-Retest here.

PII eyes on $59.27: Golden Genesis may give a Dip-to-Fib entryPII earnings report spiked it into Golden Genesis at $59.27
Looking for a dip to enter on the strength of earnings.
Golden Covid below at $56.59 or green zone around $54

ARKQ heads up at $83.xx: Proven Resistance break should RUN hardARKQ about to try a well proven resistance again.
Dual fibs mark the rejection zone $82.83-83.34
Looking for a Break-and-Retest for long entries.

BTC Retrace RoadMap and 3 nearby supports worth watching NOWThis is a near-term followup to my big picture linked below.
Dip is underway after orbiting our Genesis Fib at 117.9k.
Quickly approaching the next three supports worth watching.
Supports get stronger below but each one needs to slow the dip.
$ 115,140 is a minor fib but possible end of dip wave.
$ 113,9xx is a double fib that should be pretty strong
$ 111,661 is the sister Genesis fib, and a MUST HOLD
.
Big Picture chart and why 117.9k was KEY
=======================================================
.

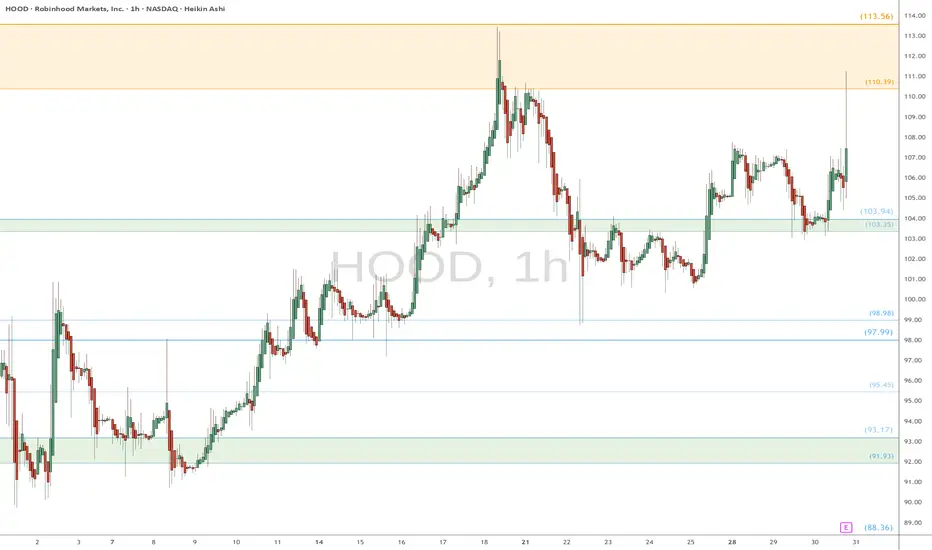
HOOD watch $110 then $113: Dual Golden fibs trying to TOP itHOOD has been a massive bull run since April lows.
Now battling a dual Golden fib zone $110.39-113.56.
Top of the zone is a well proven Golden Genesis fib.
See "Related Publications" for previous charts ------->>>>>>>
Such as this PERFECT catch of a serious bounce:
Hit BOOST and FOLLOW for more such PRECISE and TIMELY charts.
=========================================================
.
AGCO eyes on $120: Dual Fib Resistance to break and run to $140 AGCO earnings report was well received by the market.
Price surged into a resistance zone at $119.09-119.98
Looking for a Dip-to-Fib or Break-n-Retest to open longs.

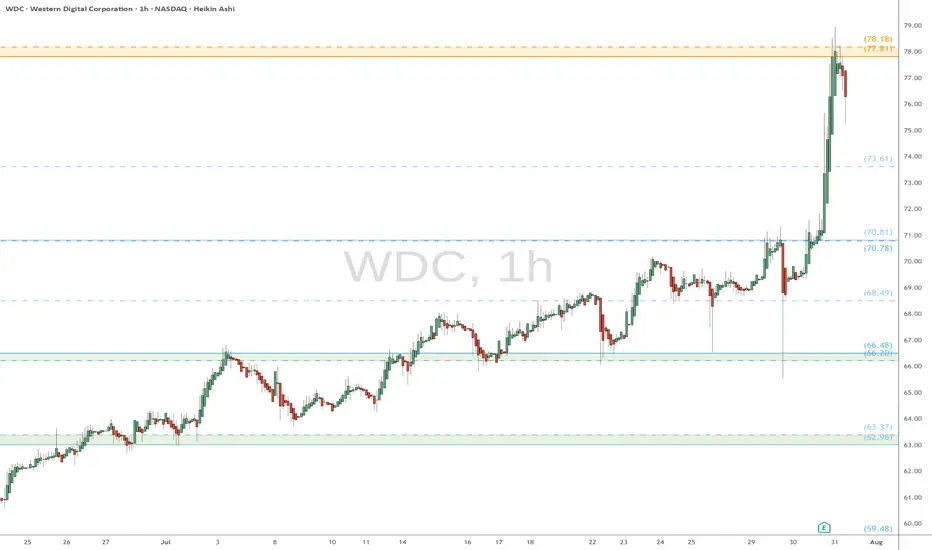
WDC eyes on $78: Double Golden fib zone should slow the surge WDC earnings report caused a break out from consolidation.
Price spiked into a Double Golden fib zone at $77.81-78.18
This "very high gravity" confluence should hold price for a bit.
Previous analysis that caught HUGE BREAKOUT
Hit BOOST and FOLLOW for more such PRECISE and TIMELY charts.
=========================================================
.
MS eyes on $119: Major Resistance may End Bounce or Strong BullMS recovering well from the tariff tantrum.
About to test a major resistance $119.08-119.20
Break would show strong bull, but dip more likely.
===========================================
.

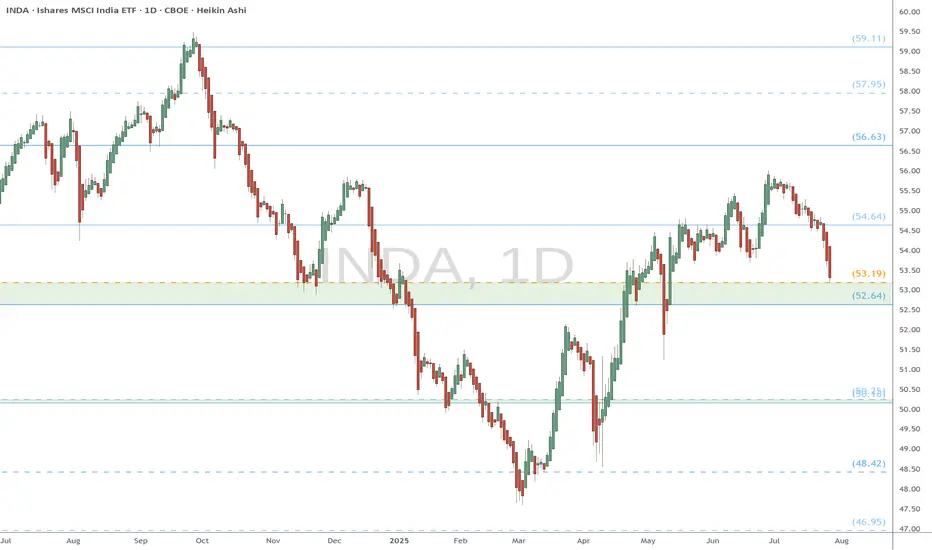
INDA eyes on $52.64-53.19: Major support could mark the BottomINDA painting a bottom with an inverted Head-n-Shoulders.
The neckline happens to be a fib confluence $52.64-53.19
Good spot to consider longs with stop loss just below zone.
ETH eyes on $3431.83: Golden Genesis fib may END this SurgeETH finally got a surge after a long consolidation.
But has just hit a Golden Genesis fib at $3431.83
Like hitting a brick wall, it is now staggering back.
It is PROBABLE that we orbit this fib a few times.
It is POSSIBLE that we reject here to end the surge.
It is PLAUSIBLE that we Break-n-Retest to continue.
We were here at this EXACT spot 8 months ago:
=============================================
.

DKS watch $170-172: Major Support that could mark a BottomDKS earnings report apparently disappointed.
Fell into a major support zone $170.01-172.12
Looking for a bounce to long or break to short.
.
Last Plot with a Perfect Road Map
=================================================

ULTA eyes on $455/457: Key support after Earnings spike and DipULTA had a good earnings report and spiked into resistance.
Now pulling back to first good support at $455.61-457.03
Look for this to hold, or dip below and then Break-n-Retest

XSD watch $243-245: Serious Resistance zone could cause a DipXSD has been grinding up as the chip sector comes back.
About to test a serious resistance zone $243.47-245.96
Look for a Dip-to-Fib or Break-n-Retest for long entries.

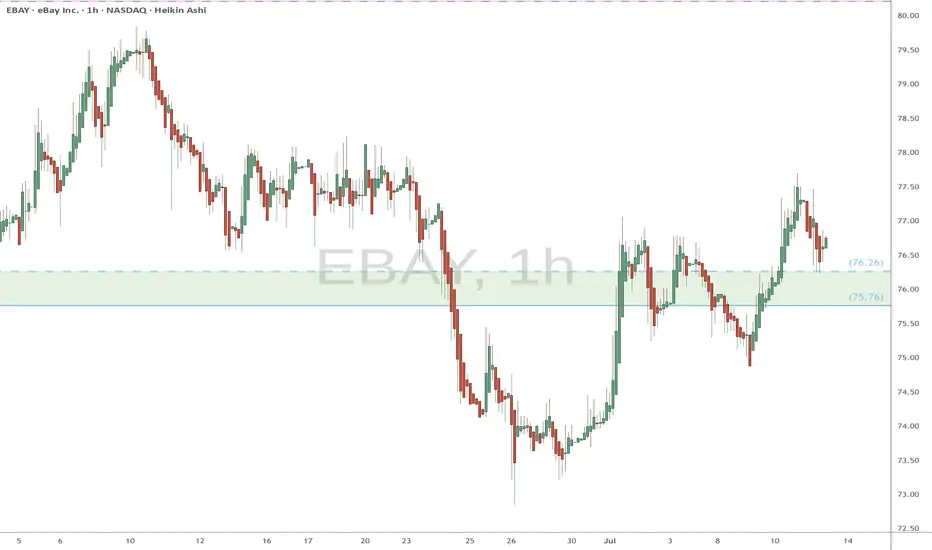
EBAY watch $75.76-76.26: Key Support zone to launch next Leg UP EBAY trying to get back above its ATH from 2021.
Now testing a key support zone at $75.76-76.26.
Good but late long entry with StopLoss just below.
.
See "Related Pubications" for previous charts such as THE BOTTOM call:
Hit the BOOST and FOLLOW for more PRECISE and TIMELY charts.
=========================================================
CCJ eyes on $45.37: semi-major Fib may dip to $42 for long entryCCJ trying to recover from the nuclear bubble burst.
Currently testing a semi-major Covid fib at $43.37
If it dips then watch the support zone $42.31-42.91

ORCL heads up at $212 then 220: Double Golden Fibs may STOP runORCL has been flying off the last Earnings report.
About to hit DUAL Golden fibs at $212.67-220.21
Ultra-High Gravity objects in its price-continuum.
It is PROBABLE to consolidate within the zone.
It is POSSIBLE to reject and dip to a fib below.
It is PLAUSIBLE but unlikely to blow thru them.
.
My last Plot that caught the BreakOut EXACTLY:
=================================================
.

AEHR watch $15.99-16.27: Major Resistance may give a Dip BuyAEHR has been flying high with the general market.
Approaching a significant resistance into $16 round.
$15.99-16.27 is the exact zone of concern up here.
.
Previous analysis that caught the BreakOut:
===============================================
.

IBKR watch $57.42-58:19: Double Golden Fib zone holding in OrbitIBKR has been in a strong uptrend but now consolidating.
Currently orbiting a Double Golden zone $57.42-58.19
This could be a TOP or a ReCharge zone for next leg.

DQ heads up into $19: Major Resistance to book some profitsDQ has been flying off our bottom call (see below).
Now testing a major resistance zone at $18.69-18.99
Good spot to book some profits and look for a dip to buy.
.
Previous analysis that called the BOTTOM:
===================================================
.

MOB eyes on $3.57: Break should POP and run OR Double TopMOB with a nice recovery from much needed retrace.
Once again testing the proven Golden Genesis fib at $3.57
If/when it breaks it should be a quick pop and then some.
