PG eyes on $165-166: proven Major Resistance to Pump or DumpPG trying to recover from the tariff bottom.
Currently testing a major Resistance zone.
Look for Dip to Green zone or Break-n-Retest.
Goldenratio

OKLO eyes on $30.95: Golden Genesis fib that might cause a Dip OKLO getting a lift along with the nuclear sector.
We have just hit a Golden Genesis fib at $30.95.
Look for a Dip-to-Fib or Break-n-Retest for entry.
.
Previous Analysis that called last years TOP:
==========================================
.

URNM eyes on $36.07: Golden Genesis to Mark Bottom or End BounceURNM trying to recover from a strong downtrend.
Currently testing a Golden Genesis fib at $36.07
Look for a Break-and-Retest to mark the Bottom.
.
Last Plot that called the TOP:
Also a Golden Genesis that marked the top.
============================================
.

KBWB eyes on $65.58: Golden Genesis Fib for bulls to BreakKBWB trying to resume uptrend but hit a Golden Genesis fib.
Looking for a Dip-to-Fib below or Break-n-Retest to enter.
There is another relevant fib just above so will be tough.

IBKR watch $210: Major Resistance to the tariff Bounce may Dip IBKR coming back strong from the Tariff Tantrum.
Now testing a major resistance at $209.26-210.26
Looking for a dip to support zone at $198.88-200.42

NNE watch $24.34: Golden Genesis fib to Break for a BIG pop NNE trying again to break the Golden Genesis fib at $24.34
Even the Fib-Blind can see this level VERY CLEARLY now.
So what happens here will say a LOT to a LOT of money.

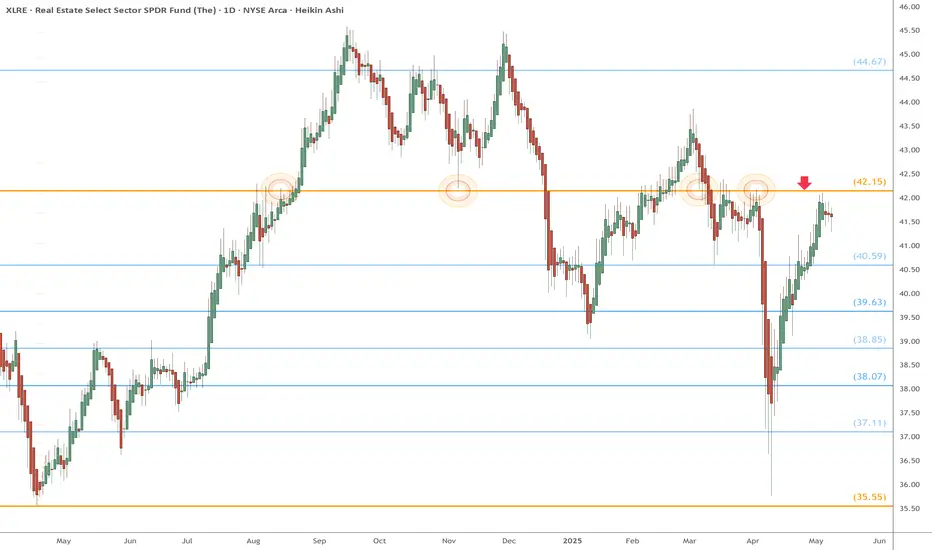
XLRE watch $42.15: proven Golden Genesis fib to determine TrendXLRE (Real Estate) has bounced back strong.
BUT just hit a Golden Genesis fib at $42.15
Look for a likely dip to one of the fibs below.
ETH — Bull Flag or Trap? Trade Plan with TargetsETH is setting the stage for its next major move — and the chart is packed with clues.
After completing Wave 3 at $2738.50, ETH has entered a corrective phase, forming what looks like a bullish flag. But beneath the surface, smart money levels are aligning: VWAP, Fibs, key levels, and liquidity traps are all converging around one high-probability zone.
This analysis breaks down both the long and short setups, backed by real confluence and clean R:R opportunities. Whether you’re planning to snipe the reversal near support or fade the rally at resistance, you’ll walk away with a clear trade plan and deeper insight into how price reacts at precision levels.
Let’s get into it.
🟢 Bullish Scenario: Long Setup with Deep Confluence
After a fakeout pump into the golden pocket of this minor downtrend (typical for a Sunday), ETH rejected cleanly at the upper resistance of the bull flag channel.
We're now watching for the swing low at $2406.63 to be swept, setting up a potential SFP (Swing Failure Pattern) at a highly confluent support zone:
🔍 Confluence at the $2390–$2360 Zone:
Anchored VWAP from the Wave 3 origin at $1752 is sitting at $2390
Trend-Based Fib Extension 1:1 of the correction lands at $2386.84
Liquidity pool just under the recent swing low
0.382 Fib retracement of the entire Wave 3 at $2361.66
0.618 Fib Speed Resistance Fan intersects this zone
Lower bull flag support line also aligns
This makes the $2390–$2362 zone a high-probability bounce area.
📌 Plan:
Laddered long entries between $2390–$2362, watching closely for a clean SFP or reversal signal.
Target 1: $3000 psychological level
Target 2: 0.618 Fib retracement at $3067.71 (potential Wave 5 top)
Stop-loss: Below previous yearly open (can be tightened after confirmation)
R:R: 1:5 or better after SL adjustment
🔴 Bearish Scenario: Short Setup at Key Rejection Zone
If ETH makes a move up to complete the 5th wave, we monitor $3067.71 — the 0.618 retracement of the entire corrective leg — as a key resistance.
If price rejects here with momentum loss or bearish structure:
📌 Plan:
Short on confirmed rejection of $3067.71
Stop-loss: Above $3211 (above 0.666 Fib)
Target: Previous high near $2700 or lower
R:R: 1:2 or better depending on entry and structure
🧠 Educational Insight: Why Confluence Increases Probability
Many traders chase setups based on single indicators. Real edge comes from stacking independent tools: VWAPs, Fibs, FVGs etc... When they align, the setup isn’t random — it’s high conviction.
This strategy gives you a framework to anticipate where price is likely to move and why, rather than reacting emotionally.
Patience and preparation will always outperform panic and reaction. Trade the plan — not the impulse.
___________________________________
If you found this helpful, leave a like and comment below! Got requests for the next technical analysis? Let me know.

HBAR Masterclass: Fib Precision + ConfluenceHBAR has been a dream to chart lately — beautifully technical, clean reactions, and a strong respect for structure. When a chart follows fibs this precisely, charting becomes fun — like solving a puzzle that pays. You stop forcing trades and start enjoying the process.
Let’s break down where the next high-probability trade setup lies — and why.
Elliott Wave Context
HBAR recently completed a 5-wave impulse structure and is now unfolding a ABC correction:
✅ Wave A: Broke below Wave 4's low
✅ Wave B: Rejected cleanly at the 0.618 retracement of Wave A
🔄 Wave C: Currently unfolding, with price structure hinting at a Head & Shoulders forming to the downside
Interestingly, HBAR has been bouncing between golden ratios like a Fibonacci pinball machine. — reinforcing how well this asset respects technical structure.
🟢 Long Opportunity: The Golden Pocket Zone
By pulling Fibonacci retracement from the entire 5-wave leg (from $0.16941 to $0.22885), we uncover the golden pocket:
0.618 Fib → $0.19212
0.666 Fib → $0.18926
But what really strengthens this zone is the confluence:
📍 21-Day EMA → $0.19361
📍 21-Day SMA → $0.19229
📍 Anchored VWAP from the $0.15396 low → ~$0.19135
📍 4/1 Gann Fan support (if reached between May 15–17)
Together, they form a tight support band between:
🎯 $0.195 – $0.18926
📐 How We Projected the 1.618 Target
Here’s where the magic of planning comes in.
If Wave C finishes within this golden pocket, we can anticipate the next move by applying a trend-based Fibonacci extension. This gives us a realistic projection for the next impulsive move:
📈 1.618 extension lands at → $0.28654
This level also aligns with the yearly level and previous key high — forming an ideal final target
📘 Educational Insight: Why Golden Pockets Matter
In trading, the “golden pocket” — the 0.618-0.666 Fibonacci retracement zone — is often where high-probability reversals take place. It’s a zone where buyers (or sellers) return with conviction after a correction. When this area also aligns with EMAs, anchored VWAPs, Gann levels etc. and previous structure, it becomes more than just a level — it becomes a decision zone.
This is where confluence transforms a trade idea into a trade setup.
🟢 Long Trade Setup:
Entry: Laddered between $0.195 – $0.18926
Stop-Loss: Below $0.185
Take-Profit: $0.28654
R:R: ~10:1
Potential Gain: ~+50%
🔴 Short Setup (If Rejected at Extension):
If price hits $0.28654 and shows exhaustion or bearish reversal patterns (SFP, engulfing candle, volume spike), a short could be considered:
Entry: ~$0.286
Stop-Loss: $0.2967 (better above $0.3)
Target: $0.2622
R:R: ~2:1
HBAR is giving us a textbook case of structure, rhythm, and precision. Whether it’s the golden pocket, the 1.618 extension, or the alignment of multiple tools — this is how clean setups are built.
Set your alerts. Trust the plan. Let the chart come to you.
In trading, silence is a skill — knowing when not to act is as powerful as knowing when to strike.
____________________________________
If you found this helpful, leave a like and comment below! Got requests for the next technical analysis? Let me know.

XRP Correction Complete? — Long Setup Aligned with Fib & OBXRP has completed a 5-wave impulse move. As expected, XRP is now in a corrective phase, pulling back after rejecting from a key resistance — and it’s doing so with technical precision.
The question now: where is the next high-probability long setup? Let’s break it down.
🧠 Market Structure & Key Zones
Using Fibonacci retracement from the base of the 5-wave impulse, we now have a potential golden pocket target aligned with major confluence.
🔽 Support Zone
🔹 0.618 Fib retracement: $2.2982
🔹 Daily Bullish Order Block: $2.2949
🔹 Daily 21 EMA: $2.329
🔹 Daily 21 SMA: $2.301
🔹 Liquidity pool
🔹 0.786 Fib Speed Fan (only if price drops between May 17–18)
This creates a high-confluence support cluster at ~$2.3 — a prime candidate for a long re-entry.
🟢 Long Trade Setup
Entry: Ladder between $2.32 and $2.28
Stop-loss: ~$2.21
Target: $2.7175 (0.618 Fib retracement of the corrective downtrend)
R:R: ~5:1
🔴 Short Setup (Conditional)
Trigger: Rejection at $2.7175
Entry: ~$2.7175
Stop-loss: Above $2.8033 (0.666 Fib) → set at ~$2.811
Take Profit: ~$2.56 or lower
R:R: ~2:1+ (dependent on entry confirmation and PA behaviour)
Shorts only valid if a clear rejection or SFP pattern emerges. If momentum is strong, this level may break — so wait for structure to confirm.
📘 Educational Insight: Why Confluence Matters
Too often, traders chase single-indicator signals. But real edge comes from confluence — when multiple tools (Fibs, MAs, Order Blocks, Liquidity, VWAPs, FVG, Speed Fans etc.) agree on the same zone. This alignment not only increases confidence in your entry, but also sharpens your risk management.
Think of it as building a case — the more aligned evidence you have, the stronger your trade thesis becomes.
📌 Summary
XRP is in a corrective phase after a 5-wave impulse
Clean rejection from weekly resistance → continuation of bearish trend
Long zone: ~$2.3
SL: ~$2.21 | TP: $2.7175 | R:R ~5:1
Optional short: $2.7175 rejection → SL $2.811 | TP $2.56
Precision isn’t about predicting — it’s about being ready when the chart speaks with clarity. Patience makes probability powerful.
___________________________________
If you found this helpful, leave a like and comment below! Got requests for the next technical analysis? Let me know.

NOW watch $805: Major resistance zone to break could pop 9%NOW is testing a key resistance zone at $804.36-806.76
Break-n-Retest may easily pop to target $884.44-886.81
Stop loss is also a good distance below at $753.37-758.73

ADSK watch $281-285: Major Resistance zone may give a Dip BuyADSK recovering nicely from the tariff turmoil.
But it has just hit a MAOR resistance zone of two fibs.
Golden Genesis at $285.49 and a Covid fib at $281.53
It is PROBABLE that we get a dip here
It is POSSIBLE to break and retest to GO
If is PLAUSIBLE for a local top for a while.
===============================================

NEE watch $67.21-67.34: Key Resistance zone to Recovery WaveNEE struggling against a well proven resistance zone.
$67.21-67.34 is the immediate resistance of note.
$68.78-68.40 is next resistance and scalp target.

MOD eyes on $92: Resistance to be proven as Support for next legMOD has just broken a proven resistance $91.64-92.00
Looking for a retest and confirmation as support next.
Next target is pretty close, solo fib at $97.40 so a scalp.

BTC eyes on 111.7k then 117.9k: next two Genesis Fibs of concernShown here is a single fib series in 3 different timeframes.
The Genesis Sequence has caught all major turns since 2015.
If there is a "top" around here, it will be one of these fibs.
$ 111,661.75 (Coinbase) is a minor ratio level
$ 117,868.00 is the Semi-Major fib ratio ABOVE.
$ 105,451.85 is the Semi-Major fib ratio BELOW.
.
==================
Previous Plots below
--------------------------
$104k Top of 2024:
$90k Dip call (scalp):
$75k Bottom call:
$69k Top of 2021:
===============================================
.

UNH watch $288-297: Double Golden zone a serious Long Term Buy?UNH keeps getting bad news but may have bottomed.
Wave may have tested Double Golden fibs successfully.
Looking for some consolidation then launch of recovery.
$287.91-296.92 (Gold) is the key zone of interest.
$382.05-384.18 (Red) is the first long term target.
$251.94-255.83 (Green) is the MUST_HOLD bottom.
.
Previous Analysis that caught the top EXACTLY
Follow and Boost to encourage more such PRECISE charts.
==================================================
.

BMY watch $46.xx: Double Golden zone that could mark the BottomBMY has been dropping along with pharma sector.
Bulls regained Double Golden zone but not safe yet.
Looking for a Break-and-Retest to mark the bottom.

AA eyes on $27.71: Top of Serious Support Zone for bulls to holdAA has been struggling for a while now.
Current wave up is retracing to a support.
Look for bounce here to continue uptrend.
$ 27.71 is a minor Covid fib at top of zone
$ 27.12 a Golden Genesis fib at zone bottom.
$ 29.44 is a semi-major Covid fib resistance.
=======================================
.

SUI — Breakout or Breakdown? Long & Short SetupsSUI has been trapped in a trading range for the past 6 days, consolidating between key levels and building up liquidity for the next big move. When price goes quiet like this after an impulsive structure, it’s not time to trade—it’s time to observe, analyse, and prepare.
So, where’s the next high-probability setup?
Let’s break it down:
🔹 Elliott Wave Context
From my previous SUI analysis, I identified a completed 5-wave impulse structure. After such a move, a corrective ABC pattern is typically next.
SUI has been respecting technical levels with surprising accuracy throughout this cycle—especially Fibonacci levels and key horizontal zones.
📉 ABC Correction in Progress?
Wave A appears to be completed, and Wave B was rejected at the yearly level in perfect confluence with the golden pocket (0.618–0.666) retracement of Wave A. This strongly suggests that Wave C is now unfolding.
Using the 1:1 trend-based Fib extension, the projected Wave C target lands at:
➡️ $3.6413
Let’s dig deeper—does this level hold up under further scrutiny?
🔍 Multi-Layered Confluence at $3.56–$3.64
Here’s what aligns at this potential support zone:
1:1 Fib extension (Wave A = Wave C) → $3.6413
0.55 Fib retracement (from $3.1132 to $4.2967) → ~$3.64
Volume Profile POC from prior range → ~$3.59
0.618 Fib retracement → $3.5653
Weekly level → $3.5594
21-Day EMA → $3.5537
21-Day SMA → $3.6319
0.75 Fib Speed Fan (if hit on May 16) → aligns with zone
This stack of levels gives us a tightly packed, high-conviction support area between:
📍 $3.56 – $3.646
___________________________________
🟢 Long Setup Idea:
Entry Zone: Ladder entries between $3.56 and $3.75
Stop-Loss: $3.4546 (beneath confluence zone)
Take-Profit Target: $4.588 (0.786 Fib retracement + -0.236 Fib extension)
R:R: ~5:1
🚫 Invalidation: If SUI reclaims the yearly level at $4.1152 before revisiting this support, the setup is invalidated.
🔴 Short Setup Idea:
If SUI pushes into the 0.786 Fib retracement at $4.588 and shows clear rejection (e.g., SFP, bearish engulfing, high-volume reversal), a short can be considered.
Entry: On rejection at $4.588
Stop-Loss: ~$4.714
Targets:
TP1: $4.325 (recent highs)
TP2: $4.1152 (yearly level)
🧠 Final Thoughts:
This is where trading becomes a game of patience. I’ve mapped both long and short setups based on structure, confluence, and price behaviour. Now it’s about waiting for price to come to your levels.
⏰ Alarms set.
📈 Let the chart do the work.
More updates to come as the range resolves. Stay sharp!
___________________________________
If you found this helpful, leave a like and comment below! Got requests for the next technical analysis? Let me know.

BUD eyes on $65.86: Key Support for Tariff Recovery waveBUD probably immune to Tariffs but not market sentiment.
It has recovered well but bulls must hold support at $65.86.
Strong bounce should easily run to Golden Genesis at $69.15.

DXY watch 99.69: interesting number and a Major Fib for support DXY has been all over the place thanks to Trump.
That latest dip wave has hit a major fib at $99.69
This should offer some support if not a bottom.
We all know the implications of DXY movements.
Gold, Stocks, Crypto, all orbit the mighty Dollar.
Bulls need to mount a defense here and right now.
=============================================

META watch $545-549: Resistance to End Bounce unless strong BullMETA struggling with anti-trust case and AI spend factors.
Currently up against a key Resistance zone $545.51-549.38
If it dips then watch solo fib at 532.20 or zone 504.44-508.71
.
Previous Analysis calling $489 as possible bottom:
"Genesis Sequence" that has caught every major turn:
===========================================================

SOL Trade Blueprint: Waiting for the High-Conviction EntryAfter printing a SFP at the key high of $180.52 followed by a sharp -8% rejection, SOL made a second attempt to breach the major resistance zone between $180–$185 — but once again, bulls fell short. Since then, price has been in a corrective phase. So the big question is: where’s the next high-probability trade setup? Let’s zoom out and break it down.
📏 Zooming Out: Structure, FVG & Fib Confluence
Back on May 8th, SOL broke through the April 25th swing high at $157 with strong momentum, leaving behind an untested Fair Value Gap (FVG) — a key displacement area that’s yet to be filled. When we draw the Fibonacci retracement from the low of that move to the current high, the 0.618 retracement lands precisely at $157.34 — right on the old breakout high. That’s a beautiful confluence.
Timing-wise, if SOL pulls back to that level between May 21–22, the 0.75 Fib speed fan also kicks in — adding dynamic trendline support to the static Fib level.
📉 What About the $164 Golden Pocket?
There's a golden pocket forming around $164 from a recent mini-impulse, and while it may look tempting, context matters. This pocket isn't supported by enough confluence — no major structure, volume shelf, or EMA alignment. For a quick scalp? Yes. But for a high-conviction swing? It's not ideal.
Remember, in trading we're not here to chase every candle — we're here to wait for the setups that stack the most reasons to say yes.
📍 The Zone to Watch: $157
Now let’s talk about that $157 zone — and why it’s standing out as the highest-probability long setup:
0.618 Fib retracement of the major impulse
Retest of the breakout swing high
Untested Fair Value Gap (FVG)
233 EMA + 233 SMA on the 4H timeframe lining up as dynamic support
1.5 outer pitchfork support line crossing through
1:1 trend-based Fib extension confluence
Prior area of interest
This is what we call a “stacked setup.” The more layers of confluence, the more conviction we have in the trade. Add to that the potential for a liquidity sweep (SFP) just below the current low at $159.44 — and it becomes a zone worth watching closely.
🎯 Long Setup:
Entry: $157–$159.44 (watch for SFP confirmation)
Stop-Loss: Below $154
Target: $200
R:R: Approx. 1:12 — a setup worth being patient for
🧠 Educational Note: Why Confluence Is King
High-probability trades don’t come from guessing. They come from stacking confluence: structure, Fibonacci, moving averages, time-based levels, pitchforks, VWAPs, volume profiles — the more that lines up, the less you need to hope and the more you can trust your edge. Think like a sniper, not a machine gun.
The market rewards patience and precision — not noise and FOMO.
🔻 Short Setup (Alternative Play)
While we’re primarily bullish, there’s a valid short opportunity at the psychological $200 mark — but only if price shows clear rejection and confirmation (e.g. SFP, bearish engulfing, high volume reversal).
Entry: $200 rejection
Stop-Loss: Above $205
Target: $185–$180
R:R: Approx. 1:3+
🔥 Final Words: Trade With Purpose
This is what trading is about — not chasing green candles, but waiting for structure, clarity, and alignment. Whether you’re trading long or short, focus on high-conviction setups backed by logic and levels, not emotion.
Don’t trade for action. Trade for precision. The market will always reward the patient ones who are willing to wait for that clean entry, stacked with reasons to act.
Trust the process, stay disciplined, and let the charts do the talking. 💪📈
___________________________________
If you found this helpful, leave a like and comment below! Got requests for the next technical analysis? Let me know.
