XAUUSD Analysis todayHello traders, this is a complete multiple timeframe analysis of this pair. We see could find significant trading opportunities as per analysis upon price action confirmation we may take this trade. Smash the like button if you find value in this analysis and drop a comment if you have any questions or let me know which pair to cover in my next analysis.
Goldforecast

Gold Crashes $100 After Hitting Monthly High | What’s Next?In this video, I break down everything that moved the price of gold last week, from the early-week rally toward $3,430 to the sharp midweek drop toward $3,325. We go beyond the surface, diving into what caused the reversal, and how I'm approaching next week’s market using a simple ascending channel on the 4-hour chart.
With major events like the FOMC rate decision, U.S. GDP, PCE inflation, NFP and the August 1 tariff deadline all on the radar, this analysis will help you stay grounded and prepare for volatility.
👉 If you find this content valuable, don’t forget to Boost, Comment, and Subscribe for weekly market breakdowns.
Disclaimer:
Based on experience and what I see on the charts, this is my take. It’s not financial advice—always do your research and consult a licensed advisor before trading.
#goldanalysis, #goldforecast, #xauusd, #goldpriceprediction, #technicalanalysis, #fundamentalanalysis, #tradingstrategy, #forextrader, #priceaction, #fomc, #usgdp, #pceinflation, #goldtrading, #forexeducation, #dollarvsgold, #tariffnews, #chartanalysis, #forexmentorship, #rebuildingthetraderwithin

XAUUSD and AUDUSD Analysis todayHello traders, this is a complete multiple timeframe analysis of this pair. We see could find significant trading opportunities as per analysis upon price action confirmation we may take this trade. Smash the like button if you find value in this analysis and drop a comment if you have any questions or let me know which pair to cover in my next analysis

XAUUSD Analysis : Channel Break, Demand Zone + SR - Interchange"High-Probability Zone Reaction & SR Flip Confirmation"
Gold (XAUUSD) is currently reacting from a significant support zone after completing a bearish breakout from a well-established ascending channel. The market structure indicates both threat and opportunity depending on how price behaves around key levels ahead.
🔍 Structure Breakdown & Price Behavior:
🔹 1. Rising Channel Violation
Over the past few weeks, price was comfortably moving inside a well-respected ascending channel, making higher highs and higher lows.
Recently, however, price broke below the lower boundary, which is often a bearish signal—indicating a possible trend reversal or a deeper correction phase.
Such breakdowns suggest buyers are losing control, and bearish sentiment is gaining strength.
🔹 2. Supply Zone Reaction & Drop
Before the breakout, we observed a sharp rejection from a high point, triggering a sell-off.
The price completed its move into a previously defined supply zone, resulting in a strong bearish impulsive leg that pushed it outside the channel.
This move shows clear institutional distribution—where large sellers unloaded positions around that zone.
📍 Key Zone Focus:
🟩 Previous Reversal / Demand Zone (Green Box)
Price is now sitting in a historically strong demand zone, which acted as a major reversal point in the past.
This area is marked as the first zone of interest where buyers might step back in to defend.
The green box represents a liquidity pocket where institutions previously accumulated positions—hence it’s a strong bounce candidate.
🟦 SR Interchange Zone (Blue Box)
The next major level above current price is the SR Interchange zone, around 3,320–3,340.
This level was previously broken and now acts as resistance.
It's crucial because it represents the battle zone where the market will decide whether to continue bearish or shift back bullish.
🧠 Market Psychology & Order Flow Insight:
The recent aggressive selling pressure from the highs, followed by a bounce from the demand zone, shows a shift from euphoria to fear.
Sellers are active at supply, while buyers are attempting to defend the previous demand.
The market is currently in decision mode—and the SR flip zone (3,320–3,340) will be the judge.
A break and retest above this level signals strength and potential for a trend resumption.
A failure to reclaim it would confirm bearish dominance and open doors for deeper targets.
🔄 Possible Scenarios Ahead:
📈 Scenario 1 – Bullish Rejection & Breakout:
If buyers successfully hold the 3,280–3,260 demand zone and push price above the SR Interchange zone, we can expect:
📍 Target 1: 3,360 (mid-term resistance)
📍 Target 2: 3,400–3,420 (previous high & upper trendline)
This would confirm a fakeout from the channel and a bullish continuation pattern.
📉 Scenario 2 – Failure at Resistance & Drop Continuation:
If price fails to reclaim the interchange zone, expect a retest of the green demand, followed by a potential drop toward:
📍 3,260 – local support
📍 3,240 – major support (unfilled demand below)
📍 3,220–3,200 – ultimate downside target
This would solidify a bearish market structure, confirming the sellers are in control.
🧭 Key Levels To Watch:
Level Type Price Range Significance
Supply Zone ~3,400–3,420 Major institutional selling area
SR Interchange (Blue) ~3,320–3,340 Critical resistance / flip zone
Current Price ~3,297 Watching reaction for momentum shift
Demand Zone (Green) ~3,280–3,260 Key support / bounce zone
Major Demand Pending ~3,240–3,220 Next support level if drop continues
✅ Conclusion:
Gold is at a critical inflection point.
The recent bearish breakout signals weakness, but the current support zone may provide a short-term bullish setup if buyers defend it effectively. A successful reclaim of the SR flip zone will shift sentiment bullish again. Otherwise, a deeper correction is likely.
This setup is ideal for both swing and intraday traders—look for confirmation signals at the current support and SR zone before executing trades.
Gold Slipping Lower — 3250 and 3200 in Sight!✅ Gold & DXY Update – Post-FOMC Price Action
Earlier today, before the U.S. interest rate decision, I released my outlook on both the Dollar Index and gold.
In that analysis, I highlighted the DXY’s readiness to move toward the key level of 100 — and as of now, price is actively testing that exact zone, just as expected.
As for gold, I repeatedly emphasized the visible weakness on the buy side. It was clear that there were very few remaining buy orders strong enough to hold price up in this region — and that’s exactly what played out. Price has started pushing lower, in line with our expectations.
Looking ahead, I believe the first target is 3250, followed by a deeper move toward the liquidity zone and the marked box around 3200, which could act as a key target area in the coming days.
🔁 This analysis will be updated whenever necessary.
Disclaimer: This is not financial advice. Just my personal opinion.

Gold Holds Trendline Amid Rising MomentumFenzoFx—Gold remains above the ascending trendline, trading around $3,386.0. Technical indicators like RSI 14 and Stochastic show rising momentum, reinforcing the bullish bias.
Immediate support lies at $3,347.0. If this holds, XAU/USD may climb toward the monthly VWAP at $3,412.0.
The bullish outlook is invalidated if Gold closes below $3,347.0, which opens the door for further downside toward the next support at $3,307.7.

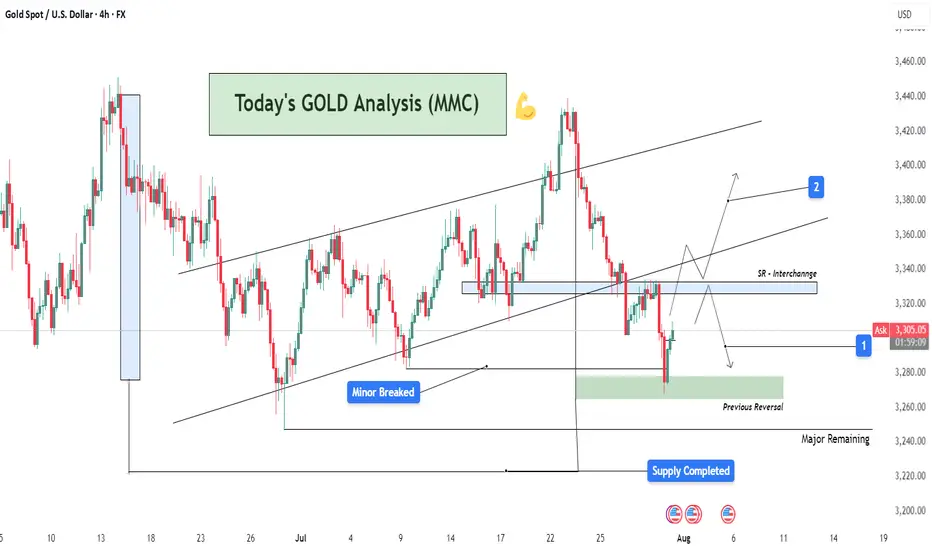
GOLD Analysis : XAUUSD Major Bullish Demand Zone🧠 Market Structure Context (MMC Framework)
Gold has recently shown a clean structural decline from its local highs within a well-defined ascending channel. This analysis highlights a reaction zone-based playbook, focusing on high-probability reversal scenarios guided by institutional footprints, volume reaction points, and MMC logic.
We’re currently trading near a previous reversal zone, where history tells us the market tends to shift behavior. Let’s dissect the key components.
📊 Key Technical Components
🔸 1. Ascending Channel Breakdown
The entire uptrend was respecting a well-established bullish channel until the recent drop violated the midline structure. This breakdown confirms a temporary bearish phase, with price breaking cleanly below a QFL base (Quick Flip Level)—a level where price reversed sharply before, which now acts as a major supply zone.
Psychological Insight: Channels give clues about momentum. Breaking below the lower band shows the market is preparing for a retest or a deeper liquidity hunt.
QFL Breakdown: Once broken, previous buyer confidence is shaken—inviting sellers to test demand zones.
🔸 2. Previous Reversal Zone (PRZ) Reaction
Currently, price is hovering inside the blue shaded Previous Reversal Zone, where bullish pressure previously kicked in. It’s a minor demand zone, but critical due to historical reaction. The projected structure shows a bounce from this area before deciding next direction.
MMC Insight: The first test of PRZ often leads to an initial reaction. But deeper liquidity lies just below in the major green demand zone.
🔸 3. Major Demand Zone + Volume Burst Area (The Real Magnet)
Below the PRZ lies the major reversal block—highlighted in green. This zone is significant because:
It aligns with a high-volume burst in the past, confirming institutional orders.
It's a cleaner structure level for smart money re-entry.
It also provides room for the “liquidity sweep” (stop hunt), collecting sell stops before a proper reversal.
💡 Expected Play: Price may fake out below PRZ, enter the major demand, and then initiate a multiple-leg bullish rally. Patience is key here.
🛠️ Trade Structure Outlook
✅ Scenario 1 – Aggressive Buyers (Marked "1"):
Buy from the current PRZ zone around $3,305–$3,315
Target: $3,340 (Minor Resistance)
Risk: Slippage into deeper demand zone
Stop-loss: Below $3,295
✅ Scenario 2 – Safer Entry from Major Demand (Marked "2"):
Let price dip into $3,270–$3,280 zone (green box)
Look for reversal candles or liquidity sweeps on lower timeframes
TP1: $3,330
TP2: $3,365 (Major Resistance)
📈 Resistance Levels to Watch:
Minor Resistance: $3,340 – Expect short-term pullbacks or hesitation.
Major Resistance: $3,365 – Key target for swing traders and potential reversal zone.
🔍 MMC Concepts in Action
✅ Channel Logic: Breakdown implies momentum shift—watch for retests.
✅ QFL: Previous bounce zone broken = supply now overhead.
✅ Volume Burst Zone: Strong historical reaction = institutional interest.
✅ Zone-to-Zone Trading: Instead of random entries, focus on logical zone interactions.
🧭 Conclusion – Path of Probability
Gold is currently in a transitional phase—shifting from bearish correction to potential bullish revival. Patience will reward those who wait for PRZ rejections or deeper liquidity taps. The MMC framework helps frame this market not as chaos, but a map of strategic reaction points.

Gold at a Crossroads: $100 Drop Ahead or New All-Time High?Gold is now sitting at a critical decision zone near the $3300 level — a key bank-level area. If we see a daily candle close below this level, I anticipate a minimum drop of 1,000 pips, with the first major support around the $3220–$3200 range. The $3200 level is extremely significant, and I’ll discuss its importance more in future updates if necessary.
On the flip side, if buyers step in and we get a daily close above $3300, I still believe it’s too early to jump into longs. The selling pressure remains quite obvious, and we’ve already seen multiple failed attempts to push beyond this level toward the $3500 all-time high. That tells me the orders at this level might be exhausted.
Personally, I’ll only consider a long position if we get at least a clean 4-hour candle close above $3350.
It’s going to be an exciting week ahead with high-impact data releases including ADP, Core PCE, the Federal Funds Rate — and most importantly, Friday’s NFP.
📌 Stay tuned for updates throughout the week!
Disclaimer: This is not financial advice. Just my personal opinion!!!

XAUUSD and AUDUSD Analysis todayHello traders, this is a complete multiple timeframe analysis of this pair. We see could find significant trading opportunities as per analysis upon price action confirmation we may take this trade. Smash the like button if you find value in this analysis and drop a comment if you have any questions or let me know which pair to cover in my next analysis.

Gold: $3,348.0 Resistance in Focus for BullsFenzoFx—Gold's decline reached the ascending trendline near $3,314.0. The bullish trend remains intact while price holds above the trendline.
Immediate resistance is $3,348.0, and a close above this level could lift the market toward $3,389.0 and potentially $3,451.0, aligning with recent higher-lows.

XAUUSD Analysis TodayHello traders, this is a complete multiple timeframe analysis of this pair. We see could find significant trading opportunities as per analysis upon price action confirmation we may take this trade. Smash the like button if you find value in this analysis and drop a comment if you have any questions or let me know which pair to cover in my next analysis

XAUUSD Top-down analysis Hello traders, this is a complete multiple timeframe analysis of this pair. We see could find significant trading opportunities as per analysis upon price action confirmation we may take this trade. Smash the like button if you find value in this analysis and drop a comment if you have any questions or let me know which pair to cover in my next analysis.

XAUUSD Analysis todayHello traders, this is a complete multiple timeframe analysis of this pair. We see could find significant trading opportunities as per analysis upon price action confirmation we may take this trade. Smash the like button if you find value in this analysis and drop a comment if you have any questions or let me know which pair to cover in my next analysis.

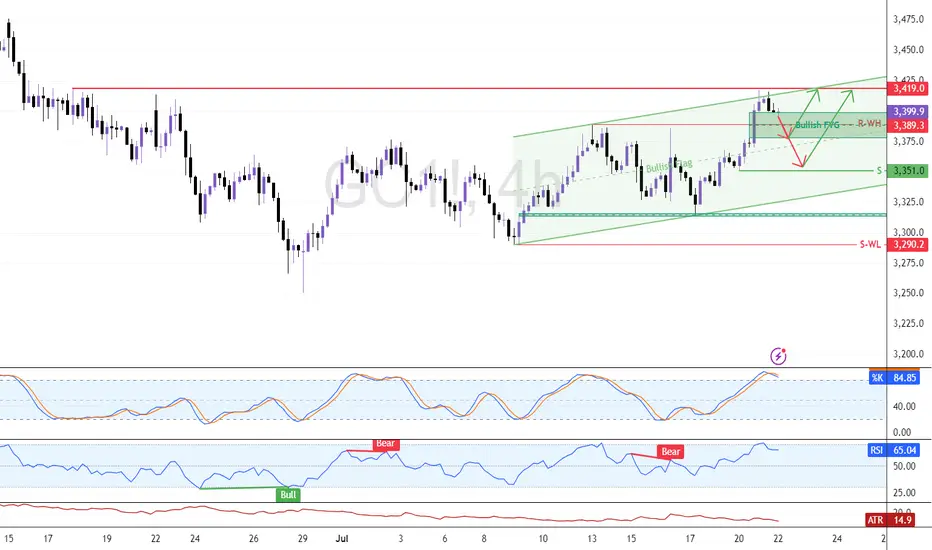
Eye These Levels to Go Long On GoldFenzoFx—Gold remains bullish but eased at $3,419.0 resistance. The Stochastic at 85.0 suggests a pullback may follow. Traders can watch support at $3,389.0 for short-term scalping.
Swing entries may emerge near $3,351.0 if bullish signals appear, such as candlestick patterns, structure breaks, or fair value gaps. Updates will follow if price reacts to these levels.
XAUUSD Analysis Today Hello traders, this is a complete multiple timeframe analysis of this pair. We see could find significant trading opportunities as per analysis upon price action confirmation we may take this trade. Smash the like button if you find value in this analysis and drop a comment if you have any questions or let me know which pair to cover in my next analysis.

Today's GOLD Analysis – Structural Breakout and Bullish Setup🔷 1. Descending Channel – End of Bearish Phase
The chart initially shows Gold trading inside a well-defined descending channel, where price was consistently respecting both upper and lower trendlines. This movement reflected short-term bearish pressure, likely driven by fundamental uncertainty and lower time frame liquidity grabs.
However, the price broke above the channel with a strong bullish candle, which is a clear sign of momentum shift. Breakouts like these usually signify the end of a corrective phase and the beginning of a trend reversal or impulsive leg.
🔷 2. Minor Break of Structure (BOS) – First Confirmation
Following the channel breakout, price broke through a minor structure zone around 3,345–3,350, confirming a short-term change in market direction. This zone, previously acting as resistance, is now functioning as support (noted as “Minor SR - Interchange” on the chart).
This BOS is important because it represents the first break of a lower high in the previous downtrend, which is an early sign that buyers are stepping in with strength.
🔷 3. Retest and Clean Reaction – Support Validated
After breaking structure, the market retraced back into the broken zone, validating it as new support. This is a classic market behavior where price retests previous resistance to gather liquidity before moving higher — a key concept in Smart Money Concepts (SMC).
The bullish rejection from this zone further confirms the validity of the breakout and indicates that institutional buyers may be active in this region.
🔷 4. Current Price Action – Building Momentum
Price is now hovering near 3,355, building bullish structure with a series of higher highs and higher lows. This setup aligns with a continuation move toward the next liquidity target or resistance zone, which is:
✅ Reversal Zone: 3,375–3,380
This zone is marked as the next high-probability area where price might:
Face short-term resistance
Grab liquidity above previous highs
Possibly react with a pullback
The highlighted reversal zone (target: 3,378.23) is crucial because:
It aligns with previous supply
It could act as a decision point for larger time frame traders
It’s where a Major Break of Structure might occur if price breaks and holds above it
🔷 5. Projection & Scenario Planning
Here’s how the next move could play out:
Bullish Scenario: If price maintains support above the 3,350 zone, a rally toward 3,378 is expected. A strong close above this level would shift the larger structure bullish, confirming a major trend reversal.
Bearish Scenario (Short-Term): If price fails to break 3,378, we could see a pullback into the 3,345–3,350 area again. However, as long as this support holds, the bullish bias remains intact.
🔐 Key Technical Concepts Used:
Channel Breakout
Minor BOS & SR Flip
Liquidity Sweep
Reversal Zone (Supply Area)
Trend Structure Shift
📌 Conclusion:
Gold has broken out of its bearish channel and confirmed a short-term bullish structure. The recent breakout and retest give buyers a strong foundation to push toward the 3,378 zone. This is the key reversal area, and the reaction from here will define whether Gold continues to rally or faces a temporary pullback. For now, bulls are in control, and the market structure supports a continuation move.

Gold. - Bullish (structure still valid) • Daily: Maintaining higher lows along the trendline. Strong support at 3,300.
• 4H: Still respecting the diagonal, and showing strength despite short-term pullbacks.
• 1H: Breakout from descending trendline and now retesting the breakout zone at 3,350.
⚠️ Watch For:
• Clean bullish break above 3,365 confirms new impulse wave toward 3,400+.
• Support at 3,335 must hold to avoid flipping neutral.
• Patience required if price consolidates between 3,340–3,360.

XAUUSD Analysis todayHello traders, this is a complete multiple timeframe analysis of this pair. We see could find significant trading opportunities as per analysis upon price action confirmation we may take this trade. Smash the like button if you find value in this analysis and drop a comment if you have any questions or let me know which pair to cover in my next analysis.

XAUUSD Analysis todayHello traders, this is a complete multiple timeframe analysis of this pair. We see could find significant trading opportunities as per analysis upon price action confirmation we may take this trade. Smash the like button if you find value in this analysis and drop a comment if you have any questions or let me know which pair to cover in my next analysis.

XAUUSD Analysis todayHello traders, this is a complete multiple timeframe analysis of this pair. We see could find significant trading opportunities as per analysis upon price action confirmation we may take this trade. Smash the like button if you find value in this analysis and drop a comment if you have any questions or let me know which pair to cover in my next analysis.

Gold/XAUUSD Analysis Breaks Bullish Channel – Targeting 3400+🟨 Market Context:
Gold (XAU/USD) has recently completed a significant technical move that signals the potential start of a strong bullish continuation phase. After a period of consolidation inside a descending channel, price has broken above key resistance levels and is showing firm buyer strength across the board.
🔍 Technical Structure Breakdown:
🔹 Descending Channel (Consolidation Phase)
For several sessions, gold was confined within a well-defined descending channel, which typically indicates a temporary correction in a broader bullish trend. This phase served as a liquidity-building zone where smart money accumulated long positions.
🔹 Breakout & Retest Confirmation
The breakout above the upper boundary of the channel was clean and impulsive, confirming bullish intent. This breakout aligned perfectly with a previous demand zone (now retested as support), adding strong confluence.
Key Breakout Zone: $3,330–$3,340
Retest Action: Price pulled back to test the breakout zone, respected it, and printed a bullish reversal.
This behavior confirms the “breakout–retest–continuation” pattern—highly reliable in trending markets.
🔹 SR Interchange – Key Pivot Zone
The level around $3,340 served a dual role:
Previously acted as resistance within the channel.
Now acting as support post-breakout (SR flip).
This interchange area is significant because it reinforces the idea that bulls are now defending this level aggressively.
🔹 Bullish Pattern Confirmation
A bullish price pattern has formed exactly at the SR zone and near the trendline. This double confluence (pattern + level) provides high-probability trade setups and confirms the entry point for buyers.
🔹 Ascending Trendline Support
An emerging bullish trendline is now guiding the move upward, confirming that the market has shifted its short-term trend. Every bounce on this trendline reinforces bullish structure and validates higher-low formations.
🎯 Price Targets & Expectations:
✅ Previous Target Zone:
Around $3,375, already tapped and respected.
This shows that gold is following technical targets with precision.
🎯 Next Bullish Target:
$3,400 – $3,410 zone stands as the next supply region.
This area is a major psychological resistance and aligns with historical reaction points.
🧠 Trading Insight & Strategy:
With current price action and momentum, buying dips remains the optimal approach, provided the price stays above the SR Interchange zone.
🔽 Entry Zone: $3,345 – $3,350
📈 Targets:
TP1: $3,375 (partial exit)
TP2: $3,400–$3,410 (final target)
❌ Invalidation Zone (Stop Loss): Below $3,330
Breaking below this would invalidate the breakout structure and possibly signal a false breakout.
📌 Summary:
✅ Clear breakout from descending channel
✅ Retest of previous demand and SR flip zone
✅ Bullish pattern confirmed on key support
✅ Ascending trendline intact
🎯 Next logical move: $3,400+
The gold market is giving strong bullish cues, and this setup could be a textbook example of “buy the breakout, ride the trend.”
Stay sharp, trade smart, and keep your risk in check. 👑

Gold Weekly Analysis | Will $3,360 Break or Hold? [July 14–18]In this video, I break down the recent gold price action and what to expect in the coming week. We’ll review how gold responded to last week’s FOMC minutes, why $3,360 remains a key decision zone, and what upcoming U.S. economic data (CPI, PPI, Retail Sales) could mean for price movement.
👉 If you find this content valuable, don’t forget to Vote, Comment, and Subscribe for weekly market breakdowns.
Disclaimer:
Based on experience and what I see on the charts, this is my take. It’s not financial advice—always do your research and consult a licensed advisor before trading.
#GoldAnalysis, #XAUUSD, #ForexTrading, #GoldForecast, #MarketOutlook, #TechnicalAnalysis, #FundamentalAnalysis, #GoldPrice, #FOMC, #CPIData, #PPIdata, #DollarIndex, #TradingStrategy, #WeeklyOutlook, #GoldTechnicalAnalysis, #TradeSmart, #Darcsherry

XAUUSD Analysis : Bullish Move Toward Key Resistance + Target🟩 Overview:
Gold is currently showing a clear bullish breakout on the 2-hour timeframe. The market structure has shifted from a downtrend into a bullish phase, with price now approaching a critical Reversal Zone. Let’s break down the key levels, structure shifts, and potential trade opportunities.
🔍 1. Structure Shift – Trendline Break & BOS Signals:
The price previously followed a Blue Ray Descending Trendline, which acted as dynamic resistance and guided the bearish trend.
As highlighted, “Blue Ray Always Continue Trend” – but in this case, we’ve seen a clean Break of Structure (BOS) that invalidated the bearish setup.
A Minor BOS occurred first, which hinted at weakening selling pressure.
Later, a Major BOS confirmed the bullish transition as the price broke above a key resistance level with strong momentum.
This transition was supported by consistent higher lows and a breakout above the descending resistance trendline — a classic reversal signal.
🟩 2. Demand Zone Reaction – Major Support Held Firm:
The Major Support Zone between $3,280 – $3,300 provided a strong base for buyers.
Multiple wick rejections and bullish engulfing patterns near this zone indicated aggressive buyer interest.
This support has now become the foundation for the recent bullish rally.
🎯 3. Next Target & Reversal Zone:
The current price is hovering around $3,358, showing strong bullish momentum.
The next major resistance area is marked between $3,380 – $3,400, identified as the Next Target + Reversal Zone.
This zone is critical — it aligns with a historical supply area and the previous market swing highs.
Traders should be cautious here, as price may react sharply. Reversal patterns (like bearish engulfing, pin bars, or double tops) could signal a potential retracement.
⚠️ 4. Trade Plan:
🟢 Bullish Bias (Short-Term):
If you entered from the support or trendline breakout, continue to hold long positions until price nears the reversal zone.
Trail stop-loss under the most recent higher low to secure profits.
🔴 Bearish Scenario (Near-Term Reversal Play):
Watch for bearish rejection patterns in the $3,380 – $3,400 zone.
If confirmation appears, potential short setups could offer a retracement back to $3,330 – $3,320.
📌 Key Levels Summary:
Major Support Zone: $3,280 – $3,300 ✅
Next Target + Reversal Zone: $3,380 – $3,400 ⚠️
Current Price: $3,358
Major BOS Level: Confirmed
Trendline: Broken with strong bullish pressure
🧠 Final Thoughts:
Gold has officially shifted gears. The bullish breakout is in motion, and the trendline break + BOS combo supports further upside — at least until the reversal zone is tested. However, this is also where the market could exhaust, making it crucial to monitor price action closely.
Stay patient, wait for confirmation, and let the levels guide your next move.
