XAUUSD Analysis todayHello traders, this is a complete multiple timeframe analysis of this pair. We see could find significant trading opportunities as per analysis upon price action confirmation we may take this trade. Smash the like button if you find value in this analysis and drop a comment if you have any questions or let me know which pair to cover in my next analysis.
Goldforecast

XAUUSD Analysis todayHello traders, this is a complete multiple timeframe analysis of this pair. We see could find significant trading opportunities as per analysis upon price action confirmation we may take this trade. Smash the like button if you find value in this analysis and drop a comment if you have any questions or let me know which pair to cover in my next analysis.

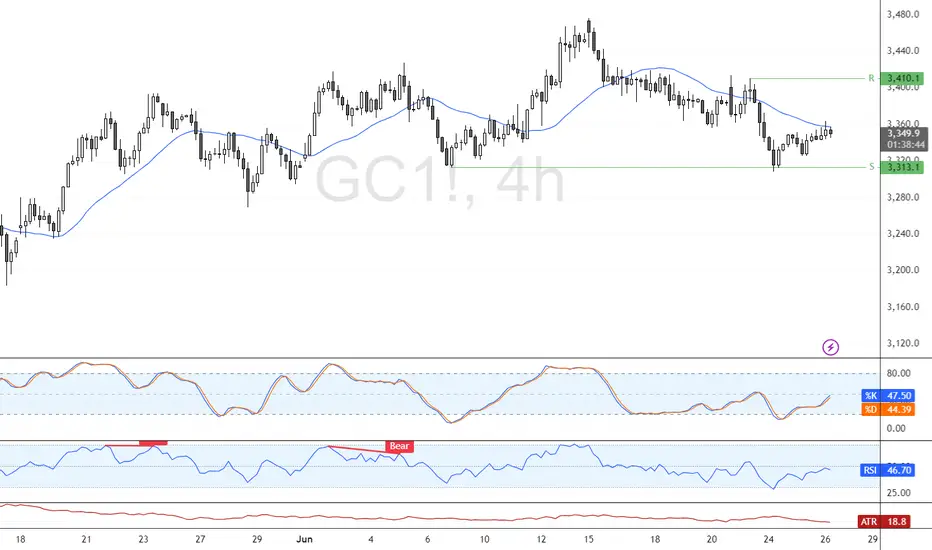
Gold Eyes Recovery From $3,269 Support ZoneGold dropped 0.65% to trade around $3,290.0, resuming its bearish bias. Immediate support rests at $3,269.1, backed by anchored VWAP. The bullish view holds above this level, aiming for $3,348.9.
A close below $3,259.1 would expose the $3,150.8 support.

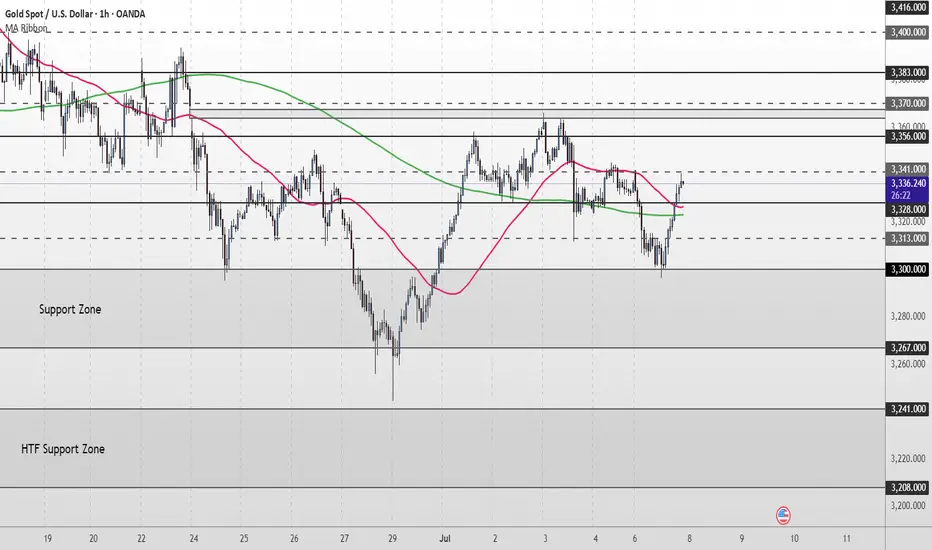
Gold Short Term OutlookYesterday, price failed to break above the minor resistance at $3,341, which led to a sharp sell-off into the Support Zone. The 50MA has now crossed below the 200MA, reinforcing the short-term bearish momentum.
If the Support Zone fails to hold, we could see a move toward the HTF Support Zone, with downside targets at $3,241 and $3,208.
Any short-term recovery may face resistance at $3,300–$3,328. For a more meaningful shift in sentiment, bulls must reclaim $3,328 to open the path back toward higher levels.
📌 Key Levels to Watch
Resistance:
$3,300 ‣ $3,313 ‣ $3,328 ‣ $3,341
Support: $3,267 ‣ $3,241 ‣ $3,208
🔎 Fundamental Focus
Markets are positioning ahead of Wednesday’s FOMC Meeting Minutes, which could give insights into the Fed’s internal sentiment on rate cuts.
⚠️ Stay sharp — manage your risk.

A Buying Opportunity or Sign of a Bigger Correction?Gold Breaks Below 3300 – A Buying Opportunity or Sign of a Bigger Correction?
🧭 Market Update: Is the Sell-off Truly Dangerous?
Gold saw a surprising reversal at the close of the US session yesterday after a sharp decline targeting the 329x liquidity zone, followed by a strong buying momentum that pushed the price back above this level.
After testing the liquidity zone below 3300, significant buying volumes emerged at this price point, pushing the price back up. However, the market is still undecided about whether the bulls or bears will dominate at this stage. We are currently in an accumulation phase, with liquidity sweeps occurring at both the highs and lows, meaning traders should exercise caution and look for scalping points for appropriate entry and exit.
Short-Term Outlook: Buy Bias Dominates Today
In the short term, the buy bias appears stronger compared to yesterday. Focus on buying early at continuation patterns to capture the market's movement. The D1 candle from yesterday formed a wick rejection, showing that selling pressure has been absorbed and the buying momentum has returned in the short term. Therefore, be proactive and look for early buy opportunities.
In the M30 timeframe, there is a solid continuation pattern forming in the 16-14 zone, which could serve as a good entry point today. If the price continues to drop, we’ll wait for a retest of the previous bottom at 03-00, and monitor for any strong downward momentum to confirm if the bearish trend will continue. On the other hand, if you’re considering sell positions, proceed with caution. As mentioned with the D1 wick rejection, the SELL pressure may have been absorbed, and BUY momentum could take over in the coming days. Avoid rushing into sell positions.
Key Support & Resistance Levels:
Key Resistance: 3342 – 3353 – 3362 – 3381
Key Support: 3330 – 3314 – 3303 – 3295
Scalping Opportunities and Buy Zones:
BUY SCALP:
3316 – 3314
Stop Loss: 3310
Take Profit: 3320 → 3325 → 3330 → 3335 → 3340 → 3350
BUY ZONE:
3303 – 3301
Stop Loss: 3297
Take Profit: 3306 → 3310 → 3315 → 3320 → 3330 → 3340 → ????
Sell Opportunities and Caution on Bears:
SELL SCALP:
3362 – 3364
Stop Loss: 3368
Take Profit: 3358 → 3354 → 3350 → 3345 → 3340 → 3330
SELL ZONE:
3380 – 3382
Stop Loss: 3386
Take Profit: 3376 → 3372 → 3368 → 3364 → 3360 → 3350
Key Takeaway:
We are at a critical stage where both bulls and bears are vying for control. Will gold bounce from the support and continue its bullish trend, or will the sellers regain control and drag prices lower? Be patient and wait for clear price action signals before entering any trades.
The market is currently in an accumulation phase, so avoid rushing into decisions. Focus on buying when clear confirmations appear at support zones and stay alert for sell rejections at key resistance levels.
Good luck with your trades!
💬 What’s Your View on Gold Today?
Do you believe gold is set to break 3390 and continue its bullish momentum?
Or are we looking at a deeper correction towards 3270 in the coming days?
👇 Share your analysis and thoughts in the comments below! We’d love to hear your take on where gold is headed next!

Gold Short Term OutlookGold dipped earlier in the session as the $3,328 support level failed, pushing price into the upper boundary of the broader Support Zone. From there, we’ve seen a strong bounce, with price now trending around the $3,341 minor resistance.
Price has reclaimed both the 50MA and 200MA, suggesting bullish momentum may be returning. A clean break and hold above $3,356 would likely open the path toward higher resistance levels, including $3,370 and $3,383.
However, failure to break and hold above $3,356 could lead to another pullback toward the Support Zone. If that zone fails to hold, we may see a deeper move into the higher timeframe (HTF) support area below $3,300.
📌 Key Levels to watch:
Resistance:
$3,356 ‣ $3,383 ‣ $3,400 ‣ $3,416
Support:
$3,328 ‣ $3,300 ‣ $3,267 ‣ $3,241 ‣ $3,208 (HTF Support)
Gold Faces Pressure After Rejection at $3,376 ResistanceFenzoFx—Gold dropped from the $3,376.0 resistance, a level reinforced by the anchored VWAP. June’s bounce at $3,250.0 marks a key support for the broader bullish trend.
If the $3,250.0 support holds, XAU/USD can potentially resume its uptrend. However, a close below $3,236.6 would invalidate the bullish scenario.

GOLD (XAUUSD) 4H Technical Analysis – Channel Breakout & Target🧠 Executive Summary:
The GOLD market has completed a key structural shift following a successful bearish trendline breakout, and is now trading within a well-formed ascending price channel. Price action has recently bounced from the channel support area, which aligns closely with a retested zone that was previously resistance. All signs now point to a potential continuation of the bullish leg—but only if the current structure holds.
This analysis outlines the technical foundation, key trading zones, price action psychology, and risk management factors that define this setup.
🔍 Technical Breakdown
🔸 1. Trendline Breakout – The Structural Shift
The bearish trendline, which previously capped multiple upside moves throughout June, has finally been broken.
The breakout was accompanied by higher volume and larger bullish candles, indicating momentum.
After the breakout, price pulled back near the trendline and respected the newly flipped support zone.
This forms a classic Breakout–Retest–Continuation pattern, one of the most reliable in trend reversal scenarios.
🔸 2. Formation of Ascending Channel – A New Bullish Structure
After the breakout, price action established a consistent pattern of higher highs and higher lows, confirming the birth of a new ascending channel.
The channel support (around 3,320–3,330) has been tested multiple times and held strong.
The channel resistance lies between 3,390–3,400, which is now the next short-term target if bulls maintain control.
The channel offers both trend direction and entry timing opportunities as price bounces between its boundaries.
🔸 3. Retest Zone – Buyer’s Territory
The price is currently bouncing off the mid-channel zone, where the previous downtrend resistance overlaps with current channel support.
This confluence area is where smart money often enters after institutional accumulation at the base (around 3,270).
The bullish wick rejections around this zone signal a likely continuation toward the upper channel.
📈 Price Behavior & Market Psychology
What’s happening here isn't just lines and candles—there’s a psychological story unfolding:
Fear drove the market lower, respecting the bearish trendline until late June.
Hope and buyer aggression surged once the breakout confirmed.
Now we’re in the "belief" phase, where traders await confirmation of the new trend.
Many are watching for entry confirmation at support zones, and as long as fear doesn’t return (i.e., price breaking below 3,320), the structure remains valid.
🧭 Key Technical Levels to Watch
Level Type Price Range Notes
Major Support Zone 3,270–3,285 Key buyer zone, invalidation of bullish case below this
Channel Support 3,320–3,330 Retest zone after breakout, current active level
Mid-Channel Area 3,350–3,360 Decision zone – price may build momentum here
Channel Resistance 3,390–3,400 First bullish target, potential breakout area
Breakout Target 3,420–3,440 If price breaks channel resistance with volume
🧮 Trade Setup Ideas (Educational – Not Financial Advice)
🟢 Long Setup Option 1:
Entry: Upon confirmation above 3,340–3,345 with bullish engulfing candle or breakout bar.
Stop-Loss: Below 3,320 or slightly below channel support.
Take Profit: Partial at 3,390 (channel top), full at 3,420–3,440 breakout zone.
R:R Ratio: 1:2.5+ (highly favorable)
🔴 Bearish Scenario (Risk Management)
If price closes below 3,320 with momentum, expect a revisit to the 3,270–3,285 support.
This invalidates the current bullish channel structure and might bring in short-term bearish pressure.
Avoid long positions until new structure is formed.
🧠 Educational Takeaway for Traders
This analysis highlights the importance of:
Structure-based entries: Instead of chasing candles, you wait for confluence and entry triggers.
Multiple timeframe confirmation: Higher timeframes also show bullish bias, giving confidence to 4H trades.
Risk management: The current setup allows tight stop losses relative to potential reward, making it attractive.
By combining trendline breakouts, channel formations, and support/resistance flips, you significantly increase the probability of a successful trade.
📌 Final Thoughts:
Gold is giving traders a clean and structured opportunity. The market has shown strength through structure, not just random price spikes. With the ascending channel intact and price respecting support zones, there is a solid foundation for a bullish continuation toward 3,400 and beyond.
But as always, confirmation is key. Wait for price action to validate your bias, and never ignore risk management.

Gold Short Term OutlookYesterday, we saw gold reclaim the 200MA and push into the $3,352 resistance. Price remains supported above the $3,327 level, keeping the bullish structure intact for now.
As long as price holds above $3,327, bulls remain in control, and a breakout above $3,352 could open the path toward $3,364 and $3,383.
However, failure to hold above $3,327 may lead to another retest of $3,298, with deeper downside toward $3,270-$3,41 support zone if that level gives out.
📌 Key Levels to Watch:
Resistance:
$3,352 • $3,364 • $3,383 • $3,400
Support:
$3,327 • $3,298 • $3,270 • $3,241

GOLD Price Analysis: Key Insights for Next Week Trading DecisionIn this video, I break down last week’s gold price action and give you a detailed outlook for the week ahead. With gold closing around $3,260 and major macroeconomic shifts unfolding—including the Israel-Iran ceasefire talks, rising US dollar strength, and concerns over the US Q1 GDP contraction, we are at a turning point.
📉 Will weakening economic data force the Fed to pivot?
📈 Could this create a fresh bullish wave for gold?
Or will stronger job numbers and inflation data drag gold lower?
✅ What you’ll learn in this video:
✅Key fundamental drivers affecting gold (XAU/USD)
✅Important economic events to watch (Fed Chair speech, NFP, ISM)
✅My technical analysis of gold price levels to watch
✅How to read the current market sentiment like a pro
✅Strategic trading zones for bulls and bears
🔔 Don’t forget to like the video in support of this work.
Disclaimer:
Based on experience and what I see on the charts, this is my take. It’s not financial advice—always do your research and consult a licensed advisor before trading.
#xauusd, #goldprice, #goldanalysis, #goldforecast, #goldtrading, #xauusdanalysis, #technicalanalysis, #fundamentalanalysis, #forextrading, #forexmentor, #nfpweek, #goldoutlook, #tradingstrategy, #chartanalysis, #julyforecast, #fedwatch, #priceaction, #traderinsights, #commoditytrading, #marketbreakdown, #xauusdforecast, #tradethefundamentals, #smartmoneytrading

XAUUSD Analysis todayHello traders, this is a complete multiple timeframe analysis of this pair. We see could find significant trading opportunities as per analysis upon price action confirmation we may take this trade. Smash the like button if you find value in this analysis and drop a comment if you have any questions or let me know which pair to cover in my next analysis.

Gold Builds Bullish Momentum After $3,294.0 ReboundGold bounced from $3,294.0, forming a double bottom pattern as XAU/USD consolidates near $3,330.0. Stochastic has exited oversold territory, signaling strengthening bullish momentum.
If $3,294.0 holds as support, the uptrend may continue toward the $3,393.0 target.
XAUUSD and GBPJPY Analysis todayHello traders, this is a complete multiple timeframe analysis of this pair. We see could find significant trading opportunities as per analysis upon price action confirmation we may take this trade. Smash the like button if you find value in this analysis and drop a comment if you have any questions or let me know which pair to cover in my next analysis.

XAUUSD Analysis todayHello traders, this is a complete multiple timeframe analysis of this pair. We see could find significant trading opportunities as per analysis upon price action confirmation we may take this trade. Smash the like button if you find value in this analysis and drop a comment if you have any questions or let me know which pair to cover in my next analysis.

GOLD Price Forecast: Is the Pullback Over? | Weekly OutlookWill XAUUSD resume its bullish trend, or is more downside ahead?
In this video, I break down last week’s gold price movement and the current market reaction to rising geopolitical tensions between Iran and Israel, now with the U.S. joining the conflict. We also assess the impact of the Fed’s recent rate hold, weak retail sales, and upcoming high-impact U.S. economic events like PMI, GDP, and Core PCE.
💡 Here’s what you’ll learn:
✅What caused gold’s pullback last week
✅Why institutional traders shake out retail buyers
✅Key fundamentals driving gold right now
✅How to position yourself smartly for the upcoming trading week
🔔 Don’t forget to like the video in support of this work.
Disclaimer:
Based on experience and what I see on the charts, this is my take. It’s not financial advice—always do your research and consult a licensed advisor before trading.
#goldanalysis, #xauusd, #goldforecast, #goldpriceprediction, #forexanalysis, #fundamentalanalysis, #forextrading, #tradinggold, #goldnews, #federalreserve, #marketpsychology, #tradingstrategy, #geopoliticalrisk, #usdata, #iranisraeltensions, #goldbullish, #goldbearish, #forexmentor, #xauusdforecast, #tradingview

XAUUSD Analysis todayHello traders, this is a complete multiple timeframe analysis of this pair. We see could find significant trading opportunities as per analysis upon price action confirmation we may take this trade. Smash the like button if you find value in this analysis and drop a comment if you have any questions or let me know which pair to cover in my next analysis.

XAUUSD Analysis todayHello traders, this is a complete multiple timeframe analysis of this pair. We see could find significant trading opportunities as per analysis upon price action confirmation we may take this trade. Smash the like button if you find value in this analysis and drop a comment if you have any questions or let me know which pair to cover in my next analysis.

XAUUSD Drop to daily support?XAUUSD After testing the daily resistance market has managed to reject with a momentum to daily 20ema early today. As we can see series of lower low and lower highs, price may continue to drop to daily 20ema again as, from weekly perspective we can see that price is pushing down to potentially to weekly key level of resistance.

XAUUSD Analysis todayHello traders, this is a complete multiple timeframe analysis of this pair. We see could find significant trading opportunities as per analysis upon price action confirmation we may take this trade. Smash the like button if you find value in this analysis and drop a comment if you have any questions or let me know which pair to cover in my next analysis.

XAUUSD Bouncing back to 3450?3380.27, 3383.94 and 3386.08 three daily consecutively candlestick patter with continuted series of higher low formed the daily support. Previous daily candle just closed at support with an ATR of 1.1ATR, which is quite large in the opposite direction of the major trend while the price is trading above 10ema in the daily.
In 4h there is also 3 ATR ( overall) bearish move is spotted giving a high probability for this market to bounce back to the daily resistance to the major direction of the trend.
We have a buy position at this level and will keep you posted for more updates!

Gold Technical & Fundamental Outlook for Next WeekIn this video, I break down the recent surge in gold prices, what drove the momentum, including rising tensions between Israel and Iran, and the impact of weaker U.S. inflation data that’s pushing Fed rate cut expectations.
Gold is now sitting just below the all-time high of around $3,500. With major U.S. economic events like Retail Sales and the Federal Reserve Interest Rate Decision coming up, this is a key moment for us to prepare.
💥 Will we see a breakout above resistance, or is a healthy dip on the cards before the next move? I’ll walk you through the key levels, the market psychology, and how I’m planning my trades this week.
💡 Make sure to like, comment, and subscribe for more weekly gold and forex market insights.
Disclaimer:
Based on experience and what I see on the charts, this is my take. It’s not financial advice—always do your research and consult a licensed advisor before trading.
#GoldAnalysis #XAUUSD #GoldPrice #ForexTrading #MarketOutlook #GoldForecast
#TechnicalAnalysis #FundamentalAnalysis #FOMC #FedRateDecision
#RetailSales #SafeHaven #GoldBreakout #TradingStrategy #ForexMentor

Gold's Wild Ride: Must-Know Price Predictions for Next Week!I can write a lot of smart words but lets make it short, like and sub from you for that)
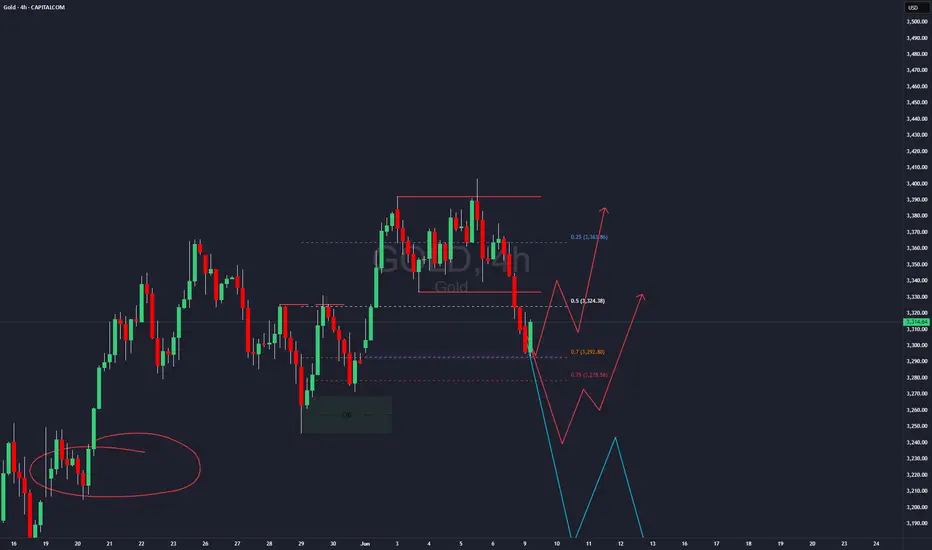
3 options that i can see:
1- dump to Gap at 3292 then bounce target PWH or higher
2 - move a bit lower till PWL and then all the way up till PWH or ATH
3 - cancel all longs, move down below , break 3250 lvl with fvg and second shift on 4h time frame and then gold will keep going lower all the way down to 3k (Low-probability)
XAUUSD Analysis todayHello traders, this is a complete multiple timeframe analysis of this pair. We see could find significant trading opportunities as per analysis upon price action confirmation we may take this trade. Smash the like button if you find value in this analysis and drop a comment if you have any questions or let me know which pair to cover in my next analysis.
