GOLD DAILY 09/07/2018Gold moves in the pivot area for today after yesterday having broken R2 but still back down. wich is the price breaks down the pivot down there is a chance to continue the pattern, but if the price breaks the previous high then the chance to continue move up.
Prices now have formed a bearish candlestick.
Daily Pivot:
R4 1235.23
R3 1223.78
R2 1212.33
R1 1206.26
Pivot 1200.88
S1 1194.81
S2 1189.43
S3 1177.98
S4 1166.53
Option:
-Open short positions
-TP1 at the first daily support (S1)
-TP2 at the second daily support (S2)
-Economic data today will add to volatility, there is a chance that prices will pass through the second daily support.
-SL can be placed on the previous swing high pivot
-Wait for confirmation to open a position
Goldfutures

GOLD DAILY 10/09/2018Gold consolidates to form a triangle pattern, looks like there is a bullish exaggerated divergence even though the pattern forms a descending triangle, if you look at the chance for weekly movement then the chance for daily if the price moves bullish then the chance it move to the first daily resistance area.
and if bearish then the chance it will move to the second daily support.
Daily Pivot:
R4 1228.61
R3 1218.31
R2 1208.01
R1 1202.23
Pivot 1197.71
S1 1191.93
S2 1187.41
S3 1177.11
S4 1166.81
First option:
-Open long positions when the price breaks up the triangle
-TP1 is a few points above the pivot
-TP2 at the first daily resistance (R1)
-SL can be placed in the first daily support or previous swing low
-Wait for confirmation to open a position
Second option:
-Open short positions if the price breaks down the triangle
-TP at the second daily support
-SL on the previous pivot or swing high
-Wait for confirmation to open a position

GOLD DAILY 09/05/2018Yesterday Gold moved down and closed below the daily pivot for today. Price is already in the first weekly support area ($ 1192.70 / oz) and is at the channel support line that is formed. Looking at the daily price movements in the past week there is a chance the price moves to form XABCD or maybe three drives pattern. Chances are the price will move back up to the weekly pivot area ($ 1203 / oz).
Option:
-Open long positions if the price does not break the channel or break the first daily support
-TP1 on daily pivots
-TP2 at the first daily resistance
-SL can be placed in the first daily support or previous swing low
-Wait for confirmation to open a position

GOLD THIS WEEK 09/03/2018Gold closed bearishly in trading last week by closing below the weekly pivot for this week. The price did not break the first resistance and still results in a hidden divergence between price and RSI.
If the price does not succeed to move above this week's pivot then most likely the price will continue to move down
Option:
-Open short positions if the price does not succeed above the pivot and pass the previous high
-TP1 at second weekly support ($ 1185 / oz)
-TP2 at third weekly support ($ 1166 / oz)
-SL at the first weekly resistance ($ 1211 / oz) or a few points above the previous high.
-Wait for confirmation to open a position

GOLD DAILY 08/30/2018The price of gold has closed above the daily pivot and is still moving in the channel formed, the range per price movement seems narrowed.
First option:
-Open a Sell position if the price moves below the pivot
-TP 1 at first and second daily support
-TP 2 to daily support if there is price confirmation out of the channel
-SL in the pivot or in the last swing high.
-Wait for confirmation to open a position
Second Option:
-Open a buy position if the price is unable to break the daily support or exit the channel
-TP 1 is among the first daily pivots and resistance
-TP 2 daily resistance, if the price succeeds in living on a pivot
-SL can be placed on either daily support or at the last swing low
-Wait for confirmation to open a position

GOLD DAILY 08/29/2018Prices have moved below the daily pivot but are still stuck and there is still a chance to continue the channel formed.
First Option:
-Open a Buy position if the price moves up again above the pivot.
-TP 1 at the first daily resistance
-TP 2 at the second daily resistance
-SL can be placed below the pivot or at the last low ($ 1199 / oz)
-Wait for confirmation to open a position
Second Option:
-Open a Sell position if the price breaks low and exits the channel ($ 1195 / oz)
-TP is the second daily support
-SL can be placed above the first daily support or some points in it
-Wait for confirmation to open a position

Washout Scalp In December Gold FuturesAt press time, December gold futures are up moderately for the session trading above the 1210.0 handle. Make no mistake, this is a critical technical level. If we see another late day sell-off in bullion, a bearish washout may develop beneath Tuesday’s low (1205.8).
Here is the trade:
1)Entry: Sell 1205.7
2)Stop Loss: 1207.1
3)Profit Target: 1204.7
4) Risk vs Reward: Sub-1/1
The goal is quick and positive price action. If there are buyers home above the 1205.0 handle, then head for the door. This trade is good for the remainder of the Wednesday session.

GOLD DAILY OPPORTUNITIES 08/27/2018Gold closed with a bearish candle which is almost below the previous low candle ($ 1204.90), after a sharp rise on Friday (24/08), and the RSI indicator is still in the overbought area so that the correction pressure remains. Price movements are still above the daily pivot ($ 1199.08 / oz). The first option if there is a continuation of correction but the price is unable to break beyond the daily pivot then there is a chance to open a long position with the target profit at the first daily resistance at $ 1215 / oz with a stop loss can be placed at some points below the pivot. The second option if the price moves strongly through the daily pivot then there is an opportunity to open short positions with the target profit at the first daily support at $ 1189.66 / oz and the stop loss can be placed a few points above the pivot. Looking at the price at consolidation, wait for the price to move out to open a position. Additional options if the price breaks up and when the price corrects and sets a new higher high either in the first resistance area or even exceeds the second resistance then almost certainly there will be divergence between price movements and RSI indicators which means there are additional opportunities to open short positions with the profit target is on the nearest swing low and the stop loss can be placed on the previous swing high or a few points above it. Always wait for the confirmation candle to open a position and always calculate the best Risk and Reward ratio according to the position taken, always determining where stop loss and profit targets are clear before entering the market. Know clearly the chances of loss and the best profit opportunities.

Gold hit 1.38 Fib time extension Gold is hitting an important Fib time level - 1.38 extension on weekly and it already hit 2.618 daily fib time extension. Both coincide as you see. Usually, there is a change of trend when price hits 38 Fibonacci time extension. On monthly price hit the support, the cloud bottom (Senkou span B). It hit lower Bollinger band (100) and 38 retracement, Gann angles on weekly and formed a sort of a morning star on daily (price might retrace into the body of morning star ). Ehler´s center of gravity oscillator points to a trend change as well and to the start of new cycle and big move (its getting squeezed) what agrees with Fib time extensions. I expect price to reach 23 Fibonacci retracement (BB band´s middle band, 200 EMA are there too), around which it gravitated as you see. Monthly Ichimoku (doubled settings) has very thick bullish future cloud.

Bullish B-886 on GOLD Long is coming.
Opening a position :
STOP : $1221
TP1 : $1332 (50%)
TP2 : 1382 (100%)
R/W : 4.3

GOLD ascending triangle, aggressive long entryGold has been forming a ascending triangle since beginning of 2016.
It is currently sitting on support of that triangle.
Note that this is a aggressive entry as it is possible support will not hold.
A safer entry would be when it breaks out upwards from the triangle.
I will be opening a long trade here with multiple take profits along the way.
Last take profit at upper resistance line on the chart.
Stop will be placed under the last arrow.
Disclaimer:
This is me experimenting with trading and sharing my charts.
I am not a proven profitable trader so take that into account.
If you have questions or advice please let me know.

BTC Precious Metals Futures Market Correlation Part 3/3 So time to explain. This is all started when I read the article about the Third Dimensional Crypto Cartel
manipulating price through futures. After some thought I decided the chart it out.
Although I am not convinced of the futures market oppression, the similarities to BTC from all time high are astounding.
1st chart is current BTC 2nd and 3rd and Gold Futures. This same pattern also appears in Silver and Uranium Futures. I decided to only compare to Gold Futures for the purpose of this example but feel free to chart out those as well. The crazy thing about this pattern is that it took place in 2012-2013 while BTC has been performing the same pattern 2017-2018 so we can rule out World Events or the Global Market hammering in these similar patterns.
Main similarities:
1: Starts a descending triangle from ATH
2: Forms a double bottom breakout
3: Bulltraps on the triangle breakout
Main difference:
The pattern in question on the Gold Futures chart is on a weekly candle while BTC's pattern is on a daily candle.
If I try to chart out this pattern on BTC's weekly chart it is not as visible. I believe this is because of the total amount of price action BTC has lived compared to Gold Futures. Since the Gold market has had a longer lifespan it gives a cleaner look at the weekly chart. In other words in time to come I expect the weekly BTC chart to look more similar to the Gold Futures weekly chart.
What do I expect?
Well, for the last few weeks I have been expecting a leg down on BTC mostly on the RSI following suit and confirming the rejection of the Triangle Breakout Bulltrap. It appears to now be confirmed. Although Gold Futures currently appear to be in a Bullish Breakout Pattern, I do not expect BTC to follow suit immediately.
Everybody thinks that BTC is either going to 500k or 0. I think neither, I think BTC will continue to follow the Gold Futures chart and run relatively flat with low volatility for the coming months. I have been trading BTC will the Gold chart as a reference for the last few weeks and have been doing very well. I will continue to do so until BTC starts to stray away from this Price Action example.

GC1! : Horizontal motion channel and possible movementsHorizontal movement (1045 - 1377) on the monthly chart and possible movements
***This information is not a recommendation to buy or sell. It is to be used for educational purposes only.***
PS make sure you give me a like, If you LIKE this analysis .... If you like most of my analyzes, FOLLOW me .

GoldIf we close under 1340 today we go under 1300 for me.
So watch out what happend next week ist very intresting. Look at your own plan and good luck.

Gold is in Strong Bullish trendGold has been sustaining between 1360 and 1335 since last 6-7 trading sessions. Profit booking has been done for short term in gold and it may again rally this week for the TGT of 1365-1370. I will accumalate gold near 1330-1335 levels for the TGT of 1355-1365-1370 with The stoploss of 1319.

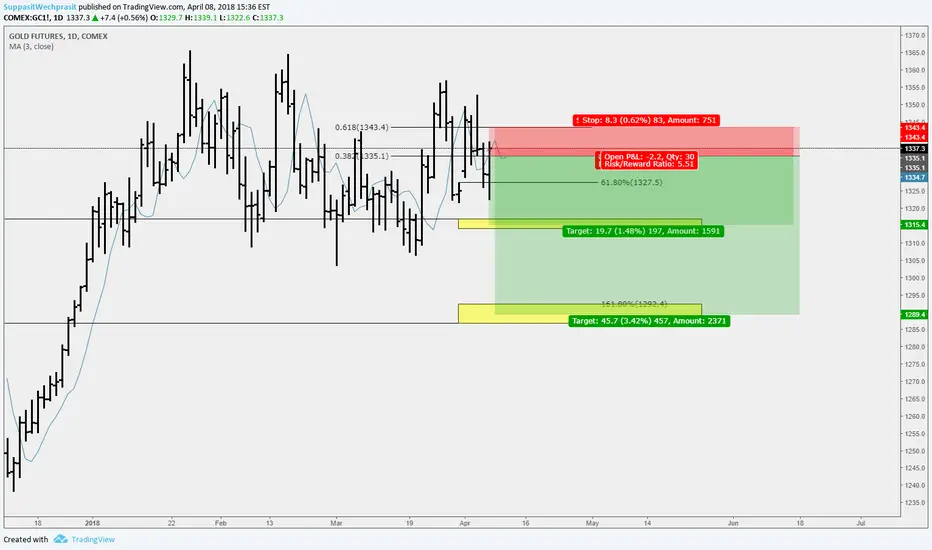
Gold Future JUN18 (COMEX)Trading Signal
Short Position (EP) : 1335.1
Stop Loss (SL) : 1343.4
Take Profit (TP) : 1315.4, 1289.4
Description
GC1! formed Double Double Repo Sell at 1d time frame. Trade setup with Sell limit at 0.382 Level of FR (1335.1) and place stop after 0.618 Level of FR (1343.4). Once the position was hit, place take profit before an agreement (1315.4) and 1289.4
Money Management
Money in portfolio : $73,000
Risk Management (0.5%) : $365
Position Sizing
$0.1 = +-$10 (Standard)
Commission fee = -$2.37/contract (Standard)
EP to SL = $8.3 = -$830/contract (STD)
Contract size to open = 2 standard contracts
EP to TP#1 = $19.7 = +$1,970 (STD)
EP to TP#2 = $45.70 = +$4,570 (STD)
Expected Result
Commission Fee = -$9.48
Loss = -$1,660
Gain#1 = +$1,970
Gain#2 = +$4,570
Total Gain = +$6,540
Risk/Reward Ratio = 3.92

Gold Future APR18 (COMEX)Trading Signal
Long Position (EP) : 1330
Stop Loss (SL) : 1327
Take Profit (TP) : 1339, 1347
Description
GC1! future formed Double Repo Buy at 4h time frame. Buy Limit position at 1330.0 When the position has entered, place first take profit with 2/3 contract before an agreement 1339 and place stop loss at 1327. When the first target reach, shift stop loss to break even (1330) and wait until the rest contract or second profit will be reached (1347)
Money Management
Money in portfolio : $48,000
Risk Management (2%) : $960
Position Sizing
1 Tick value = +-$100
Commission fee = -$30/contract
EP to SL = 3 Tick value = -$300/contract
Contract size to open = 3 contracts
EP to TP = 9 tick value = +$900, 17 tick value = +$1,700
Expected Result
Loss = -$990
Gain = +$3,410
Risk/Reward Ratio = 3.44


Gold - AB=CD ------ TRADING PARAMETER INCLUDEDPrice is likely to hit the PRZ and go up to 1336 area ( 1336 area would also be the 61.8 level retracement from the top). Furthermore if price does stop at the 618 level (1336 area) then we will see it drop to about 1264 and thus complete a Harmonic pattern. Let us not however make a mistake on an assumption, DO NOT sell off at 1336 until we reach this area and evaluate what price action is ready to do. For now follow the following parameters.
BUY LIMIT - 1296.30
SL - 1282 (~1400 PIPS)
TP 1337 (~4100 PIPS)


Gold Future (CME)Double Re-penetration Pattern. Trade setup with Buy Stop position (EP) at 1337.5, Stop Loss (SL) at 1333 and Take Profit (TP) at 1342.
Money Management
I have 22,800 USD in my portfolio. I can lose 5% of the port which is 1,140 USD.
Position Sizing
1 Tick = $100
1 Contract size need IM = $3,850 (I can open not more than $22,800 / $3,850 = 5.92 Cons)
It is 4.5 Tick from EP to SL, with 1 Con, I will lose 4.5 * $100 = $450
To lose 1,140 USD I need to open 1,140 / 450 = 2.53 Con
Then I will put 2 Contract
If I win, I will gain (1342 - 1337.5) * $100 * 2 Con = $900
