Gold Downtrend Gold bearish and near term resistance 1720
and support 1700
RSI momentum strong bearish
Goldfutures

Gold Opportunity 21-EMA Price ActionMarkets eye US CB Consumer confidence and JOLTS job opening for further direction.
Gold price showed a minor pullback on US dollar weakness.
Technical:
The near–term support is around $1720, resistance around $1760,

Gold: Dolphin 🐬Like a playful dolphin, gold has jumped above the resistance at $1770, only to dive right back into the blue zone between $1751 and $1709. Now it has to decide whether it wants to do some more tricks in the water or has already completed wave (ii) in blue. As soon as it has finished the counter movement, though, gold should climb out of the blue zone and above the resistance at $1770, thus confirming the upwards movement. However, there is a 38% chance that gold could leave the blue zone on the lower side and drop below the support at $1709. In that case, it should continue the descent below the next mark at $1678 and into the green zone between $1661 and $1585 first, before rising again.

Gold Futures - potential setupsCOMEX:GC1!
Hello everyone!
🛎 Let check the trading idea for Gold Futures
🤗 Not making anything difficult everything is pretty straightforward.
👉 1. Price goes ABOVE the selected range on the picture. Long positions to activate. 🟢
👉 2. Price goes BELOW the selected range. below. Short positions to activate. 🔴
----------------------------------------------------------------------------------------------------------------------------
⚠️ Important Notes:
1. Always follow your trading plan regarding entry, risk management, and trade management. ❗️❗️❗️
2. Timeframes: up to H4
----------------------------------------------------------------------------------------------------------------------------
😉 If you like the idea there was a like 🚀 and sign up so you can continue receiving great ideas like this one and also for us to make pattern the idea! 🤝
💪 Profitable lock for everyone! 🙏

Gold Futures at critical resistance.Gold futures is at INR 52352. Critical resistance for Gold is at INR 52585. Crossing INR 52585 looks little difficult and Gold will have to struggle a bit. Once the level of INR 52585 is crossed and the futures close above it the target for Gold will be INR 53637. Above INR 53637 the trench between INR 55005 to INR 55806 will be the one of the most difficult trench of a resistance to cross. The most important support for Gold is at the trench between INR 51255 and 50180. Long term target for Gold can be at INR 59438 time frame 12 to 16 months.

Gold analysis: Is the tide rising now? Gold has risen 5.5% from its July 21 low of $1,680 per troy ounce, as market sentiment suddenly shifted to safe-haven assets in the aftermath of a slew of recession-risk events and rising geopolitical tensions between the United States and China over Taiwan.
According to the latest Commodity Futures Trading Commission (CFTC) weekly Commitments of Traders (COT) report, gold net speculative positions increased by 34% to 124.3K contracts on the week ending August 2, up from 92.7K the previous week.
This marks the largest weekly increase in gold net speculative positions this year. Speculators' positioning on gold has consistently declined from a peak of 274.4K in the first week of March to 92.7K at the end of July, the lowest level since May 2019.
Despite this uptick, gold's positioning still remains quite weak, implying that a shift in sentiment toward gold could result in significant upside price pressures.
Looking at technical indicators, the 14-day RSI recently broke above the 50 mark, also rising from severely oversold levels, indicating that bulls have gained the upper hand in the short-term momentum.
Last Friday, however, the release of the US labour market report weakened gold's price momentum slightly, as both non-farm payroll (528,000 vs. 250,000) and hourly wages (5.2% yoy vs. 4.9% yoy) soared far above expectations, causing a repricing of Federal Reserve rate expectation to the upside. However, unlike past Fed rate repricing episodes in May and July, this one did not result in a massive gold's sell-off.
Consequently, this could be an early sign that the negative relationship between gold and the Fed's expected interest rates is beginning to dwindle. If this narrative gained further traction, gold would resume its traditional function as a hedge against inflation.
Another print above expectations (8.7 percent year-over-year) would certainly prompt Fed rate responses, but also raise further doubts that this inflation can be tamed through rate hikes, potentially weighing on the dollar and favouring gold.

GOLD Pauses at 110-EMAGold gains after dovish Fed, good to buy on dips
Gold price gained more than $15 after Fed monetary policy.
Technical:
The near–term support is around $1720
resistance around $1740,

GOLD-breach of 1695 is worst Y wave completed at 1695 as 1.62*w
any drop below 1695 leads to extension of Y wave ,which in turn GOLD supporters loose more money.
my view is wait for confirmation (breach of 1662) before shorting

Gold: Action! 🎬The plot is thickening! Gold has taken action and has jumped down into the lower green zone between $1737 and $1708. There, it should finish wave 3 in green before hopping into the upper green zone between $1761 and $1796 to complete wave 4 in green. Then, gold should resume the overarching descent until it has reached the orange zone between $1664 and $1529, where wave (4) in yellow should end and turn into new upwards movement.

Solid set up for a U-turn on GoldGold is currently sitting @ support levels on two different trend lines on the daily chart, as well as a down fib extension with a high % of trend reversal to the upside. If it bounces here I'll be looking for an entry on the re-test and confirmation.

gold futures may test $1700On going triple zigzag correction in Gold futures unfolds its third leg of down
minimum requirement of wave 'z' is 62% of (w+y) which comes @ 1700.
Weekly Price action support is not seen at 1770 which is 38.2% of (w+y)
logic; money is tight ,interest is high, Gold will not find any new buyers at this level as all the metal stocks are gliding to earth

GOLD FUTURES (GC1!), H1 Potential for Bearish DropType : Bearish Momentum
Resistance : 1834.7
Pivot: 1816.5
Support : 1785.8
Preferred Case: On the H4, with price moving below the ichimoku cloud and within a descending channel, we have a bearish bias that price will drop from the pivot at 1816.5 in line with the overlap support to the intermediate support at 1806.2 in line with the 100% fibonacci projection, 127.2% fibonacci extension and horizontal swing low support. Once we have downside confirmation, we would expect bearish momentum to carry prices to 1st support at 1785.8 where the swing low support, 100% fibonacci projection and -27.2% fibonacci expansion are.
Alternative scenario: Alternatively, price may rise above pivot structure and head to the 1st resistance at 1834.7 where the swing high resistance, 78.6% fibonacci retracement and 78.6% fibonacci projection are.
Fundamentals: With no major news events for Gold and expected further strength in the DXY, we have a medium bearish view on gold.

GOLD FUTURES (GOLD1!), H1 Potential for Bullish ContinuationType : Bullish Rise
Resistance : 51792
Pivot: 51152
Support : 50529
Preferred Case: On the H1, price is moving above the ichimoku cloud and has broken out from descending trendline which supports our bullish bias that price will rise to the pivot at 51152 where the swing high resistance, 78.6% fibonacci projection and 61.8% fibonacci retracement are. Once we have upside confirmation, we would expect bullish momentum to carry price to 1st resistance at 51792 in line with swing high resistance and -61.8% fibonacci expansion.
Alternative scenario: Alternatively, price may break pivot structure and drop to the 1st support at 50529 in line with the swing low support, 61.8% fibonacci retracement and 100% fibonacci projection .
Fundamentals: With greater concerns about an impending US recession, following Chair Powell’s comments, gold price is likely to trade higher, giving us a weak bullish bias.

GOLD FUTURES (GOLD1!), H1 Potential for Bearish DropType : Bearish Momentum
Resistance : 51158
Pivot: 50742
Support : 50157
Preferred Case: On the H1, price is moving below the ichimoku cloud which supports our bearish bias that price will drop from our pivot at 50742 in line with the swing high resistance and 38.2% fibonacci retracement to the 1st support at 50157 in line with the swing low support.
Alternative scenario: Alternatively, price may break through pivot structure and rise to the 1st resistance level at 51158 in line with the overlap resistance, 61.8% fibonacci retracement and 78.6% fibonacci projection .
Fundamentals: As the Fed has a 75-basis-point rate hike on the interest rate, we are bullish on Gold.

Gold: Heave ho!Gold had finally hauled itself up a bit higher into the orange zone between $1868 and $1919 only to drop back out. However, we expect it to gather all its strength to make it into the orange zone again and subsequently towards the resistance line at $1921, where it should finish wave b in orange. Then, gold should fall below the support at $1830 and continue the descent into the turquoise zone between $1660 and $1525, where it should complete wave C in turquoise and with it the overarching downwards movement. There is a 40% chance that gold could be strong enough to rise even higher into the red zone between $1919 and $2003 before turning downwards and heading for the turquoise zone.

Gold Futures (GOLD1!), H1 Potential for Bullish momentumType : Bullish Momentum
Resistance : 51788
Pivot: 51240
Support : 51035
Preferred Case: On the H1, price has broken through the descending channel and is moving along the ascending trendline. Also, price is moving above the ichimoku indicator which supports our bullish bias that price will rise from our pivot at 51240 in line with the overlap resistance, 38.2% fibonacci retracement and 61.8% fibonacci projection to the 1st resistance at 51788 in line with swing high resistance and 100% fibonacci projection.
Alternative scenario: Alternatively, price may break through pivot structure and drop to the 1st support at 51035 where the overlap support and 78.6% fibonnaci projection.
Fundamentals: The inflation hedge benefitted from the highest inflation seen in the US in 40 years. The rate of increase in the fed funds rate would be key to further gains in the precious metal. A hike lower than 75bps would allow gold to build on recent gains. This gives us a mixed to weak bullish view on gold.

GOLD Futures Positional Long Idea#GOLD Futures Postional Long Idea
Disclaimer: These levels are purely based on Price action/demand and supply zones & and consumed only for educational purpose & should not be taken as buy/sell recommendation. I will not be responsible for any loss/profit incurred if anyone takes trades based on my views.
Please consult your Financial Advisor before making any trading decision.
Leave a comment that is helpful or encouraging. Let's master the markets together.

Gold Futures (GOLD1!), H1 Potential for Bearish momentumType : Bearish Momentum
Resistance : 51144
Pivot: 51040
Support : 50683
Preferred Case: On the H1, price is moving within the descending channel, MACD is showing bearish momentum and price is moving below the ichimoku cloud which supports our bearish bias that price will drop from our pivot at 51040 in line with the overlap resistance to the 1st support at 50683 where the swing low support, 100% fibonnaci projection and 61.8% fibonacci projection.
Alternative scenario: Alternatively, price may break through pivot structure and rise to the 1st resistance level at 51144 in line with the overlap resistance and 61.8% fibonacci retracement.
Fundamentals: The outcome of the US CPI would confirm if inflation remains on a rising trend or if it is topping out which gives us a mixed bias on gold.

Gold Futures (GOLD1!), H1 Potential for Bullish bounceType : Bullish Rise
Resistance : 51144
Pivot: 50723
Support : 50416
Preferred Case: On the H1, stochastic indicator is bouncing off resistance level which supports our bullish bias that price will rise from the pivot at 50723 where the swing low support and 78.6% fibonacci retracement are to the 1st resistance at 51144 in line with the pullback resistance and 61.8% fibonacci retracement.
Alternative scenario: Alternatively, price may break pivot structure and drop to the 1st support at 50416 in line with the overlap support and 50% fibonacci retracement .
Fundamentals: Due to increasing inflation rates in the US,UK and other developed economies, we have a bullish view on the precious metal.

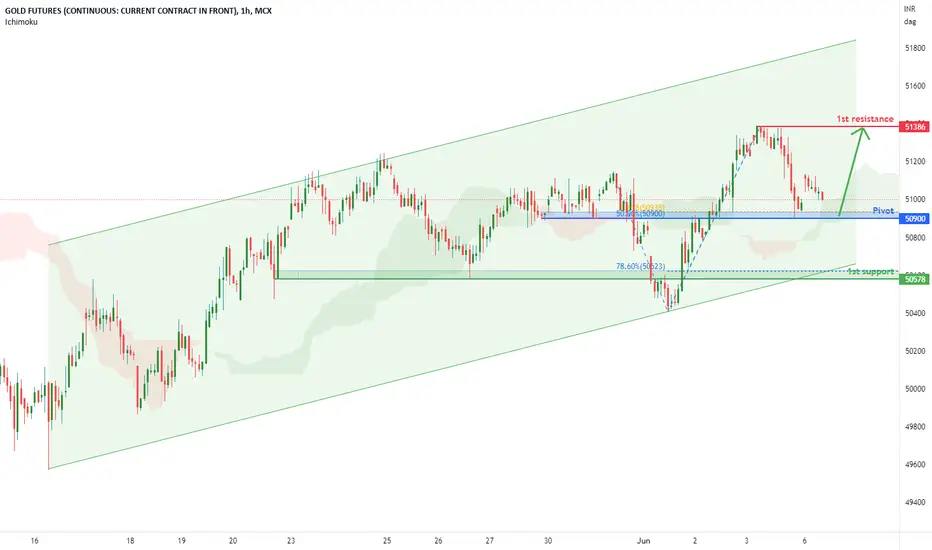
Gold Futures (GOLD1!), H1 Potential for Bullish ContinuationType : Bullish Rise
Resistance : 51386
Pivot: 50900
Support : 50578
Preferred Case: On the H1, price is moving above the ichimoku cloud which supports our bullish bias that price will rise from the pivot at 50900 where the overlap support, 50% fibonacci retracement and 61.8% fibonacci projection are to the 1st resistance at 51386 in line with the swing high resistance.
Alternative scenario: Alternatively, price may break pivot structure and drop to the 1st support at 50578 in line with the overlap support and 78.6% fibonacci retracement.
Fundamentals: Due to increasing inflation rates in the US,UK and other developed economies, we have a bullish view on the precious metal.
Gold Futures (GOLD1!), H1 Potential for Bullish ContinuationType : Bullish Rise
Resistance : 51545
Pivot: 51303
Support : 51141
Preferred Case: Price is moving within the ascending trend channel and is moving above the ichimoku cloud which supports our bullish bias that price will rise from the pivot at 51303 where the pullback support is to the 1st resistance at 51545 in line with the swing high resistance, 78.6% fibonacci projection and 161.8% fibonacci extension.
Alternative scenario: Alternatively, price may break pivot structure and drop to the 1st support at 51141 in line with the overlap support.
Fundamentals: Due to increasing inflation rates in the US,UK and other developed economies, we have a bullish view on the precious metal.

Gold Futures (GOLD1!), H1 Potential for Bearish ContinuationType : Bearish Momentum
Resistance : 50877
Pivot: 50577
Support : 50290
Preferred Case: On the H4, price is moving below the ichimoku cloud and breaking from the ascending channel which supports bearish bias that price will drop from our pivot at 50577 in line with the overlap resistance to the 1st support at 50290 in line with the pullback support, 161.8% fibonacci extension and 61.8% fibonacci retracement.
Alternative scenario: Alternatively, price may break through pivot structure and rise to the 1st resistance level at 50877 in line with the overlap resistance .
Fundamentals: Due to increasing inflation rates in the US,UK and other developed economies, we have a bullish view on the precious metal.

GC Gold WARNING: next 3 very impt supportsGold update from the previous post where I said gold may go to 1800 or even 1760.
As predicted, the bounce from 1800 was short-lived & GOLD is barely holding 1833, the 0.618 Fib level.
This time it falls, 1800 may not hold anymore. These are the 3 next impt supports:
1) 1760 is an impt pivot & also near the trendline from 2018. Breaking below the 1800 to 1760 zone may void the CUP & HANDLE move.
2) 1677 is the neck of the big M-pattern started since 2019 & is also the base of 2 bottom consolidation boxes in 2020 & 2021 which makes it a very strong support. This is a 20% drop from 2078 ATH.
3) 1450 is the MAX PAIN support at a 2006 TL. This may also be the Fib level where the big M-pattern finally completes. This is a 30% drop.
Watch the DXY dollar index very carefully as this scenario will play out only if DXY continues to go up. DXY seems to be bouncing from 100 to make new highs in line with the FED tightenning raising rates & the upcoming QE.
Not trading advice
