XAUUSD Analysis todayHello traders, this is a complete multiple timeframe analysis of this pair. We see could find significant trading opportunities as per analysis upon price action confirmation we may take this trade. Smash the like button if you find value in this analysis and drop a comment if you have any questions or let me know which pair to cover in my next analysis.
Goldidea

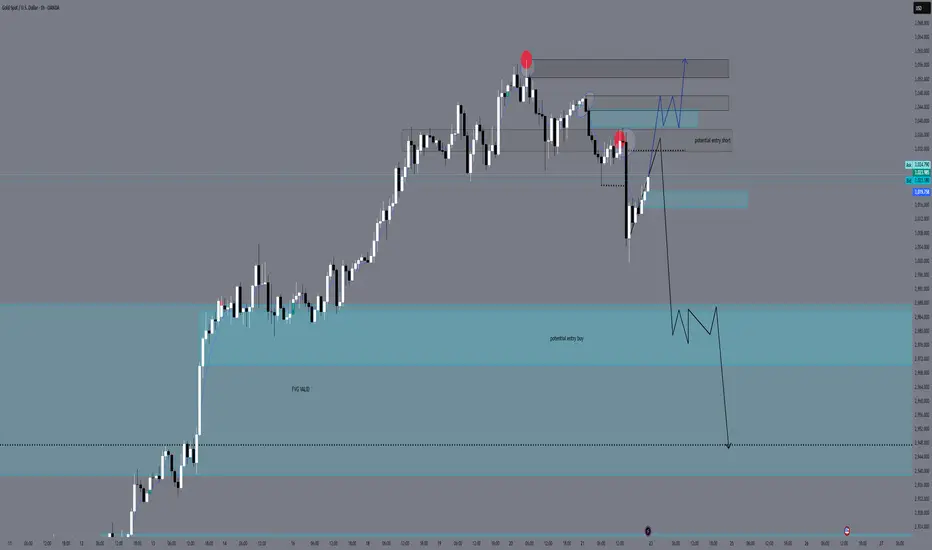
Weekly preview and trading idea for Monday 24.03.2025🔹 W1 – Weekly Bias
Bias: Bullish
SMC: Valid Break of Structure (BOS) to the upside, with consecutive higher highs.
Order Block: Last bullish OB (gray zone) still valid and respected.
Premium/Discount: Price is currently in the premium zone, indicating a higher probability of retracement.
FVG / Imbalance: Unfilled FVG zones remain between 2900 - 2800.
EMA 5/21/50/200: Price trades above all EMAs, confirming strong bullish momentum.
Key POI: 3060 – 3085 (potential reversal or reaction zone).
EQH: Potential Equal Highs forming, suggesting a liquidity grab is likely.
✅ Note: Weekly structure is intact, but we may expect a correction down into discount levels.
🔹 D1 – Daily Bias
Bias: Bullish (with active retracement)
SMC: BOS confirmed + liquidity grab above recent highs.
Price Action: Strong rejection from premium zone with a significant bearish candle.
Order Block: Valid OB between 2970 – 2990, aligning with Daily FVG.
EMA: EMA 5 and 21 are tightening up, signaling a potential short-term bearish cross.
Imbalance: Clear gap between 2985 – 2940 remains unfilled.
Daily POI: 2995 – 2970 → key zone to monitor for bullish reaction.
RSI: Not yet oversold, suggesting more room for downside movement.
🎯 Retracement Target (Daily): 2990 – 2950 for potential long setups.
🔹 H4 – Intraday Swing Setup
Bias: Bearish retracement
SMC: Confirmed BOS on H4
Order Block: Strong OB between 3025 – 3035 (origin of previous impulse drop)
FVG: Valid Fair Value Gap between 2988 – 2940
Imbalance: Still unfilled under 2970
EMA: Bearish EMA 5/21 crossover, EMA50 flattening
POI: 3030 (short setup zone), 2970 (potential buy reaction zone)
🔁 Scenario:
If price retests 3025–3030 and shows bearish PA → valid short.
If price drops into 2970–2950 and sweeps liquidity → potential long setup.
🔹 H1 – Entry Refinement
Bias: Temporary bullish correction
SMC: CHoCH printed, but no BOS yet
PA: Last reaction suggests mitigation
OB: OB zone at 3033–3037 still valid for shorting opportunities
EMA: EMA 5 and 21 remain bearish; 50 and 200 beginning to flatten
RSI: Nearing overbought – watch for signs of bearish reversal
POI (H1): 3033–3037 (short setup), 2985–2970 (buy zone)
🔹 M15 – Sniper Entry
Bias: Bullish correction in progress
SMC: CHoCH formed, waiting for confirmation of BOS
OB (M15): 3028 – 3033 → clean Order Block for possible bearish reaction
Imbalance: Unfilled gap at 3029 – 3032
EMA: EMA 5 > EMA 21 → minor bullish trend
RSI: Close to overbought – ideal for a reversal sniper short
EQH: Equal High at 3032 → ideal liquidity inducement
🎯 Sniper Trade Plan (Short):
Sell Entry Zone: 3029 – 3033
TP1: 3010
TP2: 2995
SL: Above 3035 (above OB high)
🔄 Alternative Scenario
If price breaks and closes above 3035 with bullish volume → short invalidated
Long setups only valid if price drops into discount zones (below 2985) with a bullish PA reaction + CHoCH confirmation
✅ Summary
Overall Bias: Bullish on higher timeframes, but currently in retracement → only looking for short-term sells
Sniper Short Zone: 3029 – 3033
Buy Zone to Re-enter: 2970 – 2940 (only on proper confirmations)
✨ If you enjoy my analysis, I’d really appreciate it if you followed my TradingView profile and left a boost\like on the post. Thank you!
Gold Price Analysis March 24Fundamental Analysis
Meanwhile, the US Dollar (USD) is struggling to capitalize on a three-day rally from multi-month lows amid expectations that a tariff-driven US economic slowdown could force the Federal Reserve (Fed) to resume its rate-cutting cycle soon. This, coupled with geopolitical risks, acted as a non-yielding driver for Gold and helped limit downside momentum. Hence, it would be prudent to wait for a strong follow-through before confirming that XAU/USD has topped out in the near term and positioning for any meaningful corrective slide.
Technical Analysis
Friday's D1 saw strong selling pressure with the sharpest drop from 3046 to 3000. Late in the day, bulls pushed the price back 50% of the D candle. This shows that bears have entered the market but the downtrend will take some time.
The h4 structure is quite nice to see the buy and sell wave structure.
Scenario 1: In the 3026 zone of the European session, selling pressure has appeared. If the price pushes up to break the 3026 zone at the end of the session, it will give a BUY signal, break 3026, target 3037. When the US session breaks 3037, keep the order until 3045. The 3045 zone gives a good SELL signal for today if the price finds it. When the price reaches 3037 and cannot break this zone when the US enters, it can SELL to 3026, further than 3018. Scenario 2: The price does not break 3026 but falls, then wait for support around 3013 and support 3003.

Gold price analysis March 21⭐️Fundamental Analysis
The Federal Reserve’s forecast of only two 25 basis point (bps) rate cuts by the end of the year helped the US Dollar (USD) gain positive momentum for the third consecutive day, which, in turn, is seen as undermining the commodity. The decline could also be due to some profit-taking heading into the weekend.
However, bets that the Federal Reserve (Fed) will continue its rate-cutting cycle will limit the USD’s gains and act as a non-yielding driver for Gold prices. Moreover, uncertainty over US President Donald Trump’s aggressive trade policies and their impact on the global economic outlook, coupled with geopolitical risks, deter traders from placing strong bearish bets on the safe-haven bullion.
⭐️Technical analysis
D1 candle has started to show a bearish candle after many consecutive days of increase. However, the buyers have pushed the price from the 3026 area, showing that a strong buying force is still in this area.
The European session, gold traded within the 3025 and 3038 range, the h4 structure shows this. Gold is pushing up to 3038, until the end of the European session, gold cannot break 3038, giving a SELL signal to 3025, the US breaks 3025, then it heads towards support 3008. In the opposite direction, Gold pushes back to 3025 first and does not break this area in the European session, giving a BUY signal to 3038 and heads towards ATH when the US breaks this area. Pay attention to the 2 areas of 3025 and 3038 to trade breakouts.

Gold Price Analysis March 20⭐️Fundamental analysis
Gold prices fell slightly after hitting a record high on Thursday, ending a three-day winning streak. Profit-taking pressure from buyers, along with positive risk sentiment in the market, weakened gold. At the same time, the modest increase in the USD also put downward pressure on gold prices in the European trading session.
However, expectations of an early Fed rate cut could limit the USD's rise, supporting gold prices. In addition, concerns about former President Donald Trump's trade policy and escalating tensions in the Middle East could continue to act as factors driving gold demand. This requires investors to be cautious before making trading decisions.
⭐️Technical analysis
The D1 candle has not yet shown any signs of a reversal in GOLD. Therefore, the trading strategy has not yet shown any signs of peak detection or peak catching. BUY is still easier to win.
Yesterday's US session buy zone 3038 in today's European trading session plays an important resistance zone. Currently, gold has confirmed a break of 3045 for a SELL signal and is heading towards 3038. Before 2 hours of the end of the European session, if gold does not break through this zone, it is still possible to BUY around 3038. 3031 and 3029 play the role of resistance zones for the day when breaking through 3038. Today, waiting for a retest to BUY is the safest

Gold - Expecting Retraces and Further Continuation LowerH1 - Bearish divergence on the moving averages of the MACD indicator.
Followed by bearish trend pattern in the form of three lower highs, lower lows structure
Strong bearish momentum
Potential drop after retraces if the strong resistance zone will not be broken.
If you enjoy this idea, don’t forget to LIKE 👍, FOLLOW ✅, SHARE 🙌, and COMMENT ✍! Drop your thoughts and charts below to keep the discussion going. Your support helps keep this content free and reach more people! 🚀
----------------------------------------------------------------------------------------------------------------------
Disclosure: I am part of Trade Nation's Influencer program and receive a monthly fee for using their TradingView charts in my analysis.

XAUUSD Analysis todayHello traders, this is a complete multiple timeframe analysis of this pair. We see could find significant trading opportunities as per analysis upon price action confirmation we may take this trade. Smash the like button if you find value in this analysis and drop a comment if you have any questions or let me know which pair to cover in my next analysis.

Gold price analysis March 19⭐️Fundamental Analysis
The Fed is likely to continue to pause the rate cut in March.
The policy decision will depend on the Dot Plot chart and the speech of Chairman Jerome Powell.
Donald Trump's tariff policy may affect the economy and the Fed's interest rate.
Geopolitical tensions (Israel-Gaza conflict, Ukraine-Russia) may boost gold buying demand.
The Bank of Japan (BoJ) is expected to keep interest rates unchanged, affecting the financial market.
⭐️Technical Analysis
The candle broke the ATH zone around 3038 and had a retest of the breakout zone to increase. The candle closed above 3038, confirming that the price will soon push back to the resistance zone of 3054. Support at 3020 and 3006 are still solid supports for buy signals.

Gold Price Analysis March 18⭐️Fundamental Analysis
The ceasefire between Israel and Hamas collapsed as Israel attacked targets across Gaza, killing at least 100 people. Tensions escalated further with unconfirmed reports that the US sank an Iranian intelligence-gathering vessel.
These developments have pushed investors to seek gold as a safe-haven asset, especially amid geopolitical risks and global economic uncertainty due to the US-China trade war.
In addition, US retail sales data for February raised concerns about an economic recession, supporting gold prices but putting pressure on the USD. However, the greenback recovered on Tuesday ahead of the Fed's policy meeting on Wednesday.
⭐️Technical Analysis
Gold is near its all-time high and there is no reasonable technical analysis method to trade it. We still favor retracements and buy up with the trend. 3020 and 3040 are two psychological zones the market is waiting for. nice retracements for BUY signals are waiting around 2980 - 2960 - 2945

XAUUSD Analysis todayHello traders, this is a complete multiple timeframe analysis of this pair. We see could find significant trading opportunities as per analysis upon price action confirmation we may take this trade. Smash the like button if you find value in this analysis and drop a comment if you have any questions or let me know which pair to cover in my next analysis.

Gold Price Analysis March 17⭐️Fundamental Analysis
Persistent concerns over escalating trade tensions and their impact on the global economy, coupled with geopolitical risks, continued to act as a bullish driver for safe-haven bullion. In addition, bets that the Federal Reserve (Fed) will cut interest rates multiple times this year further bolstered the non-yielding yellow metal.
The prospect of further policy easing by the US central bank sent the US dollar (USD) tumbling near multi-month lows touched last week, further supporting gold prices. However, a positive shift in global risk sentiment, bolstered by optimism over China’s stimulus measures announced over the weekend, capped XAU/USD’s gains. Traders also appeared reluctant, opting to wait for the outcome of the FOMC’s two-day policy meeting on Wednesday.
⭐️Technical analysis
Gold is in a difficult trading phase when the price range is unclear for buying and selling zones, pay attention to the 2980 zone today for BUY strategies. If it breaks this zone, the strategy will only SELL to 2955. In case gold breaks 2994, there will be a new AT H in the last trading sessions in Europe and America today.

XAUUSD Analysis todayHello traders, this is a complete multiple timeframe analysis of this pair. We see could find significant trading opportunities as per analysis upon price action confirmation we may take this trade. Smash the like button if you find value in this analysis and drop a comment if you have any questions or let me know which pair to cover in my next analysis.

Gold market analysis: 17-MAR-2025Good morning! Happy New Week! Happy New Day! Here's your daily Gold market analysis. Learn, grow, and trade wisely.

Gold Price Analysis March 14⭐️Fundamental analysis
Optimistic comments from the White House and Canada, along with news that enough Democrats have voted to avoid a US government shutdown, have boosted investor sentiment. However, gold's gains were capped by a stronger US dollar, which was bought for the third consecutive session.
However, expectations that the Fed will cut interest rates multiple times this year could limit the strong recovery of the US dollar. In addition, concerns about former President Trump's tough trade policies and their impact on the global economy continue to support gold prices. This suggests that any correction in gold could be a buying opportunity, helping the precious metal maintain its upward trend for the second consecutive week.
⭐️Technical analysis
any pullback today is considered a reasonable buy 2970 is the area where the European session Gold can find deeper and 2953 are the two BUY zones today. The sell zone is still noticeable around the 3000 round resistance and the 3015 border is considered resistance today. When gold has ATH, the FOMO is very high, so this is a difficult time to trade. Pay attention to volume and good capital management.

GOLD VIEW 3H READ THE CAPTAINHello 👋 gold traders
3-hour timeframe of Gold Spot (XAU/USD) with technical analysis levels and moving averages. Here’s a breakdown of the key points:
Key Observations:
1. Support & Resistance Levels:
Support Level: Around 2,909.870 - 2,902.340 (marked as the buying zone).
Resistance Level: 2,930.173.
Target Point: 2,960.607.
2. Exponential Moving Averages (EMAs):
30 EMA (Red Line): 2,909.870 (Short-term trend).
200 EMA (Blue Line): 2,884.578 (Long-term trend, acting as strong support).
3. Price Action:
The price is currently in a consolidation phase around the resistance zone.
If the price breaks above 2,930, we might see a bullish move toward the target at 2,960.
If the price fails to break resistance, a pullback to the buying zone (support level at 2,909-2,902) is possible.
Trading Strategy Ideas:
Bullish Scenario (Breakout Above 2,930): Look for long positions targeting 2,960.
Bearish Scenario (Rejection at Resistance): A retest of the buying zone (2,909 - 2,902) before another push higher.

Gold Price Analysis March 12⭐️Fundamental analysis
Gold prices are fluctuating in a narrow range due to cautious sentiment before the US inflation data is released. The USD has recovered thanks to investors selling positions after the recent decline.
If inflation is weaker than expected, the Fed may cut interest rates, weakening the USD and pushing gold prices up. Conversely, if inflation is higher than expected, the Fed may keep interest rates high, putting downward pressure on gold prices.
In addition, US-Canada trade tensions and US-Russia peace talks on Ukraine also affect the market, so the impact of inflation data on gold prices may not last long.
⭐️ Technical analysis
Gold is sideways in the Asian session with a small range from 2912-2920. Waiting for signs of breaking out of this range. When the price breaks 2912 to 2908, the US session's Buyer zone is very noticeable. By the end of the US session, the price was still trading above 2908, proving that the price wanted to increase and break 2920 to reach 2929 and 2943. Note that the support zone of 2880 will still be the boundary that gold will find difficult to break today.

XAUUSD Top-down analysis Hello traders, this is a complete multiple timeframe analysis of this pair. We see could find significant trading opportunities as per analysis upon price action confirmation we may take this trade. Smash the like button if you find value in this analysis and drop a comment if you have any questions or let me know which pair to cover in my next analysis.

Gold price analysis March 11⭐️Fundamental Analysis
Gold prices are struggling to capitalize on a modest intraday rebound from a one-week low and remain below $2,900 in Asian trading on Tuesday. Uncertainty surrounding US President Donald Trump’s trade policies and their impact on the global economy continues to weigh on investor sentiment. This, in turn, has supported the safe-haven bullion, attracting some intraday dip buyers near the $2,880 region.
Furthermore, the prevailing US Dollar (USD) selling bias, fueled by speculations that a tariff-driven slowdown in US growth could force the Federal Reserve (Fed) to cut interest rates multiple times this year, further underpins the non-yielding gold price.
⭐️Technical Analysis
Gold price is approaching the resistance level of session 2909 when breaking this zone waiting for the SELL zone in the European session at 2915-2918, the SELL margin is relatively wide. Support 2880 is still an important support level that gold needs more momentum to break this zone.

GoldXAUUSD ( Gold / U.S Dollar )
Key Points :
1. Consolidation Phase
2. Resistance Level
3. Elliot Waves
4. RSI - Divergence
5. Change of Characteristics

XAUUSD Analysis Today Hello traders, this is a complete multiple timeframe analysis of this pair. We see could find significant trading opportunities as per analysis upon price action confirmation we may take this trade. Smash the like button if you find value in this analysis and drop a comment if you have any questions or let me know which pair to cover in my next analysis.

XAUUSD Possible sell on break of structureXAUUSD with the market opening price has initially bounced from the daily support with strong rejection from the top showing potential drop to the support level. Upon break of structure, expecting a potential sell opportunity to the support level as the price is still showing bearish pressure.

GoldXAUUSD ( Gold / U.S Dollar )
Key Points in this Chart :
Break of Structure
Consolidation Phase
HH - HL
Support / Resistance
Triple Top

XAUUSD NFP Analysis todayHello traders, this is a complete multiple timeframe analysis of this pair. We see could find significant trading opportunities as per analysis upon price action confirmation we may take this trade. Smash the like button if you find value in this analysis and drop a comment if you have any questions or let me know which pair to cover in my next analysis.
