Gold Price Analysis March 5⭐️Fundamental Analysis
Gold prices (XAU/USD) have stalled after two days of gains due to rising US bond yields, putting pressure on non-yielding gold. However, gold may be supported by safe-haven demand amid escalating trade tensions.
Specifically, the US imposed a 25% tariff on imports from Mexico and Canada, while China also increased tariffs to 20%, raising concerns about trade retaliation. At the same time, the US's suspension of military aid to Ukraine also prompted investors to seek gold. In addition, the situation became more tense when President Donald Trump and Ukrainian President Zelenskyy disagreed on peace negotiations.
⭐️Technical Analysis
It is clear that gold is rising and heading towards the resistance level of 2929. This is considered a key area for gold. If broken, gold will continue to increase in price to ATH 295x. If Gold breaks the trend and falls, 2903 will no longer be meaningful and it will be at the 2896 area that Gold will really have a price reaction.
Goldidea

Gold Price Analysis March 4⭐️Fundamental Analysis
The market is concerned about the risk of a global tariff war that seems inevitable. US President Donald Trump affirmed to impose 25% tariffs on Canada, Mexico and increase tariffs on China to 20%, leading to retaliatory measures from China and Canada, which could escalate into a full-blown trade war.
In addition, Trump suspended military aid to Ukraine, causing tensions with European allies. The market continues to monitor the upcoming US employment data, which could impact the Fed's interest rate policy, affecting the USD and gold prices.
⭐️Technical Analysis
Today's price range is focused on 2905 and 2877. The Dow trend will still be prioritized when Gold finds it difficult to close above important resistance zones. The Sell zones of 2905 and 2918 are heavily concentrated by sellers today. The furthest target of the week for gold will be to touch the bottom of last week around 283x. Pay attention to important price levels to have a reasonable BUY and SELL strategy.

GOLD to continue in the downward move?Gold - 24h expiry
Our short term bias remains negative.
The trend of higher intraday lows has also been broken.
Offers ample risk/reward to sell at the market.
50 1hour EMA is at 2871.
The overnight rally has been sold into and there is scope for further bearish pressure going into this morning.
We look to Sell at 2874.5 (stop at 2895.1)
Our profit targets will be 2820.8 and 2809.8
Resistance: 2876.6 / 2890.0 / 2910.0
Support: 2855.0 / 2832.4 / 2815.0
Risk Disclaimer
The trade ideas beyond this page are for informational purposes only and do not constitute investment advice or a solicitation to trade. This information is provided by Signal Centre, a third-party unaffiliated with OANDA, and is intended for general circulation only. OANDA does not guarantee the accuracy of this information and assumes no responsibilities for the information provided by the third party. The information does not take into account the specific investment objectives, financial situation, or particular needs of any particular person. You should take into account your specific investment objectives, financial situation, and particular needs before making a commitment to trade, including seeking advice from an independent financial adviser regarding the suitability of the investment, under a separate engagement, as you deem fit.
You accept that you assume all risks in independently viewing the contents and selecting a chosen strategy.
Where the research is distributed in Singapore to a person who is not an Accredited Investor, Expert Investor or an Institutional Investor, Oanda Asia Pacific Pte Ltd (“OAP“) accepts legal responsibility for the contents of the report to such persons only to the extent required by law. Singapore customers should contact OAP at 6579 8289 for matters arising from, or in connection with, the information/research distributed.

XAUUSD Analysis TodayHello traders, this is a complete multiple timeframe analysis of this pair. We see could find significant trading opportunities as per analysis upon price action confirmation we may take this trade. Smash the like button if you find value in this analysis and drop a comment if you have any questions or let me know which pair to cover in my next analysis.

Gold Price Analysis February 28⭐️Fundamental Analysis
This week, the US Dollar (USD) continued to recover on expectations that the Federal Reserve (Fed) will keep its monetary policy tight as inflation remains high. This caused money to flow out of gold - a non-yielding asset.
In addition, gold prices fell as investors adjusted their positions ahead of the US release of important inflation data, a factor that could affect the Fed's interest rate decision and the short-term direction of gold. However, concerns about former US President Donald Trump's tariff policy and risk-off sentiment could help gold hold its price. In addition, falling US Treasury yields also contributed to limiting gold's decline
⭐️Technical Analysis
After closing yesterday's candle, gold confirmed a clear downtrend. The SELL zone that is being watched by investors today is around 2889. Any price increase today is considered a great opportunity to sell. 2840 is considered as the support zone today. The wider price range is being watched when there are signs of Break out from the narrow range at 2920 and 2806. Currently, gold needs to break through 2870 to reach the upper range and if it fails to break 2870, we can set SELL signals at 2840 today.

XAUUSD Analysis todayHello traders, this is a complete multiple timeframe analysis of this pair. We see could find significant trading opportunities as per analysis upon price action confirmation we may take this trade. Smash the like button if you find value in this analysis and drop a comment if you have any questions or let me know which pair to cover in my next analysis.

XAUUSD Analysis todayHello traders, this is a complete multiple timeframe analysis of this pair. We see could find significant trading opportunities as per analysis upon price action confirmation we may take this trade. Smash the like button if you find value in this analysis and drop a comment if you have any questions or let me know which pair to cover in my next analysis.

XAUUSD NEXT possible move We are waiting for our asset to reach our action zone, and based on the reaction, we’ll decide on our next moves.ALWAYS WAIT FOR A CONFIRMATION TO SEE IF THE PRICE VALIDATES THE ZONE.and you what is your vision of the EURUSD its interests me! i wait you in the commentary

Gold price analysis February 26⭐️Fundamental analysis
Gold prices rose sharply in the middle of the week thanks to weak US economic data, causing the USD and bond yields to weaken. Concerns about tariffs with Canada, Mexico and the risk of a trade war helped gold maintain its upward momentum.
However, gold prices may face difficulties as the USD recovered slightly after the US House of Representatives passed a budget plan, supporting Trump's tax policy. The US-China meeting on tariffs also restrained the increase, but risk aversion still boosted the demand for safe-haven gold. Investors also followed the speech of Fed officials for more signals about the market.
⭐️Technical analysis
Gold prices unexpectedly increased in the Asian session with the force pushing back to the breakout zone of 2930. The price range of gold has been noted on the chart with the small range of 2892-2942 and the large range of 2868-2978. Gold closing below 2912 will signal a Downtrend and head towards the lower band. On the other hand, Gold's upward path faces more resistance around 2921 and 2930.

GoldXAUUSD ( Gold / U.S Dollar )
Break of Structure
Falling Wedge as an Corrective Pattern in Short Time Frame
Demand Zone
Change of Characteristics
Completed " 1234 " Impulsive Waves

Gold Analysis May 25⭐️Fundamental Analysis
Market sentiment remained cautious on Tuesday due to concerns over Trump tariffs and Nvidia's upcoming earnings report. The US dollar continued to hold its strength on risk-off sentiment, limiting gold's gains. However, gold prices remained supported by falling US Treasury yields and rising trade war risks.
Bond yields fell on a strong auction and weak PMI data, raising expectations that the Fed will cut interest rates twice this year. Meanwhile, trade tensions escalated as the Trump administration considered tightening controls on chip exports to China.
⭐️Technical Analysis
Gold prices are still operating in a wedge of 2928 and 2952. The 2958 zone is also quite easy to create a false ATH. 2968-2970 acts as the most important resistance for Gold at the moment, which is considered the weekly resistance level. Watch out for gold falling, there could be a deep drop to 2906-2900.

GOLD (XAU/USD) – Breakout or Deeper Pullback?Hello, Traders! 👋
What are your thoughts on gold?
Gold remains in a robust uptrend, with each downturn providing a buying opportunity inside the trend.
The ideal strategy at this point is to wait patiently for a price pullback to support levels before starting a buy position.
Another method is to wait for a break above the most recent high before buying on a pullback to the broken level.
The bullish trend continues, but trades must be performed with correct risk management and confirmation indications.
What is your opinion on gold? Do you anticipate further growth?
🚀 GOLD (XAU/USD) – Breakout or Deeper Pullback? 🔥
💰 Gold Spot (XAU/USD) - 8H Chart Analysis
🔍 Market Insights:
🔹 Strong Uptrend: Gold continues to hold its bullish momentum, respecting the ascending trendline.
🔹 Key Resistance Zone: The $2,945 - $2,960 area has been acting as a supply zone (black box).
🔹 Fibonacci Support: Price recently tested the 0.236 Fib levels ($2,902 & $2,871), which align with a key demand zone (yellow box).
📈 Two Potential Scenarios:
📌 Bullish Breakout: If price holds above the trendline & reclaims resistance, we may see a breakout towards $2,980 - $3,000 🚀.
📌 Deeper Pullback: If support breaks, we could see a correction to $2,875 - $2,850 before a stronger reversal.
📊 Key Levels to Watch:
✅ Support: $2,902 - $2,871 (Fib Levels & Trendline)
✅ Resistance: $2,945 - $2,960 (Supply Zone)
💬 Do you think gold will break out or dip before the next leg up? Drop your thoughts below! 🔥👇
#gold #xauusd #forex #trading #priceaction #technicalanalysis

XAUUSDHello Traders! 👋
What are your thoughts on GOLD?
Gold remains in a strong uptrend, and every pullback presents a buying opportunity within the trend.
The best approach at this stage is to wait patiently for a price correction to support levels before entering a buy position.
Another strategy is to wait for a break above the recent high and then enter a buy trade on a pullback to the broken level.
The bullish trend remains intact, but trade entries should be executed with proper risk management and confirmation signals.
What’s your outlook on gold? Do you expect further upside?
Don’t forget to like and share your thoughts in the comments! ❤️

Gold price analysis February 24⭐️Fundamental Analysis
The uncertainty surrounding former US President Donald Trump's tariff policy and global economic risks continue to strengthen gold's role as a safe-haven asset. In addition, geopolitical tensions and pessimistic sentiment towards the US Dollar (USD) also contributed to supporting gold prices.
However, expectations that the US Federal Reserve (Fed) will maintain high interest rates to control inflation have limited the upside of this precious metal. Investors are now focused on the US Personal Consumption Expenditures Price Index (PCE) report on Friday, important data that could influence the Fed's interest rate policy, impact the USD and the next trend of gold prices.
⭐️Technical Analysis
Gold is currently relatively difficult to trade and pay attention to the Gold range around 2953 and 2906. A relatively wide range. The further range of 2978 and 2873 will be noticed this week. In the end of the H4 candlestick session, it closed above 2941. Gold will soon have a price of 2953. On the contrary, when gold closes below 2933, we can wait for a retest around 2938-2940 to SELL. TP Gold is still around 2923. If we break this area, pay attention to 2906. Wish you a successful trading day.

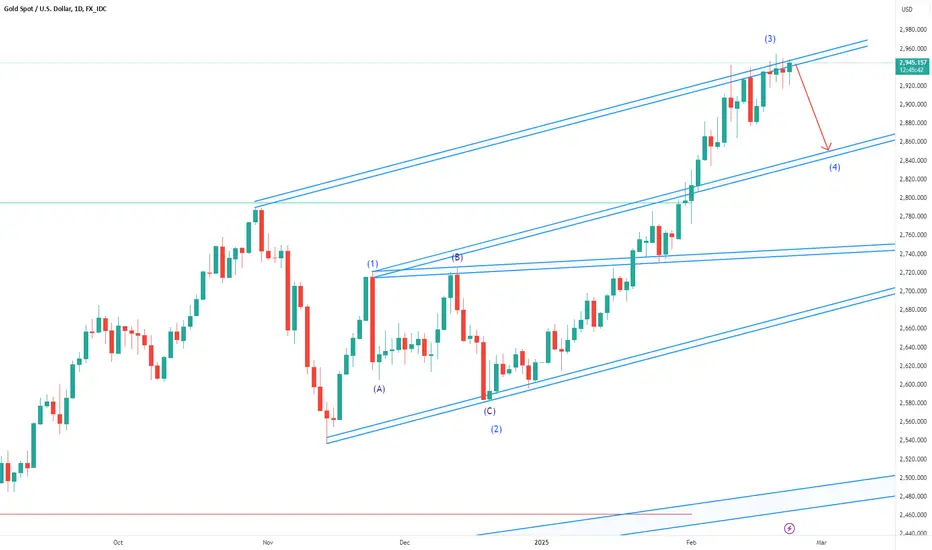
#Gold Wave 4 soon$3000 is a psychological level. So, I believe wave 3 should end here. It could go a little higher ~$3030ish. Then will drop about 5%-7% to conclude wave 4.
Overall I am bullish on Gold (XauUsd).
#XAU
TVC:XAU
XAUUSD Top-down analysisHello traders, this is a complete multiple timeframe analysis of this pair. We see could find significant trading opportunities as per analysis upon price action confirmation we may take this trade. Smash the like button if you find value in this analysis and drop a comment if you have any questions or let me know which pair to cover in my next analysis.

Gold price analysis February 21⭐️Fundamental Analysis
Gold prices fell as investors booked profits ahead of the release of key US economic data, including PMI and PCE inflation.
The Fed minutes did not change expectations for two rate cuts this year, but maintained a cautious stance. If the economy is strong and inflation is high, the Fed may not be in a hurry to ease policy.
Gold prices may fluctuate in the short term following economic data, but are still supported by concerns about Trump's tax policies and Russia-Ukraine tensions.
Despite the correction, gold remains a safe haven, and dips can be good buying opportunities.
⭐️Technical Analysis
Gold price is heading towards 2920 and this area is the most important area for gold today. When breaking 2920, pay attention to the 2906 area for BUY signals and just wait for the test beats to sell around 2920 when this area is broken. When gold bounces from 2920, the market continues to want to increase. As long as there is any close above 2928, gold will soon regain the resistance level of 2944. Wish everyone the best trading strategy.

Gold price analysis February 20⭐️Fundamental Analysis
The rally came after US President Donald Trump said a trade deal with China was possible. Geopolitical concerns increased after US President Trump said Ukraine had started a war with Russia and hinted that it was time to pay back all the aid it had provided to the US.
Meanwhile, the Federal Reserve (Fed) meeting minutes from Wednesday night had little impact. Only a few members of the Federal Open Market Committee (FOMC) favored stable interest rates and were in no rush to cut. Considering this, the possibility of a rate cut in June remains.
⭐️Technical Analysis
Gold prices are currently difficult to trade as they are at an all-time high. any recovery to the breakout points is considered the best opportunity to buy gold towards the 3000 peak. Watch for recovery points around 2940-2920 for BUY signals and watch the 2970 area as today's major resistance.

XAUUSD Top-down analysis Hello traders, this is a complete multiple timeframe analysis of this pair. We see could find significant trading opportunities as per analysis upon price action confirmation we may take this trade. Smash the like button if you find value in this analysis and drop a comment if you have any questions or let me know which pair to cover in my next analysis.

Gold price analysis February 19⭐️Fundamental Analysis
Gold prices rose again due to concerns about new tariffs from former US President Donald Trump and the deadlock in negotiations between the US and Russia. Trump announced that he would impose tariffs of 25% or more on pharmaceuticals, semiconductors and automobiles, putting great pressure on European and Asian economies. This raised concerns about supply chain disruptions and global inflation.
In addition, the negotiations between the US and Russia did not progress, causing investors to seek safe assets such as gold and USD. However, the market is still cautiously waiting for the Fed's meeting minutes, because if the Fed maintains its stance of curbing inflation, gold prices may be restrained.
⭐️Technical Analysis
Gold prices reacted around the old peak around 2940, proving that buyers are not strong enough to push prices to create a new ATH and need a more suitable price. There are two price levels 2916-1914 and 2906-2904 which are the areas where the Buyers are very interested in jumping into the market. The price range 2924-2934 is considered as this Asia-Europe range for breakout signals when there are signs of crossing.

Gold price analysis February 18⭐️Fundamental Analysis
Top US and Russian officials will meet to discuss ending the war in Ukraine, but there are concerns that a decision may be made without the participation of Ukraine and Europe.
Weak risk sentiment has boosted demand for the safe-haven US dollar, putting pressure on gold prices. At the same time, Fed officials were cautious about inflation and interest rate policy, strengthening the US dollar and US Treasury yields. The Fed governor said that inflation is progressing slowly, possibly delaying a rate cut until 2025.
In the coming time, the market will focus on speeches by Fed officials for clues on monetary policy, as well as monitor the developments in negotiations between the US and Russia, a factor that could have a big impact on risk sentiment and gold prices.
⭐️Technical Analysis
Gold prices approached the 2915 resistance zone before the US session, marking the importance of this price zone today. When the candle does not break through 2915 when Europe enters, SELL to 2906. In case of break 2915, wait for retest buy back around 15 TP around 2927. Pay attention to price reaction around 2920. BUY zones of gold around 2906-2900-2895. SELL zones of gold 2927-2949

EURUSD analysis February 18Your trading strategy is based on a combination of strong support at 1.044 and signals from the EMA 34. This is a reasonable approach if the correction weakens and buying pressure increases.
Some notes:
Confirmation from price action: If the price reacts strongly to the 1.044 area (such as forming a reversal candlestick pattern or RSI divergence sign), the possibility of a bounce will be higher.
Risk management: Stoploss 1.03900 is quite tight, ensuring low risk. However, if the sellers are strong and break through 1.044, you need to be ready to cut losses to avoid being caught in the downtrend.
Flexible profit taking: TP1 (1.05100) is the nearest resistance zone, you can take partial profits here and move SL to breakeven to optimize profits if the price continues to 1.05700.
You can also keep an eye on momentum indicators or economic news that may affect EUR/USD to make appropriate decisions. 🚀

XAUUSD top-down analysis Hello traders, this is a complete multiple timeframe analysis of this pair. We see could find significant trading opportunities as per analysis upon price action confirmation we may take this trade. Smash the like button if you find value in this analysis and drop a comment if you have any questions or let me know which pair to cover in my next analysis.
