XAUUSD another sell opportunity, UPDATE!!GOLD (4H) is forming bearish price action below daily resistance. After the monthly breakdown, the price is currently below monthly support. previous daily candle has a lower high, today price creating a series of lower high below this daily resistance signs of selling pressure giving another selling opportunity.
Goldideas

GoldViewFX - Market UPDATEHey Everyone,
Another awesome day!!!
Market opened with a challenge on previous days Goldturn high 1676, followed with a new Goldturn at the same level 1676. This confirmed failure to break previous day's high. We waited patiently for further confirmation and identified EMA5 cross and lock below 1671 to 1664, confirming the movement down to the next level.
We carefully placed our SELL order and trailed it down to 1664 BOOOOM!!!! We walked through this step by step in VIP premier.
We still have an open gap target to 1687, which gives us the confidence to take buy signals from deeper movements down. However, due to the Fed's rate hike announcement and the odds between a 75-bps and 100-bps, we are only taking careful entries from strategically positioned support levels and sells from tested resistance levels.
The range is still 1659 to 1687 and as advised yesterday, we will be looking for a break of either of these levels for a continuation of the bearish move or a full recovery into benchmark pricing from last week.
Bullish Targets
1687
1695
Cross and lock above 1695 will open targets to 1708, 1722, 1733
Bearish Targets
1671 - DONE
1659 - DONE
Cross and lock below 1659 will open targets to 1647 and 1641.
SWING RANGE
1647
As always, we will keep you all updated with any changes to our plans throughout the week. Please don't forget to like, comment and follow to support us, we really appreciate it!
GoldViewFX
XAUUSD TOP AUTHOR

GoldViewFX - 1H CHART MARKET UPDATEHey Everyone,
Fantastic start to the week. We waited patiently for the market to hit support levels 1671 and 1659 and then waited for a new Goldturn and took our BUY entry, all the way to 1669 for the perfect TP exit.
We still have an open gap target to 1687, which gives us the confidence to take buy signals. However, due to the Fed's rate hike announcement and the odds between a 75-bps and 100-bps, we are only taking careful entries from strategically positioned support levels.
The range is still 1659 to 1687 and as advised yesterday, we will be looking for a break of either of these levels for a continuation of the bearish move or a full recovery into benchmark pricing from last week.
Bullish Targets
1687
1695
Cross and lock above 1695 will open targets to 1708, 1722, 1733
Bearish Targets
1671 - DONE
1659 - DONE
Cross and lock below 1659 will open targets to 1647 and 1641.
SWING RANGE
1647
As always, we will keep you all updated with any changes to our plans throughout the week. Please don't forget to like, comment and follow to support us, we really appreciate it!
GoldViewFX
XAUUSD TOP AUTHOR

XAUUSD (Gold) Inverted HammerXAUUSD Will Keep Growing Target For Buyers after downtrend inverted hammer
See the graphic for my analysis of gold. I am preparing for a potential sell when the market retraces to levels near 1700.

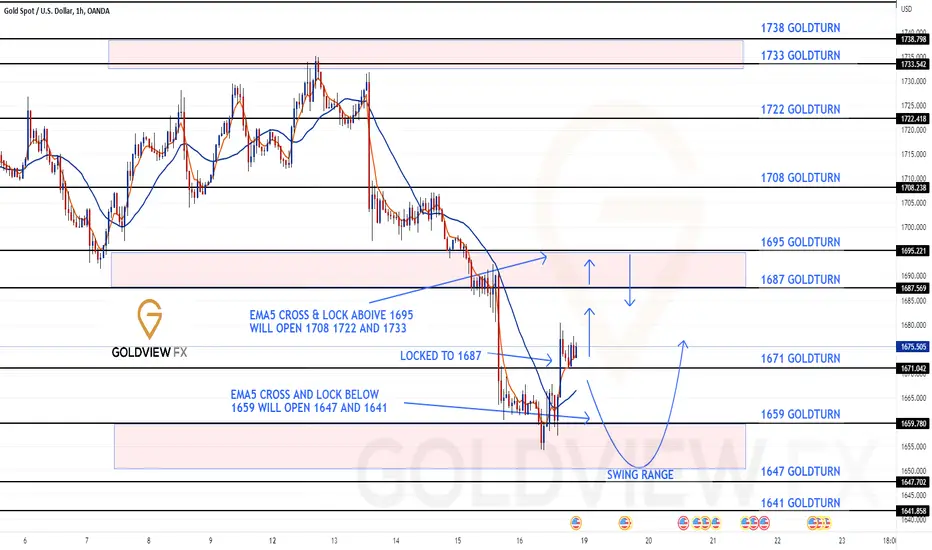
GoldViewFX - 1H CHART UPDATED LEVELS & TARGETSHey Everyone,
Please see updated weighted Goldturns and targets for the 1H chart.
We have a current range between 1659 to 1687 and expect some ranging action between these levels. Technically we will be looking for a break of these levels for a continuation of the bearish move or a full recovery into benchmark pricing. We currently have a cross and lock above 1671 opening 1687.
Bullish Targets
1687
1695
Cross and lock above 1695 will open targets to 1708, 1722, 1733
Bearish Targets
1671
1659
Cross and lock below 1655 will open targets to 1647 and 1641.
SWING RANGE
1647
As always, we will keep you all updated with any changes to our plans throughout the week. Please don't forget to like, comment and follow to support us, we really appreciate it!
GoldViewFX
XAUUSD TOP AUTHOR
GoldViewFX - 1H CHART UPDATED LEVELS & TARGETSHey Everyone,
Please see updated 1H chart with fresh weighted Goldturns, ready for trading level to level.
We finished off the end of last week with some aggressive move down and then price found some support at 1734 GOLDTURN. This zone is an important support area and we may see the TAKE OFF from here straight into a full recovery, with a strong a bull run. However, a retracement down and an EMA5 cross and lock below 1734 will open the full swing range challenge, We need to keep this in mind when managing risk.
If we see a move up on market open; we will be looking for a cross and lock above 1742 to confirm the upper levels. otherwise we need to keep a close eye on this 1734 support challenge, which can open the lower levels.
BULLISH TARGETS
1738
1742
1747
1753
BEARISH TARGETS
1734
1726
SWING RANGE
1718
Our plans to Buy from deeper moves down still remain in play, as we are still well within the swing range. Remember we will let the momentum settle, identify a Blueprint and then start hunting!!
As always we will keep you all updated with any changes to our plans throughout the week. Please don't forget to like, comment and follow to support us, we really appreciate it!
GoldViewFX
XAUUSD TOP AUTHOR

GOLD possible sell area!!GOLD ( 4H ) is in a long-term downtrend based on multiple timeframes. Currently, the price is in a pullback stage and it is highly likely that GOLD may rise to 1760 to test the previous support as resistance as a trend continuation pattern. Upon price action confirmation, a selling opportunity may arise in GOLD after rejection.
Press the like button if you enjoy this content:)

GoldViewFX - Market UPDATEHey Everyone,
This is our updated 1H chart from yesterday, which is playing out within the Bearish Goldturn channel heading into the swing range area. We may see some retracement up to 1742 - 1747 inline with the channel but we feel the movement down is not over. However, we are in good support area for some scalping BUYS that look safe measured with the Goldturns
With a volatile week ahead we are waiting patiently for the right entries and we spent today observing and waiting patiently for a Blueprint of the range. Any deeper moves down this week will be short lived so taking the right buy entries, as a mid to longer term plan is crucial. Sell entries will only be considered if we see some solid resistance with re-tests otherwise a risky train to jump onto.
BULLISH TARGET
1747
1755
1762
BEARISH TARGETS
1742 - DONE
1736 - DONE
1730 - DONE
SWING RANGE
1723 - 1716
As we said yesterday the best way to trade JACKSON HOLE is to wait for the move and patiently let the momentum exhaust, measuring the momentum using the Goldturns. Ideally we would like to see movement down as deep as the momentum allows, establish a floor and then organically ride the movement up. If it heads up from the start then we already fall in line with our long term projections for Gold with our Axis target providing exit should we decide to get in on any buy signals in VIP .
As always we will keep you all updated with any changes to our plans throughout the week. Please don't forget to like, comment and follow to support us, we really appreciate it!
GoldViewFX
XAUUSD TOP AUTHOR

GoldViewFX - MARKET UPDATEHey Everyone,
Another day of patiently waiting for the deeper move into the swing range and then we picked up a nice BUY from support activated by our signal with the perfect exit at 1758 before the tank down.
As we mentioned yesterday EMA5 break and lock below 1776 opened the swing range like we shared and now we are seeing the full swing range being tested and just shy of 1743, which is now open and we will see how price reacts to this level. We expect to see price head up from this zone, however a EMA5 break and lock below 1743 will open the lower range down to a test on support structure 1707.
We will come back on Sunday with a our multi-timeframe analysis for the coming week and keeping in mind JACKSON HOLE next week so we must consider this in our risk management plan for the week ahead.
Enjoy your weekend everyone and please don't forget to like, comment and follow to support us, we really appreciate it!
GoldViewFX
XAUUSD TOP AUTHOR

GoldViewFX - Market UPDATEHey Everyone,
Once again we waited patiently for the setup and as mentioned already this week, we were either looking for a EMA5 lock above 1804 weighted Goldturn to open the upper range or a EMA5 lock below 1779 weighted Goldturn to open the swing range.
EMA5 has now broken 1779 opening the swing range. We waited for confirmation on our VIP levels and took a nice sell to 1773. Another clean call with clean profit!!!!
Although we remain Bullish from support, we must now take into consideration the full swing range is open and therefore we need to manage our risk accordingly with the range.
We expecting a volatile day tomorrow from US session all the way to FOMC 7PM UK time and therefore we will wait for signal or setup confirmation before considering positions. If we see a move down, we will wait for momentum to exhaust before talking the ride up. However we may see movement UP during the earlier sessions so be careful not to jump in too early to ride the movement up and then get stuck on the swing down. We may see bi-directional movement tomorrow so timing is crucial otherwise you may get stuck on a buy when price is moving down or stuck in a sell when price is moving up, which is the typical situation in these market conditions.
As always we will keep you all updated with any changes to our plans throughout the week. Please don't forget to like, comment and follow to support us, we really appreciate it!
GoldViewFX
XAUUSD TOP AUTHOR

GOLD trade idea (TUE - 16/08) : SELLI put this down much earlier but it was hidden by TradingView.
Simply continuing from its current bearish trend , GOLD will look for liquidity downwards.
Picked the near swing high to analyse this trade.
There's a lower TP if you'd like.
*Enter at your won discretion, this is simply an idea*

My updated Daily Chart analysis for Gold here is what I'm currently observing on Golds Daily chart and what I anticipate. As always be fluid and be able to adjust

Gold Weekly Rounding TopObserving Gold's weekly chart, It now appears its in a rounding Top/ Bearish Inverted Cup and Handle Pattern. In Addition to that It also appears we're possibly in the 4th wave up leading into the 5th wave, which is a retest of the C leg which I have at around $1889/1890. A rejection of this level also gives The 5th wave down the Right Shoulder to the bearish Head and shoulders pattern. I then see a sell off on the ABCD Pattern.. Where lastly The D leg of the ABCD pattern retesting the Flag Break Out.
I have a short Term Target of $1840. and will look to switch to the bearish side after the 5th wave is confirmed. In Fact this whole movement by gold looks like a bearish ABCD pattern. After we reach the Finally D leg, I will look to go long and see gold retest the $2,000.00 per oz

short to B leg target $100.789usd is facing pressure, I see a retrace to B leg. This should help gold, bitcoin , and silver imho

GoldViewFX - 4H CHART UPDATED LEVELS & TARGET$$Hey Everyone,
Please see 4H chart setup for the coming week with updated upper Goldturns.
EMA5 has crossed MA200 again confirming the Bullish setup. We have a retracement range between 1761 and 1748 for any movement down before resuming Bullish move. However a EMA5 break and lock below 1761 will open the full swing range. We also have a gap target at 1798 left open from last weeks chart setup.
We will continue to trade this level to level with bias towards buying dips strategically picking entries that also allow us to ride swings.
BULLISH TARGETS
1777
1778
1798
BEARISH RETRACEMENT TARGETS
1761 E
1748
SWING RANGE
1730 - 1721
STRUCTURE SUPPORT
1694 -1685
As always we will keep you all updated with any changes to our plans throughout. Please don't forget to like, comment and follow to support us, we really appreciate it!
GoldViewFX
XAUUSD TOP AUTHOR

GOLD SHORT1. Gold in top trendline / channel
2. On 4H resistance level
3. It's still hanging in there but my gues is it will drop from here
4. Stoploss could be a bit more loose for conservative SL
5. Go short and manage risk

Gold Daily Analysis 07.07.2022Yesterday Gold made new low of 1732 and is trying to break the bearish trend line which it started from two days. For bulls to show up gold needs to close above 1746 in 4 hours. Otherwise the bearish trend will continue to form new lows.
The technical indicators RSI, BB and MA are suggesting for a buy. But Price Action is not in support for Bulls as we can see from the strong red candles.
As we can see from the weekly chart the Fib levels suggestt 1686 to 1760 are 68% and 50% levels since it made the high at 2070 and low 1451. So if the bearish trend continues we can expect some reversal near 1686 since no bulls showed up at the 1760. However remeber that these levels are very good for longerm BUY. So if you can wait then go for buying at these lows.
We can also see the formation of a new ultra bearish trend line (Red). So dont trade for reversals unless gold closes above this line. If price comes near this line we will go for sell with small SL as the trend is bearish.
For today my plan is
Sell 1946 SL 1954 TP 1926

Gold: upside looking more limitedGold traded in 1820s-40 yesterday still inside the the descending trendline. 1840s now likely knocked out of the game. With the new resistance being at 1830 first and 1832-34 next. Gold is still bearish biased any move up to 1832-34 I will cautiously resell if hold with target to previous low 1821 scalping term and 1816-12 long term with possible breakdown. Gold upside limit now likely down to 1838 for the time being. Break above 1838 will require wait and see. the zones you see are from lower timeframe that why it looks like that on 4h. Goodluck

XAUUSD Gold Analysis ForecastXAUUSD There is bearish pressure on the 1821 zone. Price is forming lower highs, showing sellers are finding value selling at lower and lower prices. It is likely the 1821 zone will give way and to the next likely support zones, then I think we will see a big bull trend reversal as Gold is bullish on the higher time frames (for a long time)

GOLD possible sell zone!!After daily double Doji and GAP opening, GOLD is primarily creating bearish price action and there is a possibility to drop to the daily support level soon!!

Possible upswing ahead of Chair PowellGold is going triangular trend pattern on multiple timeframe. Here is my view. If gold reject firmly at the blue zone that might trigger a triple tap reaction ahead of Chair Powell speech. For the time being the purple zone look like the limit for the bull. Generally Dollar still have upper hand. As you can see less hurdle at the downside for the bear break below the blue zone will be a smooth trip.

GoldViewFX - WEEKLY CHART UPDATEHey Everyone,
As you can see the weekly chart is still inline with the setup and the structure is also being maintained, with every price drop being rejected at the Goldturn trendline support providing the ascending support.
EMA5 is looking comfortable between 1826 and 1871 GOLDTURN, which is maintaining the current range. EMA5 cross above 1871 will open the upper weekly Goldturns and a cross below 1826 will open the lower weekly Goldturns.
BULLISH Targets
1871, 1913
Retracement Range
1826
SWING RANGE
1796
We will keep this chart updated with any significant changes to the structure. Please don't forget to like, comment and follow to support us, we really appreciate it!
GoldViewFX
XAUUSD TOP AUTHOR

GoldViewFX - DAILY CHART UPDATEHey Everyone,
Update on our daily chart setup that we have been following for a while. As you can see we had another challenge to 1804 structure support, which held out again perfectly maintaining the Bullish structure. The support provided the momentum needed to push back into the Goldturn trendline support, which then found support on the retest of the trendline, gearing up for another 1858 challenge. This is a significant challenge, as we are looking for ema5 to cross and lock above 1858 to confirm and open the upper targets.
BULLISH TARGETS
1844, 1858, 1881, 1899
RETRACEMENT TARGETS
1832
1804 IS THE STRUCTURE SUPPORT .
This level is maintaining the overall BULLISH structure
As always we will keep this chart updated with any changes to our plans. Please don't forget to like, comment and follow to support us, we really appreciate it!
GoldViewFX
XAUUSD TOP AUTHOR
