Perfect ending, gold trend analysis and layout for next weekEarly layout plan for gold: 3.31-4.4 Reviewing this week, a total of 20 layouts were arranged, and the overall harvest was 1245pips! This week can be called a super week. After the tariff fundamentals were implemented, the market started the callback mode, and there was a big sweep in the middle. It is unrealistic to say that we can win all the games. The number of mistakes we made this week has also increased. This is normal, but our eye-catching operations are even more dazzling, and we have gained more. Overall, I am quite satisfied. I will continue to work hard next week.
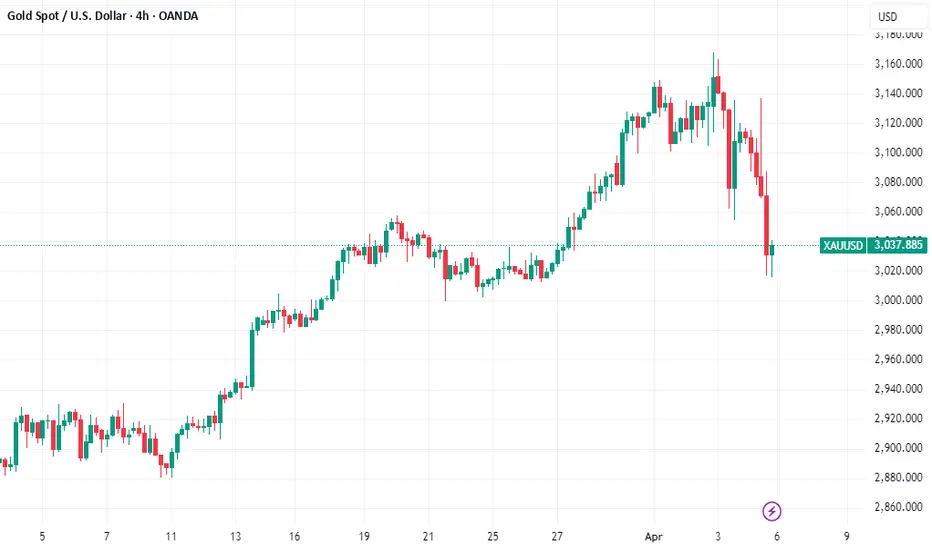
Analysis of gold market trends next Monday: Technical analysis of gold: The gold market on Thursday and Friday this week can be described as thrilling, with a rise and fall of more than 100 points in two days! The gold market suddenly changed, and there was an extremely violent sweep. First, it rose rapidly to 3136 without any signs, and then fell back quickly at lightning speed, and fell below the intraday low. After a series of big negative declines, the current short-term trend of gold is bearish. The daily line has a big negative downward trend, breaking the short-term moving average and piercing the middle track, leaving a lower shadow below. The pattern shows a bearish signal of Yin engulfing Yang. In the short term, it may rely on the support of the middle track to confirm the 10ma resistance and fall again. The 4-hour Bollinger band opens and extends downward. The K-line continues to decline, and the trend is bearish and downward. The callback space is larger than the rising space. Falling below the previous day's starting low of 3054 is a short-term empty point, and the lowest retracement is around 3015. The daily line is in a partial adjustment in the short term.
Combined with the falling wave space of the 4-hour chart. The 3000 integer mark is the support position of the golden section point 0.5. The 4-hour Bollinger Bands open downward, and the K-line continues to decline. The downward trend is obvious. The focus below is on the break of the 3000 mark. As long as the 3000 mark is held, the short-term bullish structure will not change. The market will continue to rise to new highs. If the 3000 mark is broken, the market will form a large-level adjustment structure. The short-term operation is mainly to buy on dips above 3000, and to sell at high altitudes. The upper resistance is around 3054-3057-3072, and the lower support is 3015-3000. On the whole, the short-term operation of gold next Monday is mainly to buy on rebounds, and to buy on callbacks. The upper short-term focus is on the 3054-3057 resistance line, and the lower short-term focus is on the 3000-3015 support line. Friends must keep up with the rhythm. It is necessary to control the position and stop loss, set the stop loss strictly, and do not resist the single operation. The specific points are mainly based on real-time intraday trading. Welcome to experience and exchange real-time market information ☎️, enter ✈️✈️ to follow real-time orders.
Reference for gold operation strategies on Monday:
Short order strategy: Strategy 1: Short gold rebounds near 3045-3055, stop loss 10 points, target near 3030-3015, break to see 3000 line.
Long order strategy: Strategy 2: Long gold pullback near 3015-3005, stop loss 10 points, target near 3030-3040, break to see 3050 line.
Goldintraday

Gold Price Drops on Tariff Selloff
Gold, long considered a safe-haven asset during times of economic uncertainty, experienced a sharp reversal of fortune this Friday, tumbling as much as 2.4% and extending losses from the previous session. This significant decline came as a surprise to many who had witnessed the precious metal steadily climb to record highs in recent weeks, fueled by persistent inflation concerns, geopolitical instability, and expectations of easing monetary policy. However, the resurgence of tariff anxieties has triggered a broad selloff across various asset classes, including gold, as investors recalibrate their risk exposure in the face of heightened economic uncertainty.1
The catalyst for this sudden shift in market sentiment has been the renewed threat of escalating trade tensions.2 While the specifics of the "tariff shock" are crucial in understanding the market reaction, the general principle is that the imposition or threat of tariffs can disrupt global supply chains, increase costs for businesses and consumers, and ultimately dampen economic growth.3 This increased uncertainty and the potential for negative economic consequences have prompted investors to reassess their portfolios and, in many cases, reduce their exposure to assets perceived as riskier or less liquid, even those traditionally considered safe havens.4
Gold's traditional role as a safe haven stems from its historical use as a store of value, its limited supply, and its lack of correlation with traditional financial assets during periods of stress.5 In times of economic turmoil, investors often flock to gold as a hedge against inflation, currency devaluation, and market volatility.6 This flight to safety typically drives up the price of bullion.7
However, the current market reaction suggests a more nuanced dynamic at play. The tariff shock appears to have triggered a broader reassessment of risk, leading to a selloff that encompasses not only equities and other riskier assets but also traditional safe havens like gold. Several factors could be contributing to this phenomenon.
Firstly, the prospect of tariffs can lead to concerns about slower global growth.8 If economic activity contracts, it could reduce overall demand, potentially impacting even safe-haven assets like gold, particularly if investors anticipate lower inflation in the long run. While gold is often seen as an inflation hedge, a significant deflationary shock could negatively affect its price.
Secondly, the imposition of tariffs can create uncertainty about future economic policies and international relations.9 This uncertainty can lead to increased volatility across all asset classes, prompting investors to reduce overall exposure and move towards cash or other highly liquid assets. In such scenarios, even assets perceived as safe havens might be sold off as part of a broader de-risking strategy.
Thirdly, the recent run-up in gold prices to record highs might have made it a target for profit-taking. After a significant rally, any negative news or shift in market sentiment can trigger a wave of selling as investors look to lock in gains. The tariff shock could have provided the catalyst for such profit-taking, exacerbating the downward pressure on gold prices.
Furthermore, the interconnectedness of global financial markets means that negative sentiment in one area can quickly spread to others.10 The fear of a trade war can impact equity markets, leading to margin calls or a general desire to reduce risk across portfolios, which could include selling gold holdings.
The extent of the gold selloff – a 2.4% drop in a single day is significant for a traditionally stable asset – underscores the severity of the market's reaction to the tariff news. This move also highlights the fact that even safe-haven assets are not immune to broad market dislocations and shifts in investor sentiment.
Looking ahead, the trajectory of gold prices will likely depend heavily on how the tariff situation unfolds and its actual impact on the global economy. If the tariff threats escalate into a full-blown trade war with significant negative consequences for growth and corporate earnings, we could see further volatility across all asset classes. In such a scenario, the initial reaction might be continued selling pressure on gold as investors prioritize liquidity and de-risking.
However, if the economic fallout from tariffs becomes more apparent and concerns about stagflation (slow growth with high inflation) resurface, gold's traditional safe-haven appeal could reassert itself. In a stagflationary environment, gold could once again become an attractive asset as a hedge against both economic stagnation and the erosion of purchasing power.
Moreover, any signs of easing monetary policy by central banks in response to slowing economic growth could also provide support for gold prices. Lower interest rates reduce the opportunity cost of holding non-yielding assets like gold and can also be inflationary in the long run.
In conclusion, the recent tumble in gold prices following the tariff shock demonstrates that even traditional safe-haven assets are susceptible to broad market selloffs triggered by significant economic uncertainties. The initial reaction appears to be driven by a general de-risking across asset classes and potential profit-taking after gold's recent record highs. However, the future performance of gold will depend on the evolving economic landscape, the actual impact of tariffs, and the response of monetary policy. While the immediate reaction has been negative, gold's role as a potential hedge against economic turmoil and inflation could see it regain its footing if the negative consequences of the tariff shock become more pronounced. Investors should closely monitor developments in trade policies and their broader economic implications to gauge the future direction of gold prices. The current volatility serves as a reminder that even in the realm of safe havens, market dynamics can shift rapidly and unexpectedly.
Non-agricultural gold is expected to fall sharply. On Friday (April 4), at 20:30 Beijing time, the U.S. Bureau of Labor Statistics released the highly anticipated March non-farm payrolls report, which put pressure on gold.
Fundamentals: Today, gold is expected to fall sharply. The market continues to short at resistance points.
Market volatility is expected to increase during the period. The long-short game of the US dollar index near the 102 mark will determine whether it can continue to rise. If it breaks through 103, it may further suppress gold and non-US currencies. Gold is looking for direction in the range of 3080-3100 US dollars/ounce. If risk aversion picks up, it may retest the 3100 mark; on the contrary, if the US dollar continues to strengthen, breaking through 3080 will open up downside space. The decline in US stock futures may continue until early next week.

4.5 Gold falls off a cliff and waits to stabilize! ! !Gold 4-hour level: The last wave of pull-up started from the low point of 2999 to 3167. Yesterday, it fell back and tested the 618 split position 3063. The current support is still valid, which is also the MA66 day position; From the perspective of macd, it is still short-selling and has not been fully repaired. Wait until it crosses below the zero axis, and then slowly stabilizes and tends to golden cross in the future market, then a wave of trend pull-up will gradually form, and it will take time; if 3063 cannot be maintained, the two split positions below are 3035 and 3018, and attention should be paid to stabilization.
Intraday support: 3035 3018 3005
Resistance: 3045 3070 3100

4.4 Analysis of gold short-term operation strategy!!!On Thursday (April 3), spot gold experienced a surprising volatility, with a single-day fluctuation of nearly $114, and the price of gold finally closed down.
Analyze the technical outlook of gold intraday.
The 4-hour chart of gold shows that the price of gold is trading below the currently flat 20-period SMA, but it is still well above the bullish 100-period SMA, which provides support near $3040/oz. At the same time, technical indicators have recovered from near oversold readings and stabilized within negative levels. If the price of gold falls below the above-mentioned $3040/oz area, the price of gold may fall sharply.
Support: $3086.70/oz; $3073.90/oz; $3061.10/oz
Resistance: $3123.10/oz; $3136.70/oz; $3150.00/oz

XAUUSD: Buy or Sell?Today's gold market can be said to have the largest intraday volatility since 2025! After experiencing violent fluctuations, the current trend of gold has once again become anxious.
However, from the perspective of range conversion, it is certain that gold is currently operating in a weak position, and after the brutal and violent fluctuations, the market also needs to recuperate. And there will be NFP tomorrow. It is expected that before NFP, it will be difficult for gold to form a new unilateral market again. So in the process of shock, I think both long and short sides have a certain profit space.
First of all, pay attention to the resistance of 3125-3135 area on the top. If gold touches this area during the shock process, we can still short gold;
And the first focus on the 3095-3085 area on the bottom is that if gold touches this area during the shock process, we can still consider going long on gold.
The trading strategy verification accuracy rate is more than 90%; one step ahead, exclusive access to trading strategies and real-time trading settings

XAU/USD 03 April 2025 Intraday AnalysisH4 Analysis:
-> Swing: Bullish.
-> Internal: Bullish.
Since last analysis price has continued extremely bullish. This is most likely due to market jitters caused by Trump's tariff policy which is driving up the price of gold.
This solidifies gold as a safe haven asset and could lead to repricing.
As mentioned in previous analysis that I will continue to monitor price.
Price has printed a bullish iBOS which is marked in red, this is due to the fact that the depth of the pullback has been shallow and has not pulled back into either discount of internal 50% EQ or mitigated a H4 demand zone.
As a result, price now is trading within an internal low and fractal high.
Intraday Expectation:
Await for price to print a bearish CHoCH to indicate bearish pullback phase initiation.
CHoCH positioning is denoted with a blue dotted line.
Note:
With the Federal Reserve's dovish stance and persisting geopolitical uncertainties, heightened volatility in Gold is expected to continue. Traders should proceed with caution and adjust risk management strategies in this high-volatility environment.
Price could also be driven by President Trump's policies, geopolitical moves and economic decisions which are sparking uncertainty.
H4 Chart:
M15 Analysis:
-> Swing: Bullish.
-> Internal: Bullish.
Analysis and bias remains the same as yesterday's analysis dated 01 April 2025
Since last analysis price has continued extremely bullish. This is most likely due to market jitters caused by the trump tariffs.
This solidifies gold as a safe haven asset and could lead to repricing.
You will note price has printed a bullish followed by a bearish CHoCH to indicate, but not confirm, bearish pullback phase initiation.
Whilst I am aware that price has not traded into discount of internal 50% or mitigated any demand zone, I will mark this as an iBOS due to time spent.
Intraday Expectation:
Price to trade down to either discount of 50% internal EQ or M15 demand zone before targeting weak internal high, priced at 3,167.835.
Alternative scenario:
As H4 appears to be in bearish pullback phase, although we do not currently have any indication, it would not come a surprise if price prints a bearish iBOS.
Note:
With the Federal Reserve maintaining a dovish stance and ongoing geopolitical tensions, volatility in Gold prices is expected to remain elevated. Traders should exercise caution, adjust risk management strategies, and stay prepared for potential price whipsaws in this high-volatility environment.
M15 Chart:

GOLD - Day Trading with RSI 04/03/2025FX:XAUUSD
Daily Timeframe (D1): Still in a strong uptrend, with RSI and both moving averages are pointing upwards. The WMA45 is above 60.
4-Hour Timeframe (H4): RSI is positioned between the resistance created by WMA45 (current price around 3152) and the RSI 60 support level (current price around 3121).
1-Hour Timeframe (H1): The WMA45 is trending upward, supporting the bullish trend.
Trading Plan: BUY
Entry Zone:
When the RSI on the M15 timeframe is supported at the 50 or 60 levels.
Entry Confirmation:
When M5 completes a wave, or a divergence appears.
Or even when M1 shows divergence.
Stop Loss:
20–30 pips below the M5 low.
Take Profit:
100 pips or R:R ≥ 1:1.
Or when M5 completes its own uptrend.
But be careful when RSI on H4 reaches its own WMA45.
You can check out the indicators I use here: tradingview.com/u/dangtunglam14/

GOLD XAUUSD – SNIPER PLAN 2 APRIL 2025👇
🦁 GOLD XAUUSD – SNIPER PLAN 2 APRIL 2025 📆
📍 Macro & Political Context
🗞️ Geopolitical Tension: Ongoing war in Ukraine + fresh tariff threats from Trump are sparking investor fear. Safe-haven flows into gold continue.
💰 Fundamentals: Inflationary fears remain strong. Market eyes the US NFP later this week. Fed is silent... too silent. 👀
🌍 Central banks are still buying gold – clear sign of institutional appetite.
🔍 Market Structure Overview
Trend: Bullish HTF ✅
Current Price: $3,113
All-Time High: $3,148 (Reached recently – likely liquidity swept!)
Last Valid BOS: H1 and H4 both show bullish structure, but a correction is brewing. 🍃
📊 Key Technical Zones & Confluences
🔻 Sell-Side Liquidity Below
📌 $3,100 – Clear liquidity pool (equal lows + psychological level)
🔥 Below $3,100 to $3,085 – Strong imbalance zone + unmitigated FVG
🧲 Expectation: Price may grab liquidity here before next leg up
🔷 Imbalance + Discount Zone
📉 $3,085–$3,095 – Massive H1/H4 imbalance. Could be a POI if price breaks $3,100
🧱 Valid Demand OB (H1) inside this zone + FIBO 61.8% retracement from last impulse
🔺 Premium Rejection
🧱 H1/H4 OB near $3,135–$3,145 = Price sharply rejected = probable redistribution zone
✂️ This was also the weekly high, which got swept = liquidity taken
🎯 Plan of Action
🟢 Scenario 1: Long Entry from Discount Zone
"Let them take the liquidity, we take the reversal!" 💸
Entry Zone: $3,085 – $3,095
Confluence:
Valid H1 OB (confirmed with PA)
Imbalance zone
FIBO 61.8% + structure break
Sell-side liquidity sweep from $3,100
Confirmation: M15 CHoCH + Bullish engulfing or low volume sweep
SL: Below $3,078
TP1: $3,130
TP2: $3,145
TP3: $3,150 (liquidity magnet again)
🔴 Scenario 2: Short if Price Pushes Back to $3,140+
Catch the premium short 🧨
Entry Zone: $3,140 – $3,148
Confluence:
All-time high sweep (liquidity trap)
HTF OB rejection
Weakness shown on M15
Confirmation: M5-M15 CHoCH + engulfing
SL: Above $3,155
TP1: $3,125
TP2: $3,100
TP3: $3,085
🧠 Final Notes
📌 Be reactive, not predictive – wait for PA confirmation at POIs
📰 Watch news – especially unexpected geopolitical catalysts or Fed surprise
🧘♂️ Stick to risk management. At ATHs, volatility is high and manipulation common.
👉 If this breakdown helped you, don’t forget to FOLLOW for more sniper setups and smash that ❤️ LIKE button to show some love!
Your support keeps this 🔥 content coming!

Monthly closing line, gold is alert to pull higher and fall backAt the end of March, the monthly and quarterly lines of gold and silver closed with saturated strong positive lines. The first trading day of the month has broken the high by inertia, which is consistent with expectations. Next, the focus should be on guarding against the potential scenario of pulling up shipments in the first half of the month, and the possibility of extreme volatility.
There are a lot of heavy news data from the 2nd to the 4th. I think there is a high probability that there will be an obvious turning point. However, given that the global political and economic situation has not cooled down significantly, even if there is a turning point and a correction, or even a sharp correction, it is still difficult to make a real judgment of a reversal of the big cycle trend. Therefore, I think the general idea of the short and medium-term line should be to maintain short first and then long.
The small resistance is around 3145--3155, and the important support during the week is around 3050. Given the recent volatility, it is obviously necessary to continue to be prepared to deal with continued large fluctuations.
The above strategy is based on current market analysis, and specific operations need to be combined with real-time data!

4.1 Analysis and Suggestions on Gold US Market Operation IdeasGold intraday interpretation
Gold failed to hit 3150 in the morning session. How will the subsequent market evolve?
It hit a high in the morning and then fell back to 3125-3130 to stop the decline and enter consolidation. If it fails to break through 3150 on Thursday, it will have a chance to enter a high-level adjustment, and the decline may reach 30-50 points!
Market sentiment has been brewing for a long enough time. Everyone should look at tariffs rationally. Even if there is no tax increase, there is no need to be too surprised.
Currently entering the triangle consolidation pattern, which is a type of relay pattern. The pattern is usually accompanied by a reduction in trading volume and resumes the original trend after breaking through.
Focus: 3150 key resistance. Don't chase north above 3140. If the intermediate form is used, the probability of breaking through 3150 during the day is not high. Mainly look at the ADP employment number on Wednesday. Beware of the US market retreating from 3113 to 3117 and then rebounding quickly.
Lower support: 3125 3113 3105
Upper pressure: 3150 3165

Monthly line saturated big positive line, gold and silver swordsYesterday, the gold market opened slightly higher at 3088 in the morning, and then fell back. The daily line reached a low of 3076.5, and then the market rose strongly. After breaking the 3100 integer mark, the daily line rose strongly. The daily line reached a high of 3128, and then the market consolidated widely. The daily line finally closed at 3123.8, and then the market closed with a long lower shadow. After this pattern ended, today's market still has technical bullish demand. In terms of points, after the breakout of 2940 and 2958, the stop loss followed up at 2990. Today, the stop loss of 3110 is 3105, and the target is 3128 and 3132. The breakout is 3140 and 3150-3152.
We will update regularly every day to introduce how we manage active ideas and settings. Thank you for your likes, comments and attention. Thank you very much
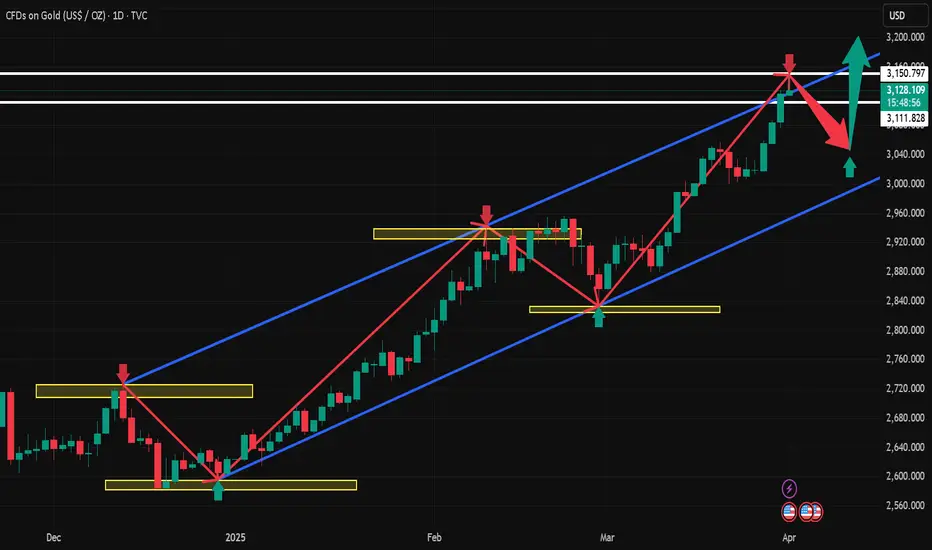
4.1 Analysis of gold intraday short-term trendFrom the daily chart, the gold price fell slightly after breaking through the previous high of $3127.76, but it is still in a strong upward channel overall. The current price has been stable above the 5-week moving average for many consecutive weeks, indicating that the medium-term trend is still healthy. It is worth noting that from the low of $2536.68 to date, gold has risen by more than 23%, and it is necessary to be vigilant about the risk of short-term adjustments. The next target will point to the psychological level of $3200. Factors supporting this view include rising global uncertainty, increased expectations of interest rate cuts by the Federal Reserve, and continued gold purchases by the central bank. In addition, the closing price needs to stabilize above $3135 to confirm the effectiveness of the long-term breakthrough. In this case, the price may accelerate upward, with a target of $3170.
Short-term resistance: 3130 3150 3170
The market is changing with the trend, and it is recommended to adjust the strategy in combination with real-time data!

4.1 Technical analysis of short-term gold trading BUYGold is currently temporarily maintaining a high range oscillation in the 4-hour level trend, but the short-term moving average continues to maintain a strong trend, and a wave of bottoming rebound in the 4-hour level trend has basically completed the repair of the technical pattern. Pay attention to the secondary pull-up trend after the high-level oscillation repair is completed. The hourly level trend is currently temporarily maintained in a high-level oscillation, but the strength and continuity of the US market's retracement are not particularly large. The technical pattern of the small-level cycle trend has also been gradually adjusted and completed, and it tends to be able to continue to rise in the late trading.
Intraday short-term operation:
BUY: 3110 Stop loss: 3005-3100 Target 3125-3130

3.31 Gold US market operation analysis suggestions!Gold intraday analysis and operation: How to judge the next step after gold breaks through 3130!
Gold's strong rise in the Asian session has brought the price of gold close to 3130 and finally stagnated at 3127. The impact of the US market has not yet appeared, but with the current trend, the volatility of gold tonight will not be too small. The overall idea is to maintain the low north. The intraday volatility range is maintained within the range of 40 points between 3090 and 3130. The current increase has exceeded market expectations. Although there is selling pressure, it is all suppressed by the bulls!
US market pressure focus: 3130-3150 above and 3110-3095 below
The above analysis is a personal analysis suggestion, I hope it can bring some gains to everyone!
We will update regularly every day and introduce to you how we manage active ideas and settings. Thank you for your likes, comments and attention, we are very grateful

XAUUSD Multi-Timeframe Plan + Daily Sniper Setup (W1 → M15)🟨 WEEKLY (W1)
✅ Bullish structure (HHs & HLs)
🔓 Broke ATH → price discovery mode
🎯 Targets: 3,120 / 3,180 / 3,250
🟩 Key demand: 2,985–2,950
📅 DAILY (D1)
🔼 Breakout above 3,049 confirmed
🕳️ FVG forming between 3,049–3,083
📈 No bearish signs while above 3,049
💡 EMA structure supports momentum
🕓 H4
✅ Clean breakout from consolidation
🟩 Demand zones:
3,049 (Flip zone)
3,000.65 (HTF OB)
📈 Trend in expansion phase
🕐 H1
📦 Broke range between 3,000–3,049
🔲 OB + liquidity grab confirmed support
🎯 Targeting 3,100 / 3,120
🕧 M30 & M15 (Precision Zones)
🔹 Entry 1: 3,083–3,085 (FVG + OB zone)
🔹 Entry 2: 3,073–3,076 (Unmitigated demand)
✅ Validate entries via M1/M5 CHoCH + bullish PA
🔫 DAILY SNIPER PLAN
✅ Buy Setup (High Probability)
Entry: 3,083–3,085 or 3,073–3,076
Trigger: M1–M5 CHoCH or bullish engulfing
SL: Below 3,070
TP1: 3,100
TP2: 3,120
TP3: 3,150
🔥 HTF trend + fresh liquidity = high-RR long opportunity.
🟥 Sell Setup (Countertrend Idea)
Entry: 3,118–3,121 (liquidity hunt zone)
Trigger: Bearish M5/M15 CHoCH + LQ sweep
SL: Above 3,125
TP1: 3,100
TP2: 3,085
TP3: 3,050
⚠️ Use only if price shows exhaustion + structure break.
✅ Recap:
Focus remains on buy-the-dip as long as price holds above 3,049.
Bearish setups = scalp/reversal only if smart money shifts short-term flow.

Gold weekly forcast with both Buy and sell levels 30-5-25Gold weekly forcast with both Buy and sell levels
gold in an uptrend all week from last weeks buy level it ran 553 pips wit little to no drawdown.
For this week we are looking at 2 levels for both buy and sell entries .
For a buy ill look at entering at 3091 expecting 3098 to 3100 as first resistance , if we brreak we can expect 3112 as next resistance on the way to 3136.
For a sell ill look at entering at 3076 expecting 3068 to 3066 as first support , if broke we can expect 3054 to 3050 as next support.
With these trades its best to just wait for levels for a conformation and the bigger moves.
last weeks buy are did not register until Thursday morning but when it hit there was no drawdown and closure at the high gave 533 pips.
As always with these trades wait for levels and secure on the way by either taking profit or reducing lot size.
Trade is based on support and resistance, trend lines and fibonacci levels from the higher time frame.
Ill update as the week progresses , stay safe

Summary of this weekThis week, the gold market continued its bull market, breaking through the historical high of 84 and closing. The gold price broke through the psychological barrier of 3,000. The market sentiment continued to be optimistic.
In this week's trading, we took the main approach of going long, holding long positions, buying back, and making significant profits, achieving the expected goals.
Next week, we will continue to make steady progress and formulate a more efficient profit plan.
If you also want to learn gold trading skills and profits in the market, then join my team.
Wish you all: Have a good weekend

Gold breaks new high again, the market waits for a pullback to gFundamentals: Gold hits a new record high today, and the market continues to hold a bullish view after the decline.
Gold is currently maintaining a relatively strong oscillating trend in the large-scale cycle trend, and the upward space in the large-scale cycle trend is likely to have not yet been completed. The daily level trend continues to maintain a relatively strong oscillating trend along the short-term moving average. The wave of decline before and after the European session has completed the repair of the technical form to a certain extent. The oscillating repair temporarily maintained at a high level in the hourly level trend currently has no particularly obvious trend. The range in the short-term trend may be compressed to the oscillating repair trend between 3060-85. Although there are some rebounds in the small-scale cycle trend, the strength and continuity are not too large. Pay attention to the short-term adjustment and repair.
Operation suggestions:
Short near 3080-7, stop loss 3085.2,
Long near 3059-60, stop loss 3053.1.
Real-time market intraday guidance.

XAU/USD 28 March 2025 Intraday AnalysisH4 Analysis:
-> Swing: Bullish.
-> Internal: Bullish.
Price has met expectations and analysis by printing a further bullish iBOS, however, pullback was minimal and with price not trading down to either discount of 50% EQ or Daily/H4 demand zone.
I will therefore, at present, not classify this as a bullish iBOS in order not to distort internal range
Intraday Expectation:
Price to print bearish CHoCH to indicate, bnut not confirm bearish pullback phase initiaiton. Price to then trade down to either discount of internal 50% EQ, or nested Daily and H4 demand levels before targeting weak internal high priced at 3,086.090.
Alternative scenario:
Price could potentially continue to print higher.
Note:
With the Federal Reserve's dovish stance and persisting geopolitical uncertainties, heightened volatility in Gold is expected to continue. Traders should proceed with caution and adjust risk management strategies in this high-volatility environment.
Price could also be driven by President Trump's policies, geopolitical moves and economic decisions which are sparking uncertainty.
H4 Chart:
M15 Analysis:
-> Swing: Bullish.
-> Internal: Bullish.
Analysis and bias was not met with pricing printing a bullish iBOS.
Price has printed a bearish CHoCH to indicate bearish pullback phase initiation.
Price is now trading within an established internal range. I will however continue to monitor price.
Intraday Expectation:
Price to trade down to either discount of internal 50% EQ or M15 demand zone before targeting weak internal high priced at 3,086.090.
Note:
With the Federal Reserve maintaining a dovish stance and ongoing geopolitical tensions, volatility in Gold prices is expected to remain elevated. Traders should exercise caution, adjust risk management strategies, and stay prepared for potential price whipsaws in this high-volatility environment.
M15 Chart:

3.28 Gold breaks new high again, holding on is the keyGold price hits a new record high of 3086, and today's low is the key
Gold price hits a new record high of 3086, which is in line with our bullish thinking of restarting strength since Tuesday
Now the price has also broken through the upper track of the green channel line. The next focus is on keeping low. Keeping low and breaking high will accelerate. Breaking the low point will easily return to sweeping
Today's low point defense position has two, the first is the early trading low of 3054, because it is a direct rise in the early trading to break the new high, and the afternoon continues to break the new high. In this case, it is particularly important to hold the early trading low ;
The second is the position along the green channel line, 3063-3061, which is also the position of the acceleration starting point
Then, next, hold the position along the green channel line, and switch upwards for at least 50-70 US dollars, corresponding to the resistance of the 3100-3115 area
The key point is to hold low, hold low and break high to see acceleration, and break the low point to turn to sweep
As shown in the figure, this wave of confirmed support began to rise, starting from breaking through the green dotted line suppression. After the breakthrough, repeatedly stepping back to confirm the 3015 upper and lower areas Support, then stand up and stabilize in the 3033-3030 area, and start an upward breakthrough
In the process, it is accompanied by a deep squat of 18-20 US dollars. After the leverage is completed, it will rise by more than 40 US dollars to break the new high
For the market that directly rose in the morning, there was a second sprint to break the high in the afternoon, so refer to 3068-3066 as support to continue to layout the bullish sprint to the 3080-3082 area
The price also accelerated the sprint and rose, and slightly exceeded the range of 3086
: Suppression line Under pressure, enter adjustment, squat 18-20 US dollars, confirm the support and continue to pull up more than 40 US dollars (what needs to be considered and verified at this moment)
For this pressure position, the focus is on the 3082-3085 area (now the excess range has reached 3086), using this as a suppression to find a space range of 18-20 US dollars, corresponding to the 3062-3060 range
The short position in the 3082 area fell to 3072-3070 as expected
Verify the conjecture step by step, time is the best verification tool!
Today is Friday, still the old rules, only provide information reminders for cooperative friends, if you need, you can find us, looking forward to the good news you have received!

Gold has tapped into the 3084-3094 premium rejection zone⚡ Market Overview:
Gold continues its bullish momentum, testing premium supply zones. Liquidity grabs and order flow shifts indicate potential reversals or continuation setups. Key imbalances and institutional levels are in focus.
🔴 Sell Setup (Short)
Entry Zone: $3,085 - $3,090
Stop Loss (SL): Above $3,097
Take Profit (TP) Levels:
TP1: $3,067 (First reaction level)
TP2: $3,050 (Liquidity sweep target)
TP3: $3,032 (Deeper profit zone)
📌 Reasoning:
Price has reached a premium supply area, with exhaustion signs at the highs.
Strong imbalance below $3,067 suggests potential retracement.
Confluence with 1H bearish rejection wicks.
🟢 Buy Setup (Long)
Entry Zone: $3,066 - $3,070
Stop Loss (SL): Below $3,060
Take Profit (TP) Levels:
TP1: $3,080 (First reaction level)
TP2: $3,089 (Supply imbalance zone)
TP3: $3,097 (Full retrace target)
📌 Reasoning:
Strong imbalance at $3,066, a level gold tends to respect.
Previous demand zone aligns with institutional orders.
Potential for liquidity grab and continuation if order flow remains bullish.
21 EMA confluence supports a bounce.
⚡ Execution Plan
Monitor price action at entry zones for confirmation (rejection wicks, engulfing candles).
Be cautious of high-impact news events that could create volatility.
Adjust SL & TP levels dynamically based on price behavior.
📌 Important Notice:
The above analysis is for educational purposes only and does not constitute financial advice. Always compare with your own plan and wait for confirmation before taking action.
Good luck on the market today.

Gold (XAU/USD) Technical Analysis and Surge Factors Current Price: Gold is trading around $3,074.31 per ounce, marking a significant rise of 0.6% and reaching a record high of $3,077.44.
Technical Analysis
Support and Resistance Levels:
Support: The psychological level at $3,000 has been a robust support, with prices consistently holding above this mark during recent consolidations.
Resistance: The new all-time high at $3,077.44 now serves as the immediate resistance level.
Moving Averages:
The 50-day Simple Moving Average (SMA) is trending upward, reinforcing the ongoing bullish momentum.
Relative Strength Index (RSI):
The RSI is approaching overbought territory, suggesting that while the bullish trend is strong, a short-term pullback could occur.
Key Factors Behind Today's Surge
U.S. Tariff Announcements:
President Donald Trump's recent implementation of a 25% tariff on auto imports has intensified fears of a global trade war. This uncertainty has driven investors towards safe-haven assets like gold.
Market Reactions:
The announcement led to a decline in Asian stock markets, with significant losses in South Korea and Japan. The auto industry, vital to these economies, faced substantial impacts, prompting investors to seek refuge in gold.
Analyst Forecasts:
Financial institutions have revised their gold price forecasts upwards. Citi Research increased its three-month gold price target to $3,200 per ounce, citing robust demand from official sectors and exchange-traded funds.
NOTE
Gold's ascent to record highs is primarily driven by escalating trade tensions and the resultant market uncertainty. Technical indicators support the bullish trend, though caution is warranted due to potential overbought conditions. Investors should monitor geopolitical developments and market reactions closely, as these will continue to influence gold's trajectory in the near term.
Stay Informed & Trade Wisely! 🛡️📈
