3.28 Gold Breaks Point, Falls Back to Support Long PositionsOn Thursday (March 27), affected by the news that US President Donald Trump announced new tariffs on imported cars, global trade tensions further escalated, market risk aversion heated up, and gold prices once again approached the record high set last week.
Fundamentals: Gold fell from its pre-US high. The decline supports the long position view.
The new US tariffs have exacerbated market tensions, and PCE data will become the next focus of attention.
The current market is active, and both long and short sides are engaged in fierce competition around key resistance levels. The dual drive of technical and fundamental factors has significantly amplified the volatility of gold prices.
The cumulative net inflow of gold ETFs in the first quarter of 2025 has reached 155 tons, and the total holdings have climbed to the peak since September 2023. In the previous trading day alone, the scale of a single-day increase of 23 tons set a record since 2022. The unexpected growth of central bank demand for gold purchases and the continued inflow of ETF funds together constitute the "two-wheel drive" for gold's medium- and long-term bullishness. If this trend continues, it will provide sufficient liquidity support for gold prices to break through historical highs.
The current price is close to the historical high, and some long profit-taking pressure is gradually accumulating. If the PCE data released on Friday is stronger than expected, or the Federal Reserve releases hawkish signals, it may become the fuse to trigger a pullback
Trend: shock upward trend
Support: around 3033.00
Resistance: around 3055.50
Goldintraday

3.27 Technical Analysis of Gold Short-term OperationsOn Thursday (March 27) in the Asian weekly session, the gold price (XAU/USD) was still consolidating around the $3,020 level, and the overall market sentiment was cautious.
Fundamental analysis:
US economy and Fed trends
Geopolitical and tariff uncertainties
Technical analysis:
Gold prices continued to consolidate at high levels after breaking through $3,000, and are still above the short-term moving average, with an overall bullish trend.
Moving average and trend: The moving average is in a bullish arrangement, indicating that the short-term and medium-term upward momentum has not been destroyed. The price fluctuates repeatedly between MA14 (3021) and MA200 (3017). If the market can stay above these two moving averages in the future, the upward momentum is expected to continue.
Key resistance and Fibonacci retracement: Fibonacci retracement 0.236 corresponds to around $3038, which also coincides with the high point formed in the previous period. If the price falls below the Fibonacci 0.618 position (about $3,000), we need to be alert to the risk of technical adjustments to find $3,000 or even deeper support.

3.26 Technical analysis suggestions for short-term gold operatioIn the early European trading on Wednesday (March 26), spot gold continued to rebound in the short term, and the current gold price is around $3027/ounce.
Gold technical analysis, how to operate in the evening? ——
The daily chart of gold shows that gold prices are rising above all bullish moving averages, while setting higher highs and higher lows. The 20-day simple moving average (SMA) has gained upward momentum and currently provides dynamic support around 2954.70. At the same time, after correcting the extreme overbought conditions, technical indicators resumed their upward trend within the positive level. From the 4-hour line, gold prices are fighting against the mildly bearish 20-period SMA, but are still well above the bullish 100-period SMA and 200-period SMA. At the same time, technical indicators are retreating from the midline and slightly lower within the neutral level. Overall, it is recommended to treat gold operations with a wide range of fluctuations today!
Gold operation strategy at night:
Short order strategy: short near 3031 above, stop loss 3040, target near 3010;
We will update regularly every day and introduce to you how we manage active ideas and settings. Thank you for your likes, comments and attention, we are very grateful

3.26 Technical analysis of short-term gold operationsGold is still supported by risk aversion, but it quickly fell back after rising. In fact, the support of safe-haven gold is not surprising. However, since the gold bulls did not continue, it means that the space for gold bulls is also limited. Gold rose and fell in the US market. Gold was directly short at 3032. Gold fell as expected. The US market rebounded high and was still short.
Gold's 1-hour moving average is still in a downward dead cross. Gold bulls cannot reverse the situation. Gold fell directly to 3035 in the US market under pressure.
Support level: 3018 3005 3000
We will update regularly every day and introduce to you how we manage active ideas and settings. Thank you for your likes, comments and attention, we are very grateful

3.25 Gold short-term operation technical analysis suggestionsOn Tuesday (March 25), the spot gold market showed a trend of consolidation under the interweaving of multiple factors.
Fundamental analysis: the game between policy expectations and risk sentiment
1. The expectation of the Fed's interest rate cut dominates the market sentiment
2. The suppression of risk aversion demand by risk events
3. Short-term disturbance of macroeconomic data
Technical analysis:
The current price fluctuates narrowly in the range of 3000-3033 US dollars. As the upper edge of the transaction concentration area in the past three months, 3000 US dollars has become a battleground for long and short positions. If the daily closing price effectively falls below this position, technical selling may push the price down to the support area of 2982-2978 US dollars, or even test 2956 US dollars (the support of the previous breakthrough position conversion). On the contrary, if the price stands at 3033 US dollars (overnight high), it is expected to challenge the historical high of 3057-3058 US dollars set last week, and a new round of upward space will be opened after the breakthrough.
Resistance: 25 30 40
Support: 18 08 3000

XAU/USD 25 March 2025 Intraday AnalysisH4 Analysis:
-> Swing: Bullish.
-> Internal: Bullish.
Bias and analysis remains the same as analysis dated 23 March 2025.
Price has printed a bearish CHoCH following printing further all time highs.
Price is now trading within an established internal range. I will however continue to monitor price.
Intraday Expectation:
Price to trade down to either discount of internal 50% EQ, or nested Daily and H4 demand levels before targeting weak internal high priced at 3,057.590.
Note:
With the Federal Reserve's dovish stance and persisting geopolitical uncertainties, heightened volatility in Gold is expected to continue. Traders should proceed with caution and adjust risk management strategies in this high-volatility environment.
Price could also be driven by President Trump's policies, geopolitical moves and economic decisions which are sparking uncertainty.
H4 Chart:
M15 Analysis:
-> Swing: Bullish.
-> Internal: Bearish.
Analysis and bias remains the same as yesterday's analysis dated 24 March 2025.
As per analysis dated 19 March 2025 whereby I mentioned as an alternative scenario that internal range has significantly narrowed. All HTF's require a pullback, therefore, it would be completely viable if price printed a bearish iBOS.
This is how price printed, by printing a bearish iBOS.
Price has yet to print a bullish CHoCH to indicate bullish pullback phase initiation, however, price has traded into premium of 50% internal EQ, therefore, I am happy to confirm internal range.
Intraday Expectation:
Price has traded in to premium of 50% EQ and has mitigated M15 supply zone.
Technically, price to target weak internal low priced at 2,999.465.
Note:
With the Federal Reserve maintaining a dovish stance and ongoing geopolitical tensions, volatility in Gold prices is expected to remain elevated. Traders should exercise caution, adjust risk management strategies, and stay prepared for potential price whipsaws in this high-volatility environment.
M15 Chart:

3.25 Gold short-term shock callbackGold's current strong trend in the large-scale cycle trend has changed. Pay attention to the support band around 2950 during the week. In the 4-hour level trend, the price rebounded and touched the previous pressure band and then began to fall back. The short-term moving average continued to diverge downward and continued to be weak in the short-term trend. The price began to slowly fall below the short-term terraced support band, tending to have a downward space in the short-term trend. The short-term trend began to show signs of stabilizing slightly after a wave of rapid declines. Pay attention to whether there will be a second downward trend after a small rebound and repair in the late trading. If it falls below 3000, look at 2990 85 below. Otherwise, look up 20-30

XAU/USD 24 March 2025 Intraday AnalysisH4 Analysis:
-> Swing: Bullish.
-> Internal: Bullish.
Bias and analysis remains the same as analysis dated 23 March 2025.
Price has printed a bearish CHoCH following printing further all time highs.
Price is now trading within an established internal range. I will however continue to monitor price.
Intraday Expectation:
Price to trade down to either discount of internal 50% EQ, or nested Daily and H4 demand levels before targeting weak internal high priced at 3,057.590.
Note:
With the Federal Reserve's dovish stance and persisting geopolitical uncertainties, heightened volatility in Gold is expected to continue. Traders should proceed with caution and adjust risk management strategies in this high-volatility environment.
Price could also be driven by President Trump's policies, geopolitical moves and economic decisions which are sparking uncertainty.
H4 Chart:
M15 Analysis:
-> Swing: Bullish.
-> Internal: Bearish.
As per analysis dated 19 March 2025 whereby I mentioned as an alternative scenario that internal range has significantly narrowed. All HTF's require a pullback, therefore, it would be completely viable if price printed a bearish iBOS.
This is how price printed, by printing a bearish iBOS.
Price has yet to print a bullish CHoCH to indicate bullish pullback phase initiation, however, price has traded into premium of 50% internal EQ, therefore, I am happy to confirm internal range.
Intraday Expectation:
Price has traded in to premium of 50% EQ and has mitigated M15 supply zone.
Technically, price to target weak internal low priced at 2,999.465.
Note:
With the Federal Reserve maintaining a dovish stance and ongoing geopolitical tensions, volatility in Gold prices is expected to remain elevated. Traders should exercise caution, adjust risk management strategies, and stay prepared for potential price whipsaws in this high-volatility environment.
M15 Chart:

GOLD ALERT | BIG DROP LOADING!🏦 Institutions Are Taking Profits – Are You Ready for the Next Move?
For the last 4 weeks, institutions have been reducing their long positions on #GOLD ( OANDA:XAUUSD ). This is exactly what I warned about – profit-taking from big players, signaling potential downside ahead.
technical down

3.24 Gold intraday operation ideasAfter last week's intense volatility, this week's market sentiment diverged significantly, with different categories performing differently. In addition, as the month is coming to an end, market risk appetite is reduced, so it is necessary to be cautious.
We still need to pay attention to economic data this week, because we need to observe the prospects for US economic development through data, and another thing is inflation, which the market and the Federal Reserve are concerned about.
Last Friday, the world's largest gold ETF added 20.08 tons of positions at one time, which was the eighth consecutive increase. This kind of continuity is relatively rare. In theory, it is a positive support for gold prices, but the increase and decrease of ETFs is more viewed from a medium- and long-term perspective.
The initial pressure on the intraday gold price is around $3,026, and the further pressure is around $3,035. The strong pressure or the long-short dividing point is at the high point of $3,040. The current rebound is slightly stronger, and it may be the first to continue the rebound.
The primary support below the day is around $3005. After breaking down, further support is at $2995. If the first retracement is near this level, you can intervene and buy. The rebound target price is around $3020. As for whether the rise can continue? It must stand firmly above $3040. Below this level, there is a risk of retracement at any time.
BUY: 3005 Stop loss: 2995
TP1:15
TP2:25
TP3:35
SELL:3040 Stop loss: 48
TP1:30
TP2:20

3.22 Gold Short-term Trend Analysis and SuggestionsTechnical analysis:
From the daily chart, technical indicators show signs of upward exhaustion and lose strength at extreme levels. At the same time, gold prices are holding above all bullish moving averages, with the 20-day simple moving average (SMA) providing dynamic pressure near 2941.70. From the 4-hour chart, the 100-period SMA and 200-period SMA continue to move higher, well below the above short-term moving averages. At the same time, the momentum indicator moves lower in the positive area but loses downward strength; while the relative strength index (RSI) corrects the overbought condition and then stabilizes near 61. Overall, Zhang Jinglin recommends wide fluctuations in gold operations today!
Short-term operation strategy:
SELL: Short near 3045 above, stop loss 3051, target near 3015, 3000.
We update regularly throughout the day and tell you how we manage active ideas and settings. Thank you for your likes, comments and attention, we are very grateful!

3.21 Gold peaking or rebounding?The three tracks of the 4-hour Bollinger Bands have shrunk severely, and the current range is compressed in the 3056-3012 range. As time goes by, the range will continue to shrink. The short-term support middle track and the MA30 moving average correspond to the 3034-3020 line. The 4-hour indicator macd has a high-level dead cross and runs with large volume. The dynamic indicator double lines are glued together and flat, indicating that there are signs of further decline in the 4-hour period. Pay attention to the suppression of the 3042-45 line in the short term.
The hourly macd dead cross is initially established, and the dynamic indicator sto is quickly repaired downward, indicating that the price shock is weak. At present, pay attention to the resistance of 3042-48 above.
In summary: Pay attention to the support of the 3025 line below during the day, and pay attention to the suppression of the 3057 line above. Combined with the shrinking of the 4-hour Bollinger Bands, the short-term price remains in the range of 3025-3053. The short-term resistance is at the 3042-45 line.
Resistance: $3,045; $3,079; $3,100; $3,108
Support: $3,018; $3,000; $2,974; $2,956

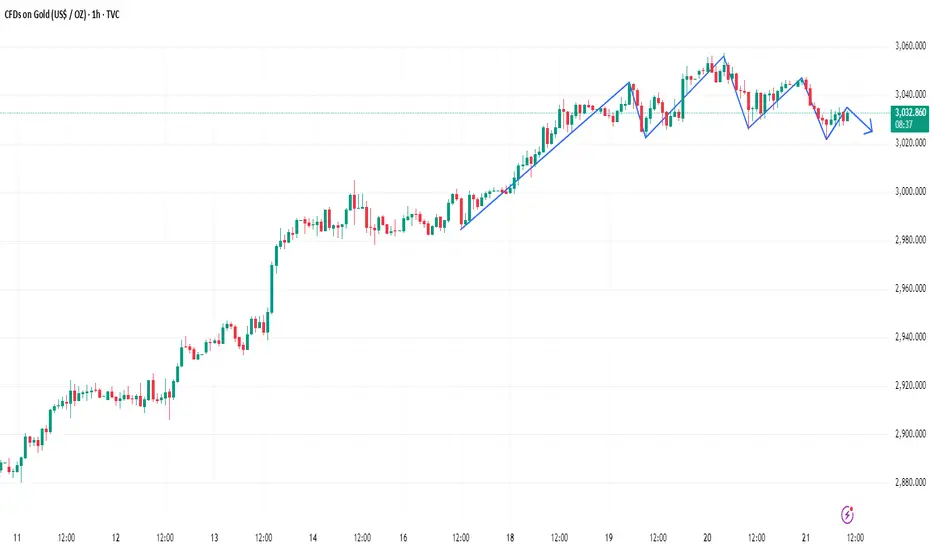
Can gold be shorted directly?The 1-hour moving average of gold has begun to turn slightly downward, and the strength of gold bulls has been suppressed. The 1-hour gold has now formed a head and shoulders pattern. If the strength of gold's rebound is limited, then the room for further decline of gold will increase.
Trading idea: short gold around 3032, stop loss 3042, target 3022
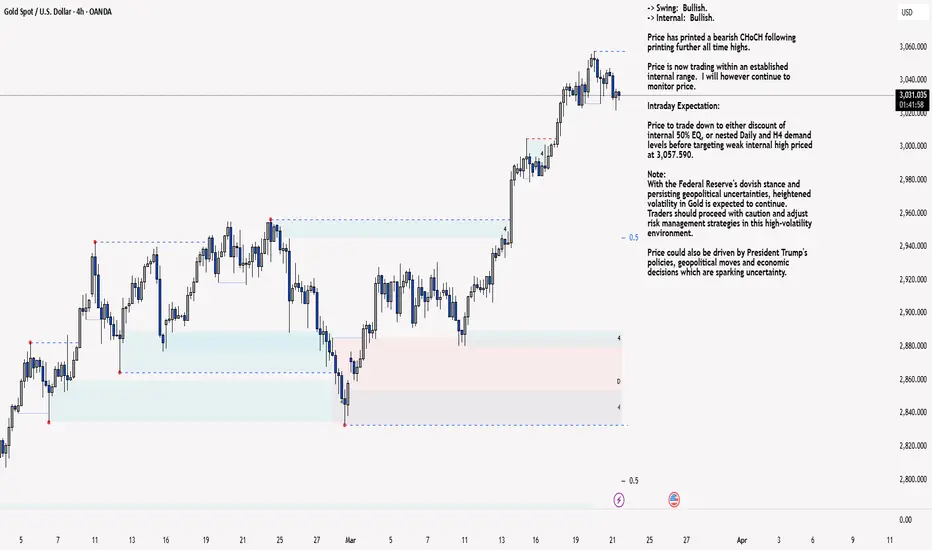
XAU/USD 21 March 2025 Intraday AnalysisH4 Analysis:
-> Swing: Bullish.
-> Internal: Bullish.
Price has printed a bearish CHoCH following printing further all time highs.
Price is now trading within an established internal range. I will however continue to monitor price.
Intraday Expectation:
Price to trade down to either discount of internal 50% EQ, or nested Daily and H4 demand levels before targeting weak internal high priced at 3,057.590.
Note:
With the Federal Reserve's dovish stance and persisting geopolitical uncertainties, heightened volatility in Gold is expected to continue. Traders should proceed with caution and adjust risk management strategies in this high-volatility environment.
Price could also be driven by President Trump's policies, geopolitical moves and economic decisions which are sparking uncertainty.
H4 Chart:
M15 Analysis:
-> Swing: Bullish.
-> Internal: Bullish.
You will note how price has mitigated M15 demand zones at the extreme of strong internal low. The remainder of my analysis and bias remains the same as analysis dated 19 March 2025.
Price has continued to surge to new all time highs, largely fuelled by geopolitical tensions, gold is solidifying itself as a safe haven asset.
Price has printed a further bullish iBOS followed by a bearish CHoCH to confirm internal structure.
Intraday Expectation:
Price has mitigated M15 demand zone. Technically price should target weak internal high priced at 3,057.590.
Alternative scenario:
You will note internal range has significantly narrowed. All HTF's require a pullback, therefore, it would be completely viable if price printed a bearish iBOS.
Note:
With the Federal Reserve maintaining a dovish stance and ongoing geopolitical tensions, volatility in Gold prices is expected to remain elevated. Traders should exercise caution, adjust risk management strategies, and stay prepared for potential price whipsaws in this high-volatility environment.
M15 Chart:
MCX Gold intraday trend forecast for March 21, 2025I have a bearish outlook for the day. The first phase is bearish and then a pull back is likely to take place. This is my mathematically derived outcome. Use your technical analysis and trade with Stop-Loss.

GOLD (XAU/USD) H1 Trading Plan📉 GOLD (XAU/USD) H1 Trading Plan 📉
🔹 Wait for Sell-Side Liquidity Break! 🏦💧
Gold is currently testing key liquidity zones. Before entering a trade, we must wait for a sell-side liquidity grab (sweep of lows). Once liquidity is taken, shift to a lower time frame (M5/M15) for confirmation before executing a position.
✅ Trading Steps:
1️⃣ Identify sell-side liquidity zones (equal lows, swing lows).
2️⃣ Wait for a break below liquidity to confirm stop-hunt.
3️⃣ Look for bullish confirmation on LTF (Break of Structure, order block, or engulfing candle).
4️⃣ Enter with tight stop-loss & proper risk management.

3.21 Gold Short-term Analysis and Operation SuggestionsGold hit a record high on Thursday (March 20) after the Federal Reserve hinted that it might cut interest rates twice this year, further enhancing the attractiveness of gold amid the current geopolitical and economic tensions. As of press time, spot gold was basically stable near $3,030, having hit a record high of $3,057.21.
——Gold Technical Analysis
From the daily chart, the volume indicator is firmly aiming higher, supporting another wave of gains, while the relative strength index (RSI) is stable near 72. At the same time, the price of gold is trading above all its moving averages, with the 20-day simple moving average (SMA) providing dynamic support near 2,936. From the 4-hour chart, technical indicators have eased from extreme levels, but are far from indicating an imminent downtrend. In addition, the 20-period SMA continues to rise steadily, currently around 3,011, while well above the longer-term moving average. Overall, Zhang Jinglin recommends rebounding and shorting as the main operation of gold today!
Gold short-term operation strategy:
SELL: 45 Stop loss 55
TP1:35
TP2:25
TP3:10

3.20 Technical Analysis of Gold Short-term OperationsOn Wednesday, gold maintained a bullish trend! In yesterday's trading:
1: Following the trend principle, the support is stuck at 3020, but the amplitude of the retracement is not given to the retracement near 3020, the lowest is the range of 3022-3025.
2: For short orders, avoid short orders directly; because there is no price reference for short orders, no indicator reference for short orders, therefore, avoid all of them;
3: In terms of trend, at the current stage, the bullish trend is still continuing, therefore, do not catch the top, do not think about catching a large-scale short order, it is not realistic for the time being!
In today's market:
1: 4 hours, the stochastic indicator is in a golden cross state, the main long signal; MACD double lines are glued together, and the state of passivation divergence! These signals suggest that the market is mainly controlled by bulls during the day, and it is difficult to fall sharply for the time being; in terms of form, the continuous positive rise and the broken positive oscillation form, the short-term support position is near 3040; the high point is unknown;
2: In the daily K, the stochastic indicator continues to form a golden cross, which is a bullish signal; in terms of form, the continuous positive rise is the main trend, and the short-term support position today is near 3040;
To sum up: today's short-term trend thinking; the support positions are near 3040, near 3020; near 3000, followed by around 2990; near the support, the trend thinking;

XAU/USD 20 March 2025 Intraday AnalysisH4 Analysis:
-> Swing: Bullish.
-> Internal: Bullish.
Price has very nearly printed a bearish CHoCH following printing further all time highs.
CHoCH positioning is very near current price.
Remainder of my analysis remains the same as yesterday's analysis dated 19 March 2025
Price has printed a bullish iBOS, however, I will apply discretion and not classify as a bullish iBOS due to very insignificant pullback which would distort internal range. Therefore, I have marked the iBOS in red.
Intraday Expectation:
Await for price to indicate pullback phase initiation by printing bearish CHoCH. ChOCH positioning is denoted with a blue dotted line.
Note:
With the Federal Reserve's dovish stance and persisting geopolitical uncertainties, heightened volatility in Gold is expected to continue. Traders should proceed with caution and adjust risk management strategies in this high-volatility environment.
Price could also be driven by President Trump's policies, geopolitical tensions and economic decisions which are sparking uncertainty.
H4 Chart:
M15 Analysis:
-> Swing: Bullish.
-> Internal: Bullish.
Again, since yesterday's analysis, price has continued to surge to new all time highs, largely fuelled by geopolitical tensions. Gold is solidifying itself as a safe haven asset.
Price has printed a further bullish iBOS followed by a bearish CHoCH to confirm internal structure.
Intraday Expectation:
Price has mitigated M15 demand zone. Technically price should target weak internal high priced at 3,057.590.
Alternative scenario:
You will note internal range has significantly narrowed. All HTF's require a pullback, therefore, it would be completely viable if price printed a bearish iBOS.
Note:
With the Federal Reserve maintaining a dovish stance and ongoing geopolitical tensions, volatility in Gold prices is expected to remain elevated. Traders should exercise caution, adjust risk management strategies, and stay prepared for potential price whipsaws in this high-volatility environment.
M15 Chart:

3.20 Focus on the long and short battle of the Federal Reserve!!On Wednesday (March 19), the spot gold price continued to fluctuate at a high level during the Asian and European sessions, hitting a record high of $3,045/ounce during the session, and then fell slightly to around $3,029. The market focus is highly concentrated on the upcoming Fed's March interest rate decision.
Fundamentals: 1. The struggle between risk aversion demand and policy expectations
2. Rising geopolitical risk premiums
3. Trump's tariff remarks sparked concerns about economic recession
4. Fed policy expectations dominate short-term fluctuations
Technical aspects: Long and short game in high-level fluctuations
4-hour structure chart:
Bollinger Band pattern: upper track 3044.86, middle track 3031.24, lower track 3017.63, the current quote 3030.49 is close to the middle track, indicating a short-term balance of long and short forces. If the price stands firm on the middle track, it is expected to test the upper track (3044) again; if it falls below the middle track, it may seek support from the lower track (3017)
Moving average support: The 100-day moving average (2928.75) and the 200-day moving average (2903.27) form a long-term support band, and the price difference with the current quotation exceeds US$100, further verifying that gold is in a strong cycle.
Resistance level: 3050 3080 3100
Support level: 3018 3000 2980

XAU/USD 19 March 2025 Intraday Analysis H4 Analysis:
-> Swing: Bullish.
-> Internal: Bullish.
Price has now printed a bearish CHoCH confirming internal range, however, I will continue to monitor.
Intraday Expectation:
Price to trade down to either discount of internal 50% EQ or nested Daily and H4 demand zones before targeting weak internal high priced at 3,045.310.
Note:
With the Federal Reserve's dovish stance and persisting geopolitical uncertainties, heightened volatility in Gold is expected to continue. Traders should proceed with caution and adjust risk management strategies in this high-volatility environment.
Price could also be driven by President Trump's policies, geopolitical moves and economic decisions which are sparking uncertainty.
H4 Chart:
M15 Analysis:
-> Swing: Bullish.
-> Internal: Bullish.
Again, since yesterday's analysis, price has continued to surge to new all time highs, largely fuelled by geopolitical tensions. Gold is solidifying itself as a safe haven asset.
Price has printed a further bullish iBOS followed by a bearish CHoCH to confirm internal structure.
Intraday Expectation:
Price has traded down to discount of 50% internal EQ and nearly mitigated M15 demand zone. Technically price should target weak internal high priced at 3,045.410.
Alternative scenario:
You will note internal range has significantly narrowed. All HTF's require a pullback, therefore, it would be completely viable if price printed a bearish iBOS.
Note:
With the Federal Reserve maintaining a dovish stance and ongoing geopolitical tensions, volatility in Gold prices is expected to remain elevated. Traders should exercise caution, adjust risk management strategies, and stay prepared for potential price whipsaws in this high-volatility environment.
M15 Chart:

3.19 Gold continues to peak, waiting for the Fed's interest rateThe gold market continued to rise strongly after opening yesterday, reaching the highest point of 3038 and then consolidating at a high level, with no obvious adjustment in the middle. Although we determined that the market would surge, it was still stronger than expected. The daily line finally closed with a big positive line with a slight shadow line. After this pattern ended, the bulls in today's market are still there.
Resistance level: 3045 3050

On 3.19, gold continued to fluctuate upward after breaking throuAs a safe-haven asset, gold has attracted more buying amid global political tensions: the escalation of the conflict in the Middle East and the continued strikes by the United States against the Houthi armed forces in the Red Sea region may affect the energy supply chain. The uncertainty of the ceasefire negotiations between Russia and Ukraine has led to a high risk aversion in the market. The increase in domestic political risks in the United States may affect market confidence and push up gold demand.
The rise in gold on March 18 is in line with my thinking. Obviously, the US market was suppressed at 3028. After a short-term retracement, it further broke upward. It is expected to continue the upward trend at night and see the suppression of 3044.
The weekly and monthly lines are concerned about the upper track position, and even diverge upward under the impetus of market sentiment. The specific position cannot be determined because there is no reference point, but it is only necessary to follow the market trend to do it, and the transaction is relatively simple. From a technical perspective, the upper track of the weekly line is 3030, and the upper track of the monthly line is 3050. This is the position that needs attention. In addition, the previous two waves of rises have gone through 4 positive monthly K lines, and then closed with a negative correction.
Support level
$2994; $2982; $2950
Resistance level
$3025; $3050; $3080
