Analysis of technical prospects for gold prices!Market news:
In the early Asian session on Monday (July 28), spot gold bottomed out and rebounded. At the beginning of the session, it continued the decline of last Friday to around 3320. As the United States and Europe reached a trade agreement, the international demand for gold hedging further declined. However, the price of gold was supported by bargain hunting and quickly recovered most of the decline. It is currently trading around 3337 US dollars per ounce. As the global reserve currency, the trend of the US dollar is crucial to the price of gold. Last week, the US dollar index rebounded from a low of more than two weeks, significantly pushing up the cost of gold for overseas buyers. The progress of US-EU trade negotiations has become another major driver of the recent decline in London gold prices. Although the demand for hedging has been suppressed in the short term, geopolitical uncertainty still provides long-term support for gold. At the same time, the trend of global central banks buying gold provides a solid bottom support for gold.Looking ahead to this week, the economic calendar will provide several high-impact data releases. The Federal Reserve will announce its monetary policy decision after the policy meeting on July 29-30. On Friday, the US Bureau of Labor Statistics will release the July employment report. If the number of non-farm payrolls (NFP) increases by more than 100,000, it may indicate that the labor market is in good enough condition that the Fed can prioritize controlling inflation and supporting the dollar when making policies. If the new non-farm payrolls data reaches or falls below 70,000, the dollar may find it difficult to find demand before the end of next week and help gold gain bullish momentum.
Technical analysis:
Technically, the gold daily chart forms a continuous negative structure, and the New York closing price re-loses the key support of the MA10-day moving average at 3360 and the middle track of the Bollinger Band. The RSI indicator breaks through the middle axis and runs in a short-term ... Pay attention to the rebound repair after selling low opening at the beginning of the gold week. The main idea is to sell at a high price and buy at a low price as an auxiliary.
Today's analysis:
Gold rebounded after opening low in the Asian session. Gold continued to refresh the low point. Then gold was obviously still in a selling trend. Since gold is still in a selling trend, it will continue to sell to the end. Gold rebounded in the Asian session and continued to sell. Gold continued to sell under pressure in the Asian session. Gold waited patiently for 3350 to continue selling in the Asian session. Gold's 1-hour moving average continued to cross downward and arranged for selling. There was basically no obvious rebound in this round of gold's decline. Then gold was likely to continue the short selling trend after the rebound correction. The wave structure of gold's current decline remained intact. Gold continued to sell under pressure near the last low of 3350.
Operation ideas:
Buy short-term gold at 3309-3312, stop loss at 3300, target at 3340-3360;
Sell short-term gold at 3350-3353, stop loss at 3362, target at 3320-3300;
Key points:
First support level: 3320, second support level: 3306, third support level: 3292
First resistance level: 3346, second resistance level: 3358, third resistance level: 3467
Goldinvesting

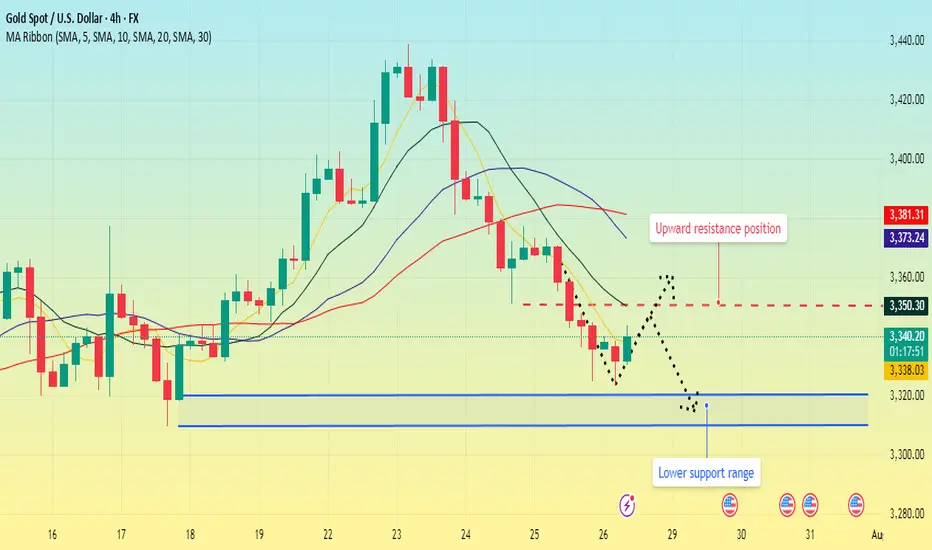
The US and Europe reached an agreement. Gold rebounded.At the current node, the EU and the US reached a tariff cooperation, 15% tariff + 600 billion US dollars for investment in the United States. The additional tariffs are considered a big deal, and the US has become the winner again this time.
Of course, this is a small negative for the current gold market.
From a multi-period analysis, the monthly chart price is still in a reverse K state. For the current situation, we need to pay attention to the gains and losses of the monthly highs and lows. The weekly chart shows that the price has continued to fluctuate at a high level recently. As time goes by, the weekly watershed is temporarily at 3320. After last week's high and fall, there is currently a further downward performance.
The four-hour chart shows that the price has continued to be suppressed after breaking through the four-hour support last Wednesday. The four-hour level resistance is currently around 3355, and the resistance level has moved up compared with the early Asian market. Therefore, we will pay attention to the pressure at this position in the future. If it fails to break through for a long time, it is likely to fall directly under pressure; pay attention to the support range of 3320-3310 below.
XAU/USD(20250728) Today's AnalysisMarket news:
Trump announced that the US and Europe reached a trade agreement: 15% tariffs on the EU, $600 billion in investment in the US, zero tariffs on the US by EU countries, the EU will purchase US military equipment, and will purchase US energy products worth $750 billion. However, the US and Europe have different statements on whether the 15% tariff agreement covers medicines and steel and aluminum. Von der Leyen: The 15% tariff rate is the best result that the European Commission can achieve.
US Secretary of Commerce: The deadline for tariff increases on August 1 will not be extended. The United States will determine the tariff policy on chips within two weeks.
Technical analysis:
Today's buying and selling boundaries:
3345
Support and resistance levels:
3393
3375
3363
3326
3315
3297
Trading strategy:
If the price breaks through 3345, consider buying in, the first target price is 3363
If the price breaks through 3326, consider selling in, the first target price is 3315

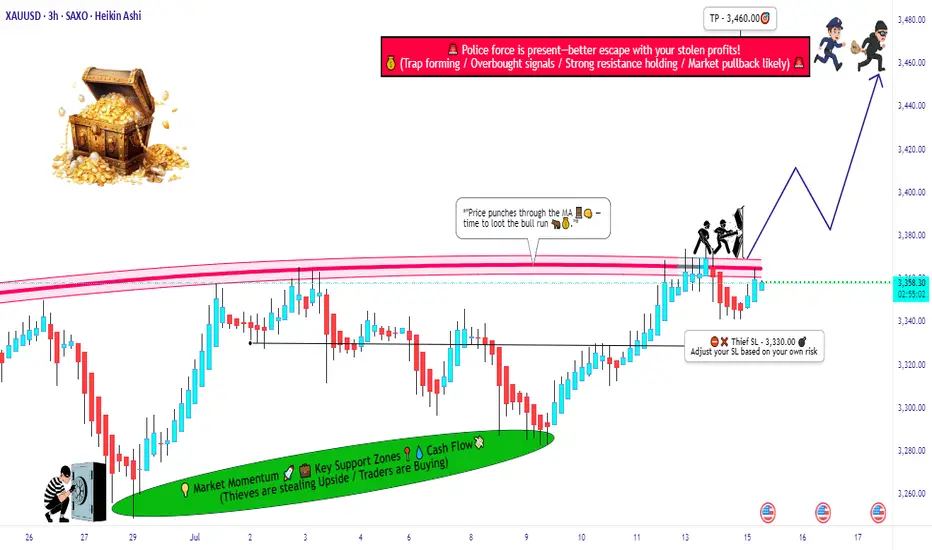
GOLD (XAU/USD) MA Breakout – High-Probability Long Setup!💰🚨 GOLD HEIST ALERT! XAU/USD MASTER PLAN (Thief Trading Style) 🎯
🔥 Steal Pips Like a Pro – High-Probability Gold Breakout Strategy! 🔥
🎯 Thief Trading’s GOLD Heist Strategy (Swing/Day Trade) �💸
👋 Hey there, Market Pirates & Profit Snatchers! 🌍✨
Based on our 🔥Thief Trading Style🔥 analysis, we’re plotting a major heist on XAU/USD (GOLD). The plan? Buy the breakout, escape before the cops (resistance) arrive! 🚔💨
📈 ENTRY ZONE: The Heist Begins!
🚀 "Wait for the MA Breakout (3400) – Then Strike!"
Bullish Confirmation: Enter on a 15M/30M pullback after MA breakout.
Thief’s Trick: Use Buy Stop above MA or Buy Limit near swing lows for best risk-reward.
DCA/Layering Strategy: Deploy multiple limit orders to maximize gains.
🔔 Set an ALERT! Don’t miss the breakout – thieves move fast! ⏳
🛑 STOP LOSS: Protect Your Loot!
📍 Thief’s SL Placement: 3330.00 (4H Swing Low) – Adjust based on your risk & lot size.
⚠️ WARNING: If using Buy Stop, DO NOT set SL until after breakout – unless you love unnecessary losses! 🔥
🎯 TARGET: Escape with the Gold!
🏴☠️ Take Profit Zone: 3460.00 (or Exit Early if Bears Show Up!)
Scalpers: Only trade LONG side – use trailing SL to lock in profits.
Swing Traders: Ride the wave but watch for resistance traps!
📰 MARKET CONTEXT: Why This Heist?
Neutral Trend (But Bullish Potential! 🐂)
Key Factors: Geopolitics, COT Data, Macro Trends, Sentiment Shift
🚨 News Alert: Avoid new trades during high-impact news – trailing SL saves profits!
💥 BOOST THIS HEIST! (Like & Share for More Pips!)
💖 Hit the 👍 Boost Button to strengthen our Thief Trading Crew!
🚀 More Heist Plans Coming Soon – Stay Tuned!
⚠️ DISCLAIMER (Stay Safe, Thieves!)
This is NOT financial advice. Do your own analysis & manage risk.
Markets change fast! Adapt or get caught.
🎯 Happy Trading, Pirates! Let’s Steal Some Gold! 🏴☠️💛
Analysis of gold price trend next week!Market news:
This week, international gold recorded its biggest weekly decline in a month. Spot gold turned sharply lower after a sharp rise and finally closed lower. Signs of progress in US-EU trade negotiations hit the safe-haven demand for London gold prices. Geopolitical situation is also a factor in the downward trend of gold prices. On the 25th local time, Tahir Noonu, a senior Hamas official, said that Hamas was absolutely positive about the efforts of the relevant mediators, but was surprised by the US statement. Before the United States and the European Union made progress in trade negotiations, fund managers raised their bullish bets on gold to the highest level since April this year. The trade war has pushed gold prices up 27% this year. Although the easing of trade tensions will weaken safe-haven demand, gold has also been supported by strong buying from central banks.Next week, international gold prices will focus on US-EU and US-China trade negotiations. If the negotiations are optimistic, gold prices may continue to test the $3,300/ounce mark; in addition, focus on the Federal Reserve's resolution. After Trump's visit to the Federal Reserve headquarters, whether the Federal Reserve will maintain its independence will be highlighted in this resolution. Non-agricultural data will also be released on Friday, which needs attention.
Technical Review:
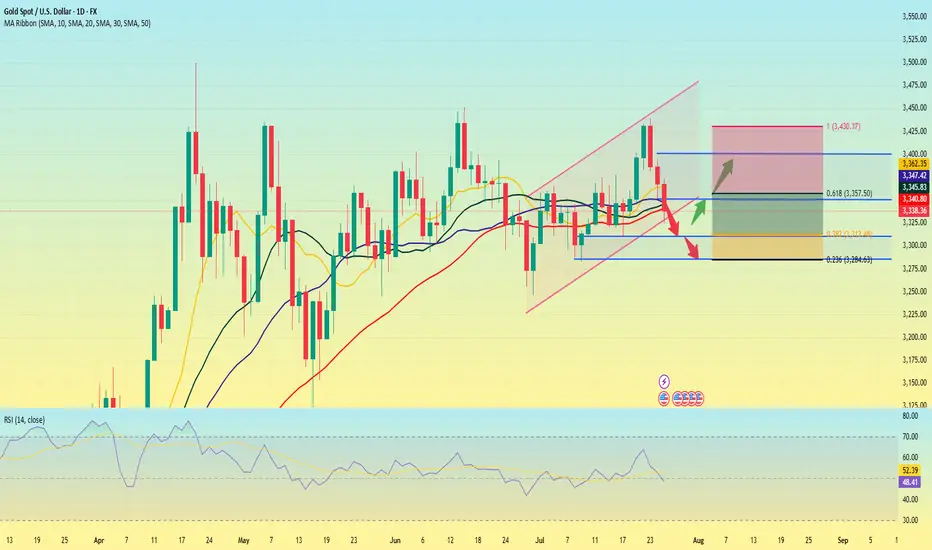
From the weekly gold level, gold is still in a wide range of 3500-3120. It has been fluctuating for ten weeks. The Bollinger Bands are gradually shrinking. MA5 and MA10 are running horizontally, indicating that gold fluctuations will continue. This time, gold stabilized and rose from 3247 to 3438 and then fell back. The current short-term range is 3247-3438! Next week, pay attention to the range of fluctuations and choose a new direction after the narrowing. The daily level is currently in the 4th wave adjustment. There is a high probability that there will be a 5th wave rise after the adjustment, and then a large-scale ABC adjustment will be started. At present, there are two changes in the structure of the 4th wave, one is the triangle contraction and the other is the ABC structure. No matter how it runs, the market outlook is to wait for low-level long positions to see the 5th wave rise. In the short term, gold is still oscillating and selling.
Next week's analysis:
Gold is still adjusting, but it has basically adjusted in place. The current daily price has also adjusted to the key support level of 3300. Similarly, the four-hour chart just stepped back to the upward trend line support, which is the short-term long order entry. Buy above the 3300 mark next week! Next week, gold is expected to further test the 3310-3280 support level. Gold at the 4-hour level peaked at 3438 and then fell back. It has now formed a unilateral trend. The K-line is under pressure from the 5-day moving average and continues to set new lows, and breaks the short-term upward trend line. The Bollinger band opens downward and diverges, and the MACD water cross diverges downward to underwater, indicating that the current gold trend is in an absolute weak position! Next, gold will continue to test the support near the previous low of 3300. If 3300 is not broken, gold buying will continue to have momentum. If 3300 is broken, the short-term rise will end, and the subsequent rebound will basically be just a correction. However, the current 4-hour green column shows signs of shrinking volume, so it is not easy to sell at a low level. Try to sell after the rebound correction, or buy at a low level!
Operation ideas:
Short-term gold 3305-3308 buy, stop loss 3297, target 3350-3370;
Short-term gold 3350-3353 sell, stop loss 3362, target 3320-3300;
Key points:
First support level: 3320, second support level: 3309, third support level: 3300
First resistance level: 3346, second resistance level: 3360, third resistance level: 3375

Gold is weak. Will it explode next week?Gold prices failed to stabilize above $3,400 after a bullish breakout this week. The technical outlook highlights the recent indecision of gold bulls.
In the first two trading days of this week, spot gold prices rose by 2.4%, but the cumulative decline in the last three trading days of this week reached nearly 3%. The sharp fluctuations this week were due to the positive progress in Trump's trade negotiations, and the rebound in market risk appetite, which hit the safe-haven demand for gold.
Looking at next week, the economic calendar will provide several high-impact data releases. The Federal Reserve will announce its monetary policy decision after the policy meeting on July 29-30; the US Bureau of Labor Statistics will release the July employment report; and some important news such as the US-China trade negotiations may trigger the next major move for gold.
From a technical perspective, the current market short-term technical outlook highlights the hesitation of gold buyers. The daily chart shows that the RSI is still slightly below 50, and gold prices have difficulty staying away from the 20-day and 50-day MAs after breaking through these two levels earlier this week.
On the upside, 3450 constitutes the first resistance for gold prices. If it breaks through this resistance, gold prices will most likely hit the 3400 integer mark again.
On the downside, if gold prices remain below 3340, technical sellers may still be interested. In this case, 3310 can serve as the first support level, followed by the second support level near 3285.
A new week is about to begin, and I wish all traders good luck.
XAU/USD 25 July 2025 Intraday AnalysisH4 Analysis:
-> Swing: Bullish.
-> Internal: Bullish.
You will note that price has targeted weak internal high on three separate occasions which has now formed a triple top, this is a bearish reversal pattern and proving this zone is a strong supply level. This is in-line with HTF bearish pullback phase.
Remainder of analysis and bias remains the same as analysis dated 23 April 2025.
Price has now printed a bearish CHoCH according to my analysis yesterday.
Price is now trading within an established internal range.
Intraday Expectation:
Price to trade down to either discount of internal 50% EQ, or H4 demand zone before targeting weak internal high priced at 3,500.200.
Note:
The Federal Reserve’s sustained dovish stance, coupled with ongoing geopolitical uncertainties, is likely to prolong heightened volatility in the gold market. Given this elevated risk environment, traders should exercise caution and recalibrate risk management strategies to navigate potential price fluctuations effectively.
Additionally, gold pricing remains sensitive to broader macroeconomic developments, including policy decisions under President Trump. Shifts in geopolitical strategy and economic directives could further amplify uncertainty, contributing to market repricing dynamics.
H4 Chart:
M15 Analysis:
-> Swing: Bullish.
-> Internal: Bullish.
H4 Timeframe - Price has failed to target weak internal high, therefore, it would not be unrealistic if price printed a bearish iBOS.
The remainder of my analysis shall remain the same as analysis dated 13 June 2025, apart from target price.
As per my analysis dated 22 May 2025 whereby I mentioned price can be seen to be reacting at discount of 50% EQ on H4 timeframe, therefore, it is a viable alternative that price could potentially print a bullish iBOS on M15 timeframe despite internal structure being bearish.
Price has printed a bullish iBOS followed by a bearish CHoCH, which indicates, but does not confirm, bearish pullback phase initiation. I will however continue to monitor, with respect to depth of pullback.
Intraday Expectation:
Price to continue bearish, react at either M15 supply zone, or discount of 50% internal EQ before targeting weak internal high priced at 3,451.375.
Note:
Gold remains highly volatile amid the Federal Reserve's continued dovish stance, persistent and escalating geopolitical uncertainties. Traders should implement robust risk management strategies and remain vigilant, as price swings may become more pronounced in this elevated volatility environment.
Additionally, President Trump’s recent tariff announcements are expected to further amplify market turbulence, potentially triggering sharp price fluctuations and whipsaws.
M15 Chart:

Gold Bounces Back After Testing Key Support📊 Market Drivers
• Gold dropped to around $3,352, touching a key support zone, then quickly rebounded to $3,373, gaining over +20 points.
• The rebound is supported by continued weakness in the US Dollar and slight easing in Treasury yields, keeping gold attractive as a safe haven.
• Although some optimism around US-Japan trade negotiations slightly reduced risk aversion, it wasn’t enough to push gold below support.
📉 Technical Analysis
• Key Resistance:
o $3,397 – $3,400: psychological resistance and near the next bullish breakout zone.
o If breached, next target lies around $3,420–3,445.
• Nearest Support:
o $3,356 – $3,364: recently confirmed support zone that triggered the current rebound.
o Deeper support at $3,326 – $3,320 if the rebound fails.
• EMA (EMA50):
o Price remains above the 50-period EMA, indicating bullish momentum in the short term.
• Patterns & Momentum:
o Market structure shows a "rising low" pattern — a bullish signal that buyers are stepping in at higher levels.
o RSI was briefly in oversold territory and now supports a recovery bounce.
o If $3,356 holds, the upside targets remain valid toward $3,397 → $3,439.
📌 Assessment
• Gold has confirmed strong support at $3,356–3,364, with the rebound from $3,352 as proof.
• Short-term uptrend remains intact, unless the USD strengthens sharply or unexpected macro news hits.
• If gold breaks below $3,356, it may retrace toward $3,326–3,320, but the upside potential is currently favored.
💡 Suggested Trade Setups
BUY XAU/USD: $3,356–3,364
🎯 Take Profit: 40/80/200 pips
❌ Stop Loss: $3,346
SELL XAU/USD: $3,397–3,400
🎯 Take Profit: 40/80/200 pips
❌ Stop Loss: $3,407

XAU/USD(20250725) Today's AnalysisMarket news:
The European Central Bank announced that it would maintain the three key interest rates unchanged, reiterated data dependence, warned that the external environment is highly uncertain, and President Lagarde did not rule out the possibility of future rate hikes. Traders reduced their bets on ECB rate cuts.
Technical analysis:
Today's buying and selling boundaries:
3370
Support and resistance levels
3412
3397
3386
3355
3344
3329
Trading strategy:
If the price breaks through 3370, consider buying in, with the first target price of 3386
If the price breaks through 3355, consider selling in, with the first target price of 3344

Today's US market focus is 3350
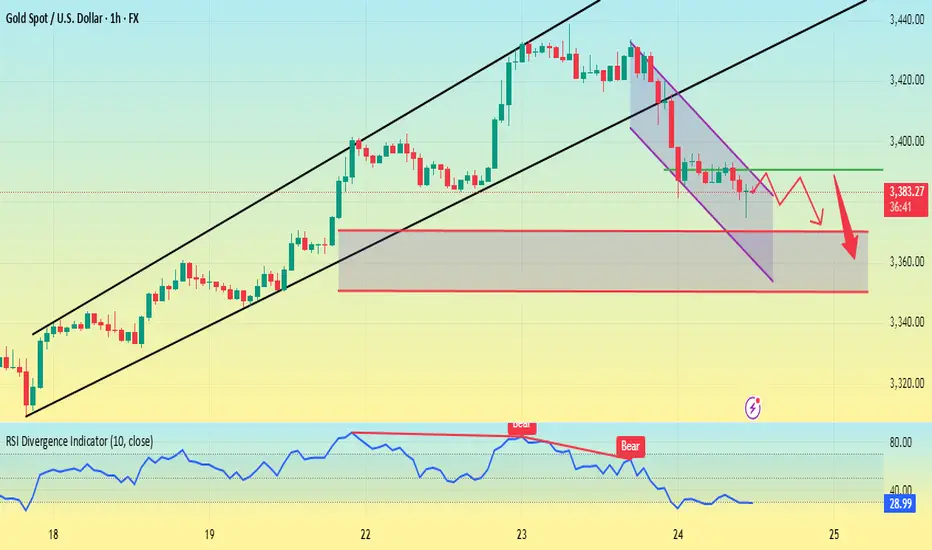
Gold prices continued their decline from the previous session on Thursday, July 24, slipping further below the 3,400 mark as trade tensions eased and risk sentiment rose. Gold's decline today means a second consecutive day of decline as investors turned their attention to more positive trade progress since yesterday. However, gold still received buying support earlier this week, breaking through $3,400 at one point. This round of gains tested key resistance levels on the gold daily chart, but in the end the bears held their ground.
Risk data interpretation!
Investors are currently waiting for U.S. Purchasing Managers Index (PMI) data for new trading instructions. If any PMI index falls below 50.0, indicating a contraction in economic activity in related industries, the dollar may face pressure and help gold prices rise.
The market will also pay close attention to developments surrounding the ongoing discord between U.S. President Trump and Federal Reserve Chairman Powell. The White House announced Trump's schedule, and Trump will visit the Federal Reserve at 4 p.m. Eastern Time on Thursday.
Views on the trend of gold!
The trend of gold is directly reversed from that of Monday and Tuesday this week. At the beginning of this week, gold rose slowly and continuously without giving a chance to retrace, while today it retreated continuously and did not give a rebound. Does it look familiar? The trend is bearish and I want to short but I can't do it. In fact, we are still bullish in the morning today, and the watershed is actually at the 3375 line. After the frequent breakouts in the European session, it means that the current bulls are suppressed again.
And the K-line on the hourly line is more obvious. There is no positive line in the continuous negative retracement, so the weakness will continue. After all, the Asian session is weak today, and the European session is also continuously weak. The current market has reached the 3363 line, which is actually not far from our second support of 3350. So the US session needs to focus on this position. If the US session can hold, there is still hope for a rebound. Otherwise, it will fall continuously today!
Gold: Long around 3350, defend 3340, and target the 3385-93 line

Gold’s Wild Ride: A Trader’s Take on What’s NextHey Fellow Traders! 👋
Gold’s been an absolute beast this week, smashing through both buyers and sellers like it’s playing a high-stakes game of market whack-a-mole! 😅 After Wednesday’s wild moves and today’s follow-up, Gold’s keeping us all guessing.
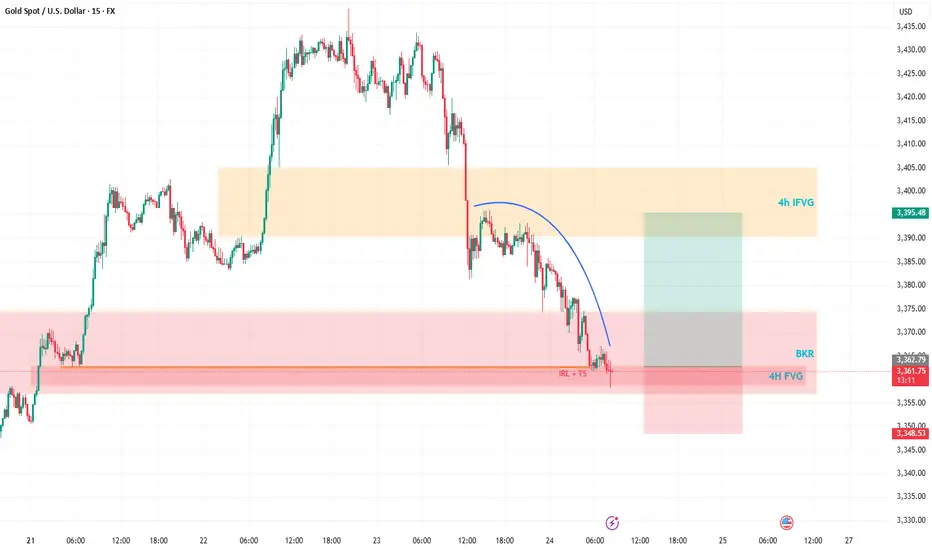
Right now, I’m not locking in a long-term bias—Gold’s too unpredictable for that. But here’s the exciting part: I’m eyeing a short-term long opportunity. Why? The price just dipped into a 4H Fair Value Gap (FVG) and tagged a Breaker, setting up a potential bounce. 📈
My plan? I’m expecting Gold to sweep up the highlighted liquidity and charge toward the 4H Inversion Fair Value Gap (IFVG). Once it hits that zone, I’ll be glued to the charts, watching for its reaction to decide the next move. 🧐
As always, trade smart! Set your stops, size your positions wisely, and don’t let Gold’s volatility catch you off guard. Protect your capital first—always! 💡
What’s your take on Gold right now? Are you jumping on this setup or waiting for more confirmation? Drop your thoughts in the comments below, give this post a like, and follow for more updates! 👇 Let’s keep the trading convo going! 🔥
Gold Pulls Back to Support Zone📊 Market Overview:
• Gold price fell sharply to $3,385/oz, after previously testing the $3,430 zone.
• Short-term profit-taking and anticipation of upcoming U.S. economic data (PMI, durable goods orders) caused a mild USD rebound, pressuring gold lower.
• Overall sentiment remains cautious as the Fed has yet to clearly signal a rate cut path.
📉 Technical Analysis:
• Key Resistance: $3,430 – $3,445
• Nearest Support: $3,382 – $3,368
• EMA 09: Price just broke below the 9 EMA, suggesting a potential deeper correction unless it rebounds quickly.
• Candlestick/Volume/Momentum: Bearish engulfing candle with rising volume – indicates strong selling pressure and momentum currently favoring the bears.
📌 Outlook:
Gold is undergoing a short-term correction, currently testing the strong technical support zone at $3,382 – $3,385. If this zone holds, we may see a rebound toward $3,410 – $3,420. If it fails, gold could slide further toward $3,368 – $3,350.
💡 Suggested Trade Strategies:
🔻 SELL XAU/USD at: 3,395 – 3,400
🎯 TP: 3,375
❌ SL: 3,405

Gold------sell near 3392, target 3370-3350Gold market analysis:
Yesterday, gold in the European and American markets plunged directly. It is cold at high places. Gold has already experienced four big plunges above 3435. From the perspective of form, there is a super pressure there. We also reminded in the analysis yesterday that the rhythm of gold daily lines in the past two days has changed very quickly, and it is all shocks and then quickly pulls up and ends directly. It is basically difficult to follow its rhythm without direct pursuit. The big negative line of the daily line has destroyed the strong support near 3402-3404. This position has been converted into a new strong pressure. Today's idea is to adjust the bearish trend and continue to sell on the rebound. The adjustment of the daily line is not sure whether it is an adjustment of the wave structure, but it can be determined to sell in the short term. We are just a trend follower. Today, gold will not rebound above 3402 and is basically weak.
Gold plunged directly in the Asian session, and the selling force is still relatively strong. At present, the new low strong support of the daily line has not appeared. The next moving average support of the daily line is around 3366. I estimate that there will be a rebound at this position. If the hourly Asian session does not fall and rebounds first, consider continuing to sell it at 3395 and 3402. Gold likes to convert quickly recently. If it stands on 3404, it will be reconsidered.
Support 3374, 3366 and 3350, suppress 3395 and 3402, and the weak watershed before the market is 3395.
Fundamental analysis:
Tariffs have not affected the market recently, and there is no major news released. The market is relatively calm.
Operation suggestion:
Gold------sell near 3392, target 3370-3350

Gold prices plunge in the short term!Market news:
In the early Asian session on Thursday (July 24), spot gold fluctuated in a narrow range and is currently trading around $3,388 per ounce. International gold suffered a fierce sell-off after a sharp rise in the previous two trading days. Media reports said that the United States and the European Union were getting closer to reaching a tariff agreement, and the news hit safe-haven demand. The decline in London gold prices was mainly due to the dual pressure of easing macro-geopolitical tensions and the recovery of risk appetite.Although the Federal Reserve is expected to keep interest rates unchanged, the controversy surrounding the independence of the Federal Reserve is heating up. According to a recent Reuters survey, most economists believe that the Federal Reserve is currently facing unprecedented political pressure, which provides potential medium- and long-term support for gold. However, in the short term, as the resilience of US economic data emerges and market risk sentiment improves, investors are cautious about the Federal Reserve's expectations of a sharp interest rate cut this year, and gold has lost the momentum to further attack.The current market focuses on the progress of trade negotiations between major economies in the world and the upcoming Federal Reserve interest rate meeting. Against the backdrop of the implementation of the US-EU and US-Japan agreements, the short-term safe-haven properties of gold may continue to weaken. In addition, this trading day will usher in the July PMI data of European and American countries, the change in the number of initial jobless claims in the United States, the annualized total number of new home sales in the United States in June, and the interest rate decision of the European Central Bank!
Technical Review:
Affected by Trump's speech, the United States reached an agreement with more trading partners, and the market risk aversion cooled down. Gold plunged sharply to a new low of 3381 in the late trading. The technical daily structure closed with a single negative line, ending the strong form of the continuous positive structure. However, the daily MA10/7-day moving average still maintained a golden cross opening upward, moving up to 3378/67. The price is currently adjusted at the 5-day moving average of 3390, and the RSI indicator is running above the middle axis. The price is in the upper and middle track of the Bollinger band.
The short-term four-hour chart retreated to the middle track of the Bollinger band at 3380 and stopped falling, and the RSI indicator adjusted its middle axis. The moving average high at 3410 opened downward in a dead cross, and the short-term gold price fell into a wide range of shocks. Today's trading strategy is to sell at high prices and buy at low prices. The strategy layout is based on fluctuations. Let's look at the 3366/3416 range first.
Today's analysis:
Yesterday, gold fell straight in the European and American trading hours, with a drop of more than 50 US dollars. The main reason is the impact of European and American tariffs. Last night, the European and American trade negotiations determined a 15% tariff. The market's risk aversion sentiment subsided, causing the gold price to fall. The gold daily line finally closed with a big negative line, and the gold daily line was covered with dark clouds! The rebound during the day is mainly sold at high prices!The high level of the gold 1-hour moving average has begun to turn around. The buying power of gold has obviously suffered a heavy blow under the influence of the news. The short-term high level of gold 1 has also formed a head and shoulders top structure. As long as the gold rebound does not break through 3400, the right shoulder of gold will be completed. Then gold will complete the short-term top structure of the head and shoulders top in the short term, and gold selling will begin to work.
Operation ideas:
Short-term gold 3366-3369 buy, stop loss 3358, target 3390-3410;
Short-term gold 3400-3403 sell, stop loss 3412, target 3380-3360;
Key points:
First support level: 3380, second support level: 3367, third support level: 3353
First resistance level: 3403, second resistance level: 3410, third resistance level: 3420

Gold peaked in the short term. Welcome a new trend?The previous rising structure of gold was broken, especially yesterday's rapid decline broke through the previous support of 3385. Although it rebounded slightly, it was difficult to change the adjustment. Yesterday's high point of the US market was at 3396-98 US dollars. Today, the adjustment trend continued. The dividing point between long and short is 3395 US dollars today. Before the price reaches here, do not consider long.
Many traders are confused. Why are there longs one day and shorts the next day? In fact, this is the characteristic of the volatile market. Breaking the key position cannot last. No matter what you think about the market, you must pay attention to the current shape changes. In the volatile market, you should consider the market of the day more, not the long-term direction.
From the 1-hour chart, the gold price rebounded near 3390 and shorted, and the profit range is 3370-3350.
The backup strategy is to break through 3400 and go long, and pay attention to 3415-3425 on the upside.
In other words, look for opportunities to short on a rebound below 3400 today, and adjust your thinking after breaking through the key resistance.
Gold is weak. Will it continue to fall?Yesterday, the price of gold did not continue to rise as strong as in the previous two days. After reaching the previous top position, it began to retreat under pressure.
The market is too bullish, and under this pattern, the market is likely to have an unexpected reversal. Yesterday, it fell below the 3400 integer mark, so it is likely to maintain a volatile downward trend in the future.
The current main support level is around 3370, which is also the primary point for the bears to continue to break down in the future. Once it falls below this position, the target may be around 3345-3355. It cannot be said that it has completely turned to a bearish position at the moment. It is just a bearish oscillation pattern within a large range, and the upper pressure is maintained near 3405, which is also the support point for the first downward step of the bears on Wednesday.
Today, we still need to operate around the short position first. The price rebounds to 3405 and shorts, and the profit range is around 3390-3380, and the stop loss is 3415.
After a new low appears in the European session, wait for the US session to rebound and continue shorting.

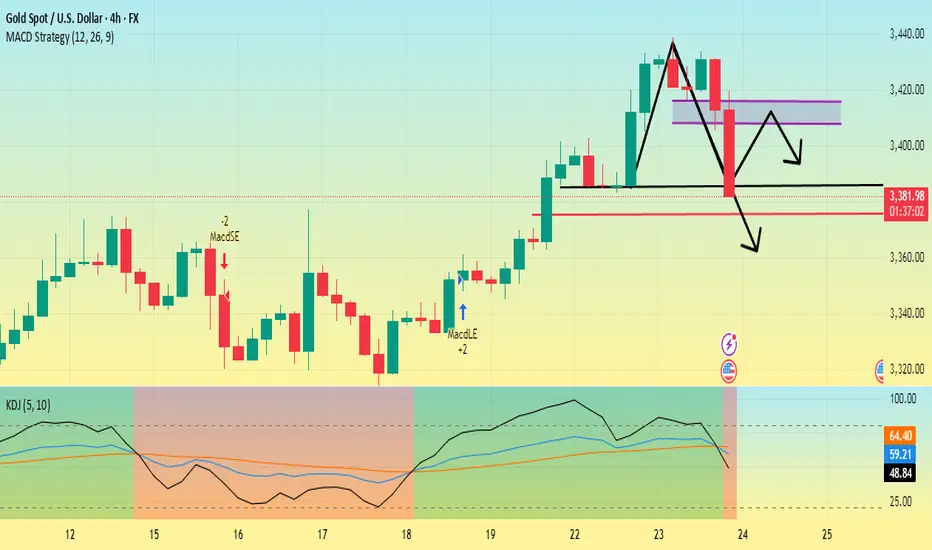
Gold is going down. Can it break through?First, we can look at the daily chart,Currently, the support below the gold daily chart is around 3385, which is also the low point on Tuesday. The current price drop has already touched the support near 3385.
Secondly, from the 4-hour chart, the low point of yesterday's US market retracement was around 3405, and the high point on Monday was 3400. So the first pressure point of this price correction is 3400-3410, followed by the suppression position near 3420.
The 4-hour chart shows that the gold price fluctuated in the 3410-3440 range in the early stage, the MACD red column shortened, and the KDJ dead cross began to appear, facing the pressure of correction in the short term.
At present, the main focus is on whether the 3385 support line can be broken. If it falls below this support level, it will most likely touch around 3375. Then gold will most likely start a downward trend and the rebound will be weak.
Gold is bullish and bearish. Will it continue?From the daily chart:
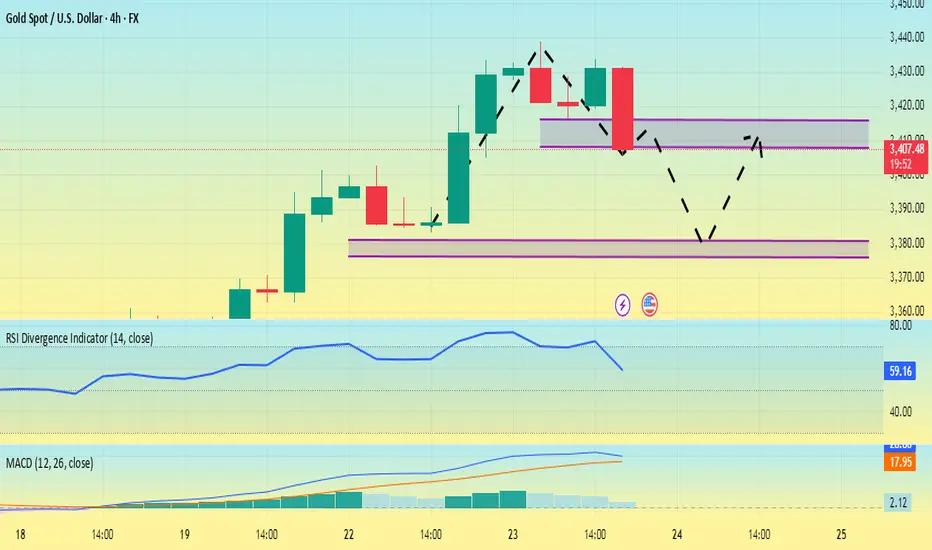
The moving average is bullish, and the MA5-day, 10-day, and 30-day moving average supports move up. The 3380 dollar has turned from resistance to strong support. If this position is maintained, the upward channel will continue. The support position is 3380-3375, which is the top and bottom conversion position, and is also near the middle track of the Bollinger Band.
From the four-hour chart, the MACD red column shrinks and the RSI is near 60, and the bulls are still dominant. If the price falls back to the 3375-3380 area and stabilizes, it is expected to attack the 3400 mark again.
Operation strategy:
Long operation:
Steady type: When the gold price falls back to the 3375-3380 area, long orders are arranged in batches, with a stop loss of 3365 and a profit range of 3400-3410.
Aggressive: If the price breaks through 3400 quickly and falls back to around 3395, you can chase long with a light position, stop loss at 3388, and the profit range is 3420 strong resistance area.
Short operation:
Resistance area test short: 3408-3415 area, light position short order, stop loss at 3422, profit range 3390-3380.
Break short: If it falls below the 3375 support and the rebound is weak, follow up with short short, profit range 3360, stop loss 3385.
The real target of gold is more than 3400
💡Message Strategy
The United States has recently made frequent moves in global tariff policies. Treasury Secretary Bensont has clearly set August 1 as a hard deadline for tariff negotiations among countries. At present, EU trade negotiations have been decoupled from the issue of sanctions against Russia and Ukraine, while Japan's negotiations are progressing smoothly.
These dynamics reflect that the United States is reshaping the global trade pattern through differentiated strategies, and countries are forced to adjust their economic and trade policies under the pressure of tariffs. As the deadline approaches, gold is facing a test of long and short positions.
The White House's pressure on the Federal Reserve is still fermenting. The US Treasury Secretary said that the Federal Reserve should cut interest rates now, but at the same time said that there is no sign that Powell should resign now. If he wants to leave early, he should do so. Powell gave a public speech yesterday, but to the disappointment of the market, he did not mention monetary policy and the possibility of resignation. However, Trump's pressure on the Federal Reserve has taken effect, and the market has turned its attention to interest rate cuts.
📊Technical aspects
Yesterday, Tuesday, we believed that the trade negotiations between Europe and the United States were on the verge of breaking down, which led to a rise in risk aversion in the market, boosted gold safe-haven buying, and supported the price of gold to a one-month high.
Therefore, we suggest that you take a bullish approach in terms of operation. Pay attention to the support below at $3,380, and pay attention to the breakthrough of $3,402 above. As expected, it broke through to $3,440, reaching our expected profit target.
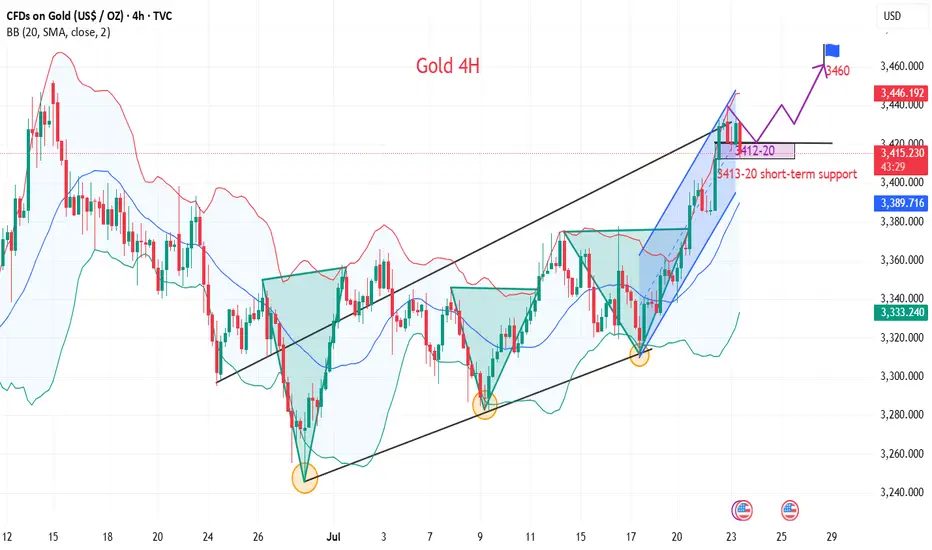
From the 4H trend structure, gold has been climbing rapidly along the upward channel recently. It broke through yesterday and took the 3400 mark in one fell swoop, reaching our expected target of 3440. At present, gold is blocked and falls back on the channel boundary support.
At the same time, the 1-hour RSI broke through the upward trend line support and tested the resistance again, releasing a callback signal in the short term. It is necessary to pay attention to the possibility of short-term adjustments. Today, we can focus on the key resistance around 3415 and try long opportunities.
💰Strategy Package
Long Position:3410-3420,SL:3390,Target: 3440,3460
Gold Likely to Rise as USD Weakens📊 Market Overview
Spot gold (XAU/USD) is trading around $3,423–$3,427/oz, down ~0.2% after news of a US–Japan trade deal boosted risk sentiment. However, a weaker USD and lower US bond yields continue to support safe-haven demand.
📉 Technical Analysis
• Resistance: $3,447 – $3,464 – $3,496
• Support: $3,399 – $3,367
• EMA9: Price is below EMA9 → short-term bearish; medium-term outlook remains bullish if price reclaims EMA20.
• Momentum indicators: RSI ~69; MACD & ADX favor buyers.
📌 Outlook
Gold may move sideways or edge higher if USD weakness persists. A rise in risk appetite (e.g. from trade deals) could pressure prices short term.
💡 Suggested Trading Strategy
🔻 SELL XAU/USD: $3,442–$3,445
🎯 TP: 40/80/200 pips | ❌ SL: $3,449
🔺 BUY XAU/USD: $3,402–$3,405
🎯 TP: 40/80/200 pips | ❌ SL: $3,399

Gold bulls are on the offensive. Can they continue to chase?On Tuesday, as trade tensions and the conflict between the White House and the Federal Reserve continued, the US dollar index continued to fall, and continued to fall in the early US trading, once hitting a low of 97.28. Gold also continued to rise, once standing above the $3,430 mark, setting a new high in more than a month. From the current point of view of gold, this week has stood firm at two levels, 3,350 and 3,400. Next, it depends on whether it can continue to stand firm at the 3,450 level.
From the current hourly chart, Monday's high is around 3,400, and yesterday's low of the US market retracement on Tuesday was around 3,405. So theoretically, 3,400-3,405 has become a support position. And from the hourly chart range, the bottom trend line support is also about 3,400-3,405. Therefore, it is not ruled out that it will oscillate and retrace like yesterday, and then rise and stretch again.
Secondly, from the daily chart:
After gold stabilized at 3400, the current daily range has become 3400-3450. As we can see above, there have been three times of falling back after touching 3450. If it breaks and stabilizes above 3450 this time, the historical high of 3500 will most likely be refreshed. On the contrary, if it still cannot break through 3500 this time, the possibility of further pullback cannot be ruled out. For the next operation, I suggest paying attention to 3400-3405.
If it can retreat and stabilize at 3400-3405 during the European session, you can continue to enter the market and go long to around 3450. On the contrary, if it falls below 3400 today, then don't go long, as there may be a possibility of further retreat in the future.

XAUUSD: Fluctuation of $30/ounce. Do you want to know?Yesterday, I frantically notified followers to buy around 3366-3375, and the market finally rose to 3430. This is a huge profit. I will continue to update it in the Band Trading Center Research Institute later. If you don’t want to miss it, follow me. If you see it but are still not sure how to trade. Then you can leave me a message at the Swing Trading Center Research Institute. I will reply to you one by one when I see it.
This week, some followers have achieved weekly profits of 50%-268%. If your profit is not ideal. Or don’t know how to trade. Remember to like and follow. I will lead everyone to victory.
Buy around 3400-3410. When will it close? I will post the results on the Swing Trading Center. Stay tuned.

XAUUSD:3450-3500The probability of the same direction of the two histories is 95% similar. This shows one thing. The market may repeat history again.
So buy with me. The next target is 3450-3500
