How to seize this golden short-term opportunity!Yesterday, gold continued to fall from its highs, and the short-term trend was in line with our expectations. The lowest price of gold yesterday hit around 3285, which was also the long area given in yesterday's analysis. In addition, the secondary layout of long orders in yesterday's analysis brought us good returns.
At present, gold is in a rebound stage as a whole. Although the momentum and amplitude of the rebound have not increased significantly, this trend has shown signs of a gradual recovery in the market. In terms of short-term operations, it is recommended to follow the trend and wait for the price to fall back before choosing an opportunity to go long. Yesterday, the gold price fell again to around the 3285 mark and received effective support. Today, we still need to focus on the support performance of this area.
From the perspective of the 4-hour cycle, today's gold price relies on this area as a short-term strength and weakness dividing line for long and short layout. The lower support focuses on the 3275-3283 range, and the upper pressure is around 3316-3320. The short-term key watershed is around 3275-3280. As long as the daily level does not effectively fall below this area, the overall judgment of the long and short shock range is still maintained. In terms of operation, the "high-altitude and low-multiple" rotation idea will continue to be the main focus. If the market situation or rhythm changes, the strategy will be adjusted in time according to the actual market situation and will be notified separately.
Gold operation strategy reference:
1. If gold falls back to the 3275-3285 area, you can consider placing long orders, with the target at 3316-3320.
2. If gold rebounds to the 3316-3321 area, you can try to short with a light position, with the target at 3288-3290.
Goldking

3278-3320 key position is mainly high sell low buyAt present, gold rebounded after falling back to 3287, and fluctuated around 3300 in the short term. Pay attention to the support area of 3278-3283 below. If it does not break this area, you can still try to go long in the short term. After all, from a technical point of view, the decline during the day is a correction and adjustment to the previous rise.
From the 4-hour chart, the upper short-term focus is on the suppression of the 3316-3320 area, and the lower focus is on the support of 3278-3283. In terms of operation ideas, continue to maintain the interval strategy of "high-altitude and low-multiple", rely on key positions to sell high and buy low, and wait patiently for effective signals before entering the market. If the structure or rhythm of the market changes, the strategy will be adjusted in time and notified separately.

Gold hits around 3280, please go long in the short term
📌 Driving Events
Gold prices fell more than 0.50% on Monday as demand for safe-haven assets decreased after U.S. President Donald Trump announced a postponement of tariffs on the European Union. Trading activity remained subdued as the U.S. and UK markets were closed for public holidays. As of this writing, the gold/dollar exchange rate was around $3,294. Trump issued a statement on Sunday, postponing the date of the 50% tariff on EU goods to July 9, and market sentiment improved. As a result, gold prices came under pressure and fell after a sharp rise of 4.86% last week (the strongest weekly performance since early April)
📊Commentary Analysis
Focus on the support level of 3285/80. If this area is touched for the first time, go long
💰Strategy Package
🔥Selling area: 3345-3350 SL 3355
TP1: $3333
TP2: $3325
TP3: $3308
🔥Buying area: $3280-$3285 SL $3275
TP1: $3312
TP2: $3330
TP3: $3345
⭐️ Note: Labaron hopes that traders can properly manage their funds
- Choose a lot size that matches your funds
- Profit is 4-7% of the fund account
- Stop loss is 1-3% of the fund account
How will the short-term trend of gold develop?From a technical perspective, the overall volatility is limited. In the near future, the upper side is under pressure from the trend line, and the lower side is affected by the 4-hour middle track support. The overall trend is maintained in the range of 3365-3322. The current monthly line is approaching its closing, and the short-term market is temporarily in a high-level oscillation stage. In the 4-hour cycle, the price range is gradually narrowing, waiting for a directional breakthrough. The lower support focuses on the 3325-3320 middle track position and the previous top and bottom conversion support of the 3308 line; the upper pressure focuses on the 3352 and 3365 areas. After a slight high opening, it weakened. The overall idea is still to treat it as a wide range of fluctuations. It is recommended to be long and short in operation, and adjust the strategy after breaking through.
Operation suggestion: Go long near 3330-3323, and the target is 3340 and 3352;
If the pressure near 3352 is not broken, consider shorting, and the target is to fall back to the 3330 line.

Short term is still dominated by short positions!Although the easing of trade tensions in the short term has led to a correction in gold prices, the three core factors supporting the strength of gold still exist: expectations of loose global monetary policy, rising geopolitical risks, and the long-term weakening trend of the US dollar. In particular, the market expectation that the Federal Reserve may maintain loose monetary policy will continue to provide momentum for gold to rise.
From the daily chart, the price of gold has shown a clear upward trend since this year. Although there have been several corrections in the middle, the bulls still control the medium and long-term market. After the previous rise in the H4 cycle, it is not so strong now. Instead, it is a volatile trend. The Bollinger band is closed, and the trend strength still needs market stimulation to rise again.
The 1-hour moving average of gold has begun to turn, so the rising strength of gold bulls has been suppressed. The high point of the 1-hour rebound of gold has been getting lower and lower, and the low point has also begun to fall. The 1-hour gold has begun to fluctuate downward. The downward trend of the gold rebound is suppressed near 3340. Gold rebounds near 3340 and can still be shorted.

Going long on pullbacks remains the mainstream.Fundamentals: Risk aversion is still the mainstream in the current market; risk aversion funds and risk aversion sentiment are still dominant in the gold market; although risk aversion and bullish sentiment have weakened at the war and trade war levels; the overall global fundamentals have not returned to their original state; behind various small fundamentals, there is still the possibility of triggering various risk events
Gold continued to rise on Friday due to the rise in risk aversion caused by tariffs, and the price of gold continued to rise to around 3365, and the daily line closed with a full big positive line again. If gold can successfully break through and stabilize in the 3360-3365 range in the future, the bull market is expected to regain its dominant position.
From the perspective of the 4-hour cycle, the price of gold continues to rise based on the unilateral moving average. Although there is a temporary divergence in the current indicators, in terms of form, the price of gold has achieved a short-term break. Next Monday, it is necessary to focus on the support strength of the 3345-3335 position, and the upper pressure range is maintained at 3365-3375. Do not blindly chase the rise before successfully breaking through and stabilizing. In terms of operation strategy, it is recommended to wait for the opportunity to step back, buy on dips, and continue to be bullish on gold prices. If gold can continue its strong performance next week, it is expected to test the previous high of 3430-3440 again.

Plan ahead Sell high and buy low to take the lead.Yesterday, the technical side of gold rose first and then fell. We directly arranged 3327 long orders to take profit and exit at 3340. After further accelerating to break through the 3345 mark, it fell under pressure and fell rapidly. We also successfully shorted at 3341, and the target successfully reached 3330-20. The European session continued to fall and broke through the 3300 mark and continued to fall to around 3280 to stabilize and rebound. We went long at 3280, and the target was 3300-3306. The daily K-line closed at a high and fell back to oscillate in the middle. The overall gold price was suppressed and oscillated at the 3345 mark in the short term. Yesterday's three orders also reached the take-profit target as expected.
From the 4-hour market analysis, today's upper short-term resistance is around 3315-3320. If the upper pressure 3315-3320 is not broken, shorting can also be done. Focus on yesterday's high pressure of 3345. The support level below is still 3280-3275. If it breaks down, pay attention to 3255-3250. Continue to rely on this range to maintain the main tone of high-altitude low-multiple cycles during the day. Observe more and move less in the middle position, be cautious in chasing orders, and wait patiently for key points to enter the market.
Operation suggestions:
1. Go long when gold falls back to 3285-3275, and look up to 3300 and 3315.
2. Go short when gold rebounds to 3340-3345, and look down to 3325 and 3315.

Flexible strategies lead to the best response.📍News:
The continued escalation of the war in the Middle East has increased risk aversion in the gold market.
At the same time, the Russian-Ukrainian negotiations broke down, and Russia launched the largest attack since 2022. Under the double attack, the market's risk aversion is full.
📊Gold technical analysis:
Today's gold price showed a violent fluctuation pattern. During the Asian session, the gold price quickly broke through the 3345 regional resistance and then fell back quickly, indicating that the short-term top pressure was significant. Subsequently, the market fluctuated repeatedly in the 3345-3320 high range and the 3320-3280 low range. After testing the 3350 high point in the Asian session, it retreated sharply, releasing a staged peak signal, indicating that the previous increase has entered the correction and callback stage, but the overall trend is still dominated by wide fluctuations.
Market sentiment reversed, and the price slowly fell and then was pulled up by the positive line. The game between long and short positions was fierce. Although the short position once dominated, the long position counterattacked strongly, and it is expected that it may hit the resistance near 3320 again. The current market has not formed a unilateral trend. The operation is still to deal with the idea of shocks, and maintain the idea of high-altitude and low-multiple. The strong resistance above is at 3350, and the key support below is 3280-3275. The probability of breaking down in the short term is low.
🎯Operational suggestions: Go long on gold when it falls back to around 3280-3275, look at 3300 and 3320, and go short if the rebound pressure of 3320 is not broken.

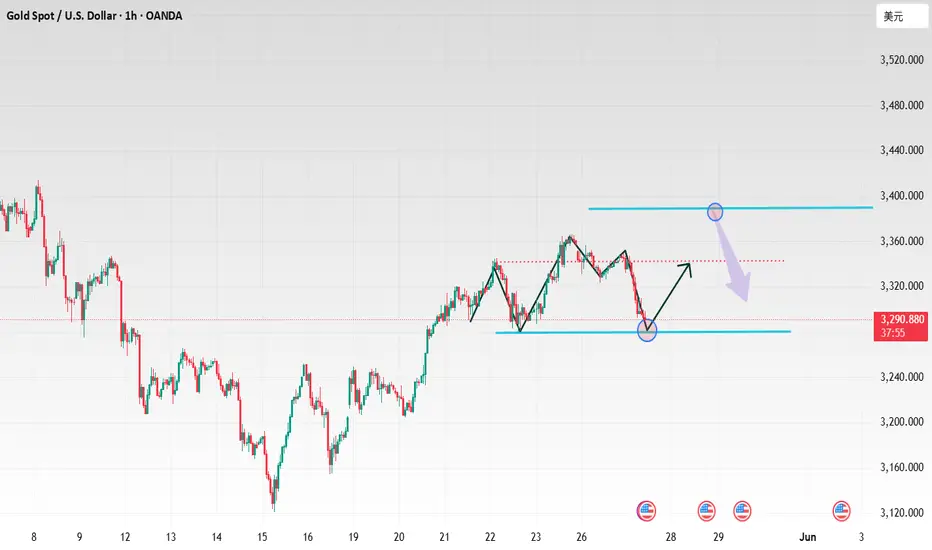
The unilateral offensive is fierce: the bulls have clear goalsGold is performing strongly sideways. We are in the same rhythm as yesterday and continue to maintain bullishness. Gold broke through the key resistance of 3280 on Tuesday and then rose strongly. It is currently above the area near 3330. The technical side shows that the bullish trend continues. The next target may point to the high of 3400. After rising continuously on Monday and Tuesday, it slightly adjusted back to around 3285 on Wednesday and stabilized before rising again. The daily line closed positive and stood firmly on the middle track. The Bollinger band opened upward, and the upper track pressure was at 3400, suggesting that the medium-term upward space is open. The Bollinger band opened significantly, the moving average was arranged in a bullish pattern, and the upward momentum was strong. Short-term support focuses on the moving average at 3315. If the correction does not break this position, the trend long order can follow up. If the key resistance of 3350 is effectively broken, it will further open up the upward space.
Gold operation suggestions: continue to go long after stepping back to 3320-3315, with a target of 3350. If it rises to around 3350 without breaking, you can arrange short-term short orders, with a target of 3330.

Flexible response is the best strategyGold rose sharply in the morning and continued to rise slowly during the day. Because of the divergence of indicators in the short cycle, it is difficult to exert further force. Today's market has been fluctuating between 3285 and 3320. In the evening, we will first look at the space for decline and repair, and then fall back to accumulate strength to stabilize and attack. The lower support will remain at 3285-3280, and then look at the low point of 3274. The upper resistance level will look at the existing high point of 3320. If it breaks through 3320, then pay attention to around 3345. Short positions will be entered when the pressure situation is met. Continue to remain bullish in the evening. In terms of operation, wait for a decline and gradually look up to 3320 and 3345.
Gold operation suggestions: go long on gold around 3290-3285, and look at 3315 and 3325.

Trend trading is the core strategyGold opened at 3290 and rebounded, reaching 3314 and retreating. Last night, gold broke through the box and oscillated, so it is reasonable to continue to move up. The gold moving average continues to cross upward and diverge. The strength of gold bulls is still there. The decline of gold is an opportunity to continue to go long. Gold is now at the top and bottom conversion position of 3275-85. Gold falls back to 3275-3285 and continues to go long. Gold has repaired the gap of the previous gap. In the short term, pay attention to the suppression of 3315-21. Try not to chase the high position. We will intervene in the long position when it falls back.
Today, the support below is around 3275-85, and the upper short-term focus is on the 3315-21 line. If it does not break, you can short. The important resistance is 3340-45. The short-term long-short strength and weakness watershed is 3253-60. The daily level stabilizes above this position and continues to maintain the same low-long rhythm. Shorting can only enter the market at key points, and enter and exit quickly, and do not fight.
Gold operation strategy:
1. Go long when gold falls back to around 3275-85, with a target of 3300-3320.
2. Go short when gold rebounds around 3340-45, with a target of 3320-3300.

Gold breaks through 3300, where is the next stop
📌 Driving events
Beth Hammack, president of the Federal Reserve Bank of Cleveland, stressed that the current US government's policies make it increasingly challenging for the Federal Reserve to effectively guide the economy and fulfill its dual mission of maintaining price stability and full employment. She also warned that the risk of a stagflationary environment (characterized by stagnant growth and persistent inflation) is rising. In contrast, Alberto Musalem, president of the Federal Reserve Bank of St. Louis, recently said that the current monetary policy stance is still appropriately adjusted.
Despite rising US Treasury yields, gold has struggled to gain support, indicating that higher yields alone are not enough to drive safe-haven demand under the current circumstances.
However, global monetary easing policies may provide support for this precious metal. In the latest moves during the Asian trading session, the People's Bank of China (PBoC) cut its benchmark interest rate, followed by the Reserve Bank of Australia (RBA) unexpectedly cutting the cash rate from 4.10% to 3.85% - moves that usually support non-yielding assets such as gold.
📊Comment Analysis
Spot gold prices have extended gains in recent intraday trading, taking advantage of its stability above EMA50 and trading along a bullish trend line on a short-term basis, strengthening its ability to reach the main resistance level of $3,300 and break it. Some weak signals have appeared on technical indicators. We noticed that a negative overlap signal has formed on the RSI, and after reaching overbought levels, this indicates that a temporary adjustment is needed on the upward action. Therefore, gold has reduced some of its early gains and waited for clearer signals to continue the bullish trend.
💰Strategy Package
🔥Sell Gold Zone: 3354-3356 SL 3361
TP1: $3345
TP2: $3332
TP3: $3320
🔥Buy Gold Zone: $3252 - $3250 SL $3245
TP1: $3260
TP2: $3270
TP3: $3280
⭐️ Note: Labaron hopes that traders can properly manage their funds
- Choose the number of lots that matches your funds
- Profit is 4-7% of the fund account
- Stop loss is 1-3% of the fund account

Perfect grasp of key points Insight into market trendsWith the downgrade of the U.S. credit rating and the recent weak U.S. economic data, market expectations for a U.S. interest rate cut have increased. The U.S. dollar index has plummeted and is once again facing the 100 mark. Risk aversion sentiment has rebounded again, and gold has once again been sought after. It opened higher in the Asian session. However, we have mentioned the repetitiveness of sentiment many times recently, so we remind you not to chase the rise too much. We remind you to short near 3245, long at 3209, and short again near 3245. Both long and short positions are very accurate, giving perfect entry opportunities and successfully taking profits.
Judging from the current trend, gold is under pressure again in the European session near 3248, and the US session has fallen back. The short-term strength has turned into a wide sweep again. Focus on the gains and losses of 3230. If it falls below or looks at the gap area of 3206-3203, go long if it falls back and does not break. The upper pressure is still focused on the area near 3253-60. Short-term fluctuations are increasing. If there is any adjustment, we will notify you in time.
Operation suggestion: Go long in gold near 3206-03, look at 3230 and 3252!

Beware! Gold Falls
📌 World Situation
Gold prices fell more than 1.5% on Friday and are on track to close the week with a loss of more than 4% as improving risk sentiment drove investors away from safe-haven assets and into stocks and other riskier investments. At the time of writing, XAU/USD was trading around $3,187, retreating from a daily high of $3,252.
The precious metal started the week lower following a reported significant de-escalation in the US-China trade conflict, including an agreement by both sides to reduce tariffs by 115%. Despite trading between $3,120 and $3,265 throughout the week, gold prices struggled to maintain bullish momentum, with weakening buyer interest becoming increasingly apparent against the backdrop of stronger risk appetite and encouraging US economic data.
📊Comment Analysis
Will be greatly affected by tariff news and Russia-Ukraine peace talks
💰Strategy Package
Resistance: $3265, $3357
Support: $3160, $3112
In this range, you can enter the market in batches in real time to flexibly grasp the market changes.
⭐️ Note: Labaron hopes that traders can properly manage their funds
- Choose the number of lots that matches your funds
- Profit is 4-7% of the capital account
- Stop loss is 1-3% of the capital account

Perfectly hold the pullback and continue to buy.Gold opened at around 3240 and then rushed to 3252 and then retreated. In the evening, we also gave a short position near the rebound to 3240. After all, there is a lot of pressure from above, and the technical side also needs to repair the strategy, so we gave a short position entry near 3237-38, and the target is 3215. As of the retracement, it reached the lowest point near 3206, which also successfully reached our target position. Today's Asian session high and retreat is completely a technical adjustment. It bottomed out and rebounded yesterday, with an increase of more than one hundred US dollars. The technical bulls are weak and need to pull back. This is why I gave the short position. Be a steady trader.
The gold market showed a V-shaped reversal pattern of bottoming out and rebounding yesterday. The daily line closed with a hammer-shaped positive line with an extremely long lower shadow, indicating that the support below is strong, but the overall high-level oscillation pattern is still maintained. Technical indicators show that short-term correction pressure still exists: the stochastic indicator is blunted at a high level, the MACD double-line dead cross is downward, and the Bollinger band opens downward. The gold price is likely to fluctuate around the middle and lower tracks.
The 4-hour level oscillates to the short side, and the 3200 line becomes the watershed between long and short. If it effectively falls below this level, the shorts will regain the initiative; on the contrary, the longs need to break through the strong resistance area of 3265-3270 to reverse the decline. At the close of the weekly line, the market has a demand for a restorative decline. If it falls below the 3200 integer mark, the target below will look at the 3180-3170 area. Focus on the effectiveness of the 3265-3270 resistance and the strength of the 3200 support, and be alert to the violent fluctuations in the closing market on Friday.
Gold recommendation: Go long when it falls back to around 3215-3205. Target 3230-40-50 first line

Gold comprehensive analysis summaryTechnical analysis of gold: In recent trading days, gold has experienced a rapid decline during the Asian session, then stabilized and rebounded, fluctuated during the European session, and rebounded after rising in the US session. Today, under pressure during the Asian session, the high point of yesterday's US session, 3258-60, has already experienced a rapid decline. It depends on whether it can stabilize and rebound next. Overall, continue to pay attention to the medium-term support of 3202-07. Before breaking down, once the bulls stabilize, they will fill the gap of Monday's gap in the area of 3320-25; if it breaks down, it will open up the downward space, further 3160-3120, and then gradually fall to 3060 and the starting point of this round of bulls, 3000. The M top or W bottom we emphasized is still waiting for the market to choose!
From the hourly chart, gold is currently facing some downward pressure, especially since the current price has fallen below the previous support range. After falling below the support level, the gold price rebounded again, but this rebound failed to break through the original support level and turned into resistance, indicating that the price has not recovered effectively. For now, multiple rebounds have hit around 3257 to form a double top pattern, and the scope of short-term long and short consolidation has been reduced. Including today's Asian session decline, it did not fall below the 3220 US dollar line. The short-term consolidation range temporarily refers to the 3257-3220 US dollar range, and the break will be adjusted. Today, the 1-hour SAR indicator 3246 pressure is referenced above. If it breaks above, it will look at the recent double top 3257 pressure short. Secondly, look at the 3265-78 range multi-directional suppression short. It is recommended to refer to the Asian session low near 3220 for long below. If it breaks below, it will look at the 3207-3200 range for long. On the whole, today's short-term operation strategy for gold is mainly to do more on the pullback and short on the rebound. The short-term focus on the upper side is the 3257-3265 line of resistance, and the short-term focus on the lower side is the 3215-3220 line of support.
Gold operation strategy reference: short gold near 3250-3260, target near 3240-3230. Gold pullback near 3225-3220 to do more, target near 3240-3250.

Start buying gold and wait for a rebound.At the 4-hour level, the overall market judgment remains unchanged. In terms of the lower support level, 3208-3207 is the key support area. This position is not only the low point on Monday, but also an important support level formed by the previous starting point line extending to the present. As for the upper resistance level, first of all, we need to focus on yesterday's high point of 3265, which is also the previous shock low point. Secondly, the 3290-3293 area formed by the rebound after the gap-down opening on Monday is also a resistance range that cannot be ignored. In the short term, pay attention to the resistance line of 3260-3270 above, and pay attention to the support line of 3220-3210 below in the short term. Further support focuses on the 3200 mark.
Gold operation strategy: 3220-3210 long, target 3230-3250; gold rebounds to 3260-3265 short, target 3240-3220.

How to plan a gold short selling strategyOn Monday, as China and the United States reached an agreement to reduce tariffs, market concerns about a U.S. recession eased, and the U.S. dollar index once approached 102, and finally closed up 1.37% at 101.80. U.S. bond yields both rose, and the interest rate market cut the Fed's pricing for rate cuts this year, boosting demand for the U.S. dollar. However, although the U.S. dollar is bullish in the short term, it faces key resistance, and the U.S. CPI data is coming. If inflation is lower than expected, bulls may take a break.
Today's market rose slightly first, then fell strongly to 3216, and then rose strongly to 3260 in the Asian session before being under pressure. The market is currently in the repair stage, and CPI data is attracting much attention. If the European session does not continue to rise but falls, the bulls may end at 3270. Technically, the upper resistance is 3268-3274, and the lower support is 3244-3237. In terms of operation, it is recommended to rebound high and short as the main, and to pull back and long as the auxiliary.
Operation strategy 1: It is recommended to short near the rebound 3268-3274, with a target of 15-20 points.
Operation strategy 2: It is recommended to pull back near 3244-3237 and long, with a target of 10-15 points.

Gold rebound is a good time to shortGold has been in a volatile state since the opening today, opening at 3236 and reaching a high of 3243. It is currently fluctuating in the form of shocks. With the comprehensive ceasefire between India and Pakistan and the peace talks in the Sino-US tariff war, gold will still be in a downward trend. Although it is in a downward trend, we should not chase the short position directly. We can just treat the rebound as shorting. The main trend is still to short on the rebound. After all, the general trend is bearish.
In the 4-hour chart, the weak stage is oscillating downwards, and the resistance of the middle rail has moved down to the 3300 mark. At the same time, there is still a gap to be filled, and it is currently in shock above the neckline. There are two differentiated moves here. One is to go sideways and weakly consolidate and then directly break the neckline of 3200 and go for in-depth adjustments. The other is to rebound above 3200 to correct and build momentum, forming a wave of poised to break low. One is weak consolidation to break low, and the other is poised to break low. Overall, it is optimistic that the market will break through the low of 3200, but it reflects the various changes in the short-term form. The upper 3250-3260 range has gathered intensive trading resistance, forming short-term strong pressure. In short-term operation, first go short on rallies below 3260, and first look at the profit from this wave of correction! Next, we will look at the previous low support of 3200. If the position is broken, we will continue to see the downward continuation. If the position is not broken, we will place long orders on the backhand. At that time, we will choose the opportunity to lay out the long-term plan based on the support of 3200. On the whole, today's short-term operation strategy for gold is to short on rebounds and long on pullbacks. The upper short-term focus is on the 3248-3252 resistance line, and the lower short-term focus is on the 3200-3160 support line.
Gold operation suggestion: short gold near 3245-3255, target around 3220-3210. Gold will go long when it pulls back around 3210-3200, with the target around 3230-3250.

Gold rebound is weak, full analysis of high-altitude strategiesTechnically, gold faces the test of whether the double top pattern can be established. The progress of the trade agreement may exceed expectations. In the short term, the gold price is disturbed by the trade news, but in the long term, geopolitical, debt and interest rate cuts still support the upward trend of gold prices. Gold stabilized and rebounded after hitting a low of 3207 during the European session, and further rose to a high of 3248 during the US session. However, the rebound momentum was relatively limited, and the current price maintained a volatile pattern within the 3220-3248 range. At present, 3250 has become a key resistance level. If it can effectively break through and stand firm, the gold price is expected to further test the 3270-3288 area. However, from the perspective of short-term momentum, it is still facing downward correction pressure in the late trading period. Technically, the upper resistance is concentrated in the 3248-3252 range, and the lower support is around 3225-3217. In terms of operation, it is recommended to mainly do long positions on callbacks, supplemented by rebounds from high altitudes.
Operation strategy 1: It is recommended to do more on the pullback in the 3225-3217 area, with a target of 10-15 points.
Operation strategy 2: It is recommended to short at the rebound area of 3245-3252, with the target at 10-15 points.

Decisively start the short-selling layoutThe results of the China-US talks were significant and exceeded market expectations. China and the US issued a joint statement, the core of which was to end the tariff war and reduce the tariffs of both sides to 34%, of which 24% will be temporarily exempted within 90 days.
At present, there is still a demand for a rebound. For the US market, we should first look at the area around 3245-55. If the rebound is in place, continue to play short orders to look at the target position of 3200. If it breaks upward, find a new point layout. This week's data and news will have a further impact on gold.
Operation suggestion: Short gold when it rebounds to around 3245-3255, pay attention to 3220 and 3200

Seize the moment! The rebound is a good opportunity to shortGold was affected by the implementation of the China-US tariffs and the ceasefire between India and Pakistan, which weakened the market's risk aversion sentiment. The weekly line formed a double-needle top pattern, and continued to see downward adjustments this week. The daily line also has a double top structure, with 3500 and 3435 as double tops, and the neckline focuses on 3202. If it falls below, the double top pattern is confirmed. In terms of thinking, keep falling back and adjusting, with pressure focusing on 3260 and 3283, and support below focusing on 3200-3202. In terms of operation, rebound high and short are the main, and falling back is supplemented by long.
Operation suggestion: short gold when it rebounds to around 3255-65, and look at 3320 and 3200. long gold when it falls back to around 3210-3200, and look at 3320 and 3250.

Circular short selling is still the main themeGold has no power to rebound in the Asian session, and it keeps fluctuating and falling. The highest rebound was 3292, but it fell back under pressure, and the lowest touched 3217. The fluctuation and decline are still dominant, so we only need to short on the rebound. It is still difficult to fill the gap at the opening today, so don't have hope. Just keep shorting on the rebound. The weekend article also analyzes the bearish opening this week. After all, the international situation of India and Pakistan's comprehensive ceasefire and Russia-Ukraine ceasefire negotiations are mainly bearish for gold. Coupled with the technical shorts, it is reasonable for gold to jump short. Today, we will treat gold as rebound shorting. In terms of operation, we will mainly short on rebound and be a steady trader. Judging from the current trend of gold, the main short rhythm of the pullback will continue to remain unchanged before the daily level breaks through and stands at this position.
