BTC continues to short at high levels during the day📰 Impact of news:
1. Geopolitical impact
📈 Market analysis:
BTC has reached an intraday high of 108,125, just one step away from the all-time high of 112,000. With the increase in trading volume and institutional sentiment turning bullish, the momentum seems to be in the bulls' favor. In addition to institutional buying, the ceasefire agreement in the Iran-Israel war is also an important factor in Bitcoin's sharp rebound. Trump's announcement of the end of the war almost immediately triggered a surge in the cryptocurrency market. However, the overall pattern has not changed, and the range resistance has not been broken, so we still keep the idea of shorting at high levels.
🏅 Trading strategies:
SELL 108000-107500
TP 104500-103500
If you agree with this view, or have a better idea, please leave a message in the comment area. I look forward to hearing different voices.
Goldlong

Gold XAUUSD Analysis 25.06.2025The Gold shows with a recent upward trend following a period of consolidation and a dip. Key observations:
The price previously fluctuated between a support level around 3,310-3,319 and a resistance near 3,354.
The current price is consolidating near the recent high, suggesting potential for further upward movement or a pullback.
Signal:
Buy signal is present in the range of 3,316-3,319, aligning with the support level, offering a good entry point for a potential upward move.
Suppression remains unchanged, the latest layout of gold📰 Impact of news:
1. Powell's testimony
2. Geopolitical impact
📈 Market analysis:
The short-term rebound of gold is the release of energy for the accumulated bulls. From the current market trend, 3340 above is the key point of the short-term watershed between bulls and bears. The short-term resistance above is around 3342-3348, and the short-term support below is around 33220-3315. If it falls below this, it will continue to look towards yesterday's low of 3290-3280. The daily level is under pressure and continues to see a decline and adjustment. If it touches 3340-3350 above, you can try to short. After it retreats to 3320-3315 and obtains effective support, you can consider going long.
🏅 Trading strategies:
SELL 3340-3350
TP 3330-3320-3315
BUY 3320-3315
TP 3330-3340-3350
If you agree with this view, or have a better idea, please leave a message in the comment area. I look forward to hearing different voices.
OANDA:XAUUSD FX:XAUUSD FOREXCOM:XAUUSD FXOPEN:XAUUSD TVC:GOLD

Bulls have made profits, gold layout in the evening📰 Impact of news:
1. Powell's testimony
2. Geopolitical impact
📈 Market analysis:
I have completed the long trade according to the previous trading strategy, and the long order has generated profit. In the short term, the overall trend of gold is still bearish. Only if it breaks through and stabilizes above 3350 can the bulls continue. If it rebounds to the 3330-3335 line and encounters resistance under pressure, you can consider shorting. If it rebounds to 3340-3350 but fails to stabilize, you can increase your short position. Pay attention to the support of 3320-3300 below. If it falls below 3300, it is expected to reach 3280
🏅 Trading strategies:
SELL 3330-3335-3340-3350
TP 3320-3310-3300-3280
If you agree with this view, or have a better idea, please leave a message in the comment area. I look forward to hearing different voices.
OANDA:XAUUSD FX:XAUUSD FOREXCOM:XAUUSD FXOPEN:XAUUSD TVC:GOLD

Gold Rebounds Slightly After Dropping to 3295📊 Market Update:
Gold bounced back to 3320 after dipping to 3295 amid USD strength and rising bond yields. The recovery was fueled by short-covering, but traders remain cautious ahead of upcoming U.S. PCE data – the Fed’s preferred inflation gauge.
📉 Technical Analysis:
• Key Resistance: 3330
• Nearest Support: 3295
• EMA: Price is hovering near the 09 EMA on the H1 chart → neutral to slightly bullish in short-term correction.
• Candle / Volume / Momentum: H1 candles show mild recovery with increased volume, but no clear reversal signal yet.
📌 Outlook:
Gold may range between 3295 and 3330 before a breakout, depending on incoming U.S. economic data. A break above 3330 could trigger a short-term rally.

Bearish direction remains unchanged, wait patiently
Since the sharp drop in gold last Monday (June 16), except for the correction of closing the cross positive line last Tuesday, the daily level has closed five consecutive negative lines since last Wednesday until now, fully demonstrating the weak characteristics of gold prices in recent trading.
From the technical indicators, the 5-day moving average and the 10-day moving average have formed a dead cross, which is an important signal of the weakening of the short-term market trend. The current gold price continues to run below these two moving averages, further verifying the current market situation where the shorts dominate. There is still no big fluctuation in the intraday, short positions are patiently waiting, and the operation still maintains our target of 3310-3305 unchanged.

GOLD/XAUUSD SellGold price is still bearish in the short term. The US dollar is currently being boosted. There are also geopolitical talks and indirect ceasefires. Therefore, the short-term risk aversion sentiment has declined. The gold price is now quoted at: 3323. We can focus on the lower target of 3300-3290.

Gold rebound is blocked, 3333 line is directly short
After the continuous rebound, the gold price also showed obvious stagflation near 3340. The intraday hourly line went out of a small double top, which can also be said to be a weak rebound. We also said at the opening that 3340 is a short-term key long-short conversion position. At present, the gold price is still under pressure below this, which means that the market is still short. Then the gold price began to fall. There is no problem with our thinking, and our internal strategy also started shorting directly at the 3333 line. The current position is making a profit.
The market is weak, there is no doubt about it. There are only two conditions that can change our thinking. One is that the gold price rises rapidly and sharply to stand at 3340, and the other is that the gold price bottoms out near 3300. However, before any of the conditions are met, the short position will continue.
Specific strategy
Gold 3333 short, stop loss 3343, target 3310

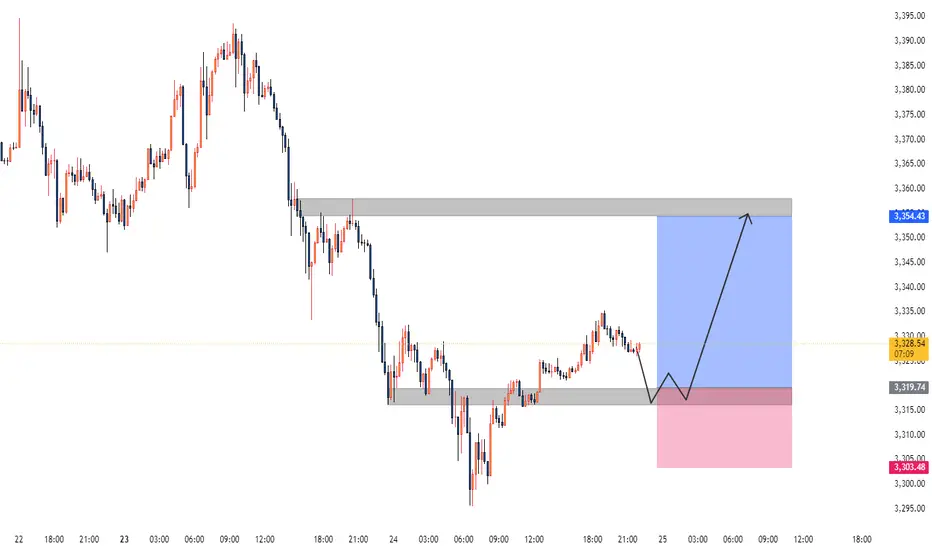
Pullback Before Bullish ContinuationGold is currently facing resistance near the mid-Keltner Channel zone. Based on current structure and momentum, we anticipate a two-phase move:
🔻 Phase 1 – Short-Term Pullback:
Price is likely to reject the current resistance and move lower into the demand zone around 3310–3315. This retracement aligns with a healthy correction within a larger structure.
🟢 Phase 2 – Bullish Reversal:
After the pullback, we expect a strong bullish continuation toward the 3370–3373 area. This level represents the next significant resistance and profit target for long positions.
📌 Key Zones to Watch:
Demand Support: 3310–3315
Bullish Target: 3370–3373
Stop-Loss for Longs: Below 3308

Gold May Dip Short-Term Amid Cautious Fed & Geopolitical Calm📊 Market Overview:
• Gold saw a slight correction as Middle East tensions eased following a ceasefire agreement between Iran and Israel.
• A weaker USD and lower U.S. Treasury yields offered some support to gold prices.
• However, the Fed’s cautious stance on rate cuts and upcoming testimony from Chair Powell continue to weigh on gold sentiment.
📉 Technical Analysis:
• Key Resistance Levels:
– $3,350–3,360 (21/50-day SMAs)
– $3,370–3,385 (Fibonacci zone and swing highs)
• Nearest Support Levels:
– $3,316–3,320 (intraday lows and psychological level)
– $3,300–3,305 (strong support), followed by $3,245–3,275 if broken
• EMA 09: Price is currently trading below the 09 EMA, indicating a short-term downtrend.
• Candlestick Pattern / Volume / Momentum:
– The 15-minute chart shows slight recovery signals, but with weak momentum; RSI is below average and MACD is slightly bearish.
– No strong reversal candlestick pattern detected; small-bodied candles (doji) suggest indecision and selling pressure remains near $3,340.
📌 Outlook:
Gold may decline slightly in the short term, potentially retesting the $3,316–3,320 support zone. A rebound is possible if the USD weakens further or the Fed unexpectedly signals rate cuts.
💡 Suggested Trading Plan:
🔻 SELL XAU/USD at: $3,335–3,340
🎯 TP: $3,330 - $3,325
❌ SL: $3,345
🔺 BUY XAU/USD at: $3,318 – 3,315
🎯 TP: $3,320 - $3,325
❌ SL: $3,312

GOLD H2 Intraday Chart Update For 25 June 25 Hello Traders, as you can see that market just try to broke 3300 psychological level yesterday but unfortunately that was not successful attempt
All eyes on 3337-3348 zone for the day if market successfully breaks that zone it will move towards 3365 Blind Structure Level else we might see 3305 level test soon on Intraday basis
Reminder: This is also FED Chair Powell 2nd of Testifies
Disclaimer: Forex is Risky

XAUUSD poised for a rebound?Gold (XAUUSD) is currently trading around the 3,327 level after breaking below a short-term ascending trendline that started in mid-May. While this break might suggest a potential bearish reversal, from a technical standpoint, it could simply be a corrective move within a larger bullish structure.
The current price pattern appears to be forming a classic ABC correction.
If the support zone around 3,320–3,325 holds, there’s a strong possibility that price will rebound toward the 3,400–3,480 region in the coming sessions.
This area is not only a technical support but also a previous demand zone where buyers stepped in aggressively. Close attention should be paid to any bullish price action signals here. A reversal candlestick or a volume spike could serve as confirmation for a rebound setup.
A potential trade idea is to consider a long position around 3,320–3,325, with a stop loss below 3,308.
First target is set at 3,400, and an extended target at 3,480 if bullish momentum continues. Conversely, if the price closes below 3,308 with strong volume, the bearish scenario will gain ground, potentially dragging price down to the 3,280–3,231 support area.
The setup remains open, and clear confirmation is needed. Patience is key—wait for solid signals before committing to a position.

GOLD XAUUSD TodayGOLD XAUUSD Today for me maybe finish down move
Next week I expect change direction to LoNG setups.
My target will be new high.

Gold Trading Analysis and Strategies for Sideways Decline MarketAfter Trump announced a comprehensive ceasefire agreement between Israel and Iran, market risk aversion significantly cooled, and gold prices plunged by more than $30 in early trading. Although the stability of the ceasefire agreement remains doubtful, the rebound in risk appetite has dominated market trends, with stock markets rebounding, oil prices falling, and demand for safe-haven assets declining.
From a technical perspective, the moving average system on the daily chart of gold shows an intertwined state, indicating a relative balance between bulls and bears. The current key resistance above is near 3350, which is an important psychological threshold. If effectively broken, it may open up upward space; the lower support is focused on the 3285-3290 range, which is the lower edge of the May consolidation platform. A break below this level may intensify correction pressure. The loss of the midline in the 4-hour chart further confirms the short-term weak structure, providing technical support for the downward trend.
XAUUSD
sell@3330-3340
tp:3320-3310
buy@3285-3290
tp:3310-3320
Investment itself is not the source of risk; it is only when investment behavior escapes rational control that risks lie in wait. In the trading process, always bear in mind that restraining impulsiveness is the primary criterion for success. I share trading signals daily, and all signals have been accurate without error for a full month. Regardless of your past profits or losses, with my assistance, you have the hope to achieve a breakthrough in your investment.

XAUUSD – Selling Pressure Intensifies, the 3,300 USD 1. Overall Technical Context
The XAUUSD daily chart shows that gold is under bearish pressure after failing to break the key confluence resistance at 3,385–3,399 USD, which includes:
- Fibonacci retracement levels 0.5 – 0.618
- A strong supply zone that has been repeatedly rejected
- A minor swing high formed near 3,451 USD
2. Recent Price Behavior
Price has broken below the short-term support at 3,331 USD and is now retesting the Key Lever zone around 3,300 USD, which is a confluence of:
- Previous June swing low
- Fibonacci 0.618 retracement of the latest upward move from 3,221 to 3,451
- A key previous support zone, potentially forming the right shoulder of a head and shoulders structure
If this zone breaks decisively, XAUUSD may continue falling toward the 3,270 – 3,250 USD area, where strong liquidity was previously found.
Key Technical Zones
Resistance:
3,385 – 3,399: Fibo 0.5–0.618 zone and recent swing high
3,435 – 3,451: Major swing high and starting point of the latest correction
Support:
3,300 – 3,320 (Key Lever): Major support currently being tested
3,271 – 3,250: Next support if the current zone fails
Suggested Trading Scenarios
Scenario 1 – Buy on Confirmation at Key Lever
Entry: 3,300 – 3,297 (Key Lever zone)
Stop-loss: Below 3,292
Take-profit: 3,310 – 3,315 – 3,320
Condition: Wait for a clear reversal candlestick pattern or signs of selling absorption on H4/H1
Scenario 2 – Sell if Price Breaks Below Key Lever
Entry: Below 3,290 (after clear break of Key Lever)
Stop-loss: Above 3,298
Take-profit: 3,280 – 3,270
P.S. XAUUSD is currently sitting at a decisive support area around 3,300 USD. The medium-term trend will depend on whether this zone holds. Traders are advised to closely watch price action on the H1–H4 timeframes before executing entries.
Follow for more daily trading strategies and don’t forget to save this analysis if you find it helpful for your trading plan.
Analyst: @Henrybillion

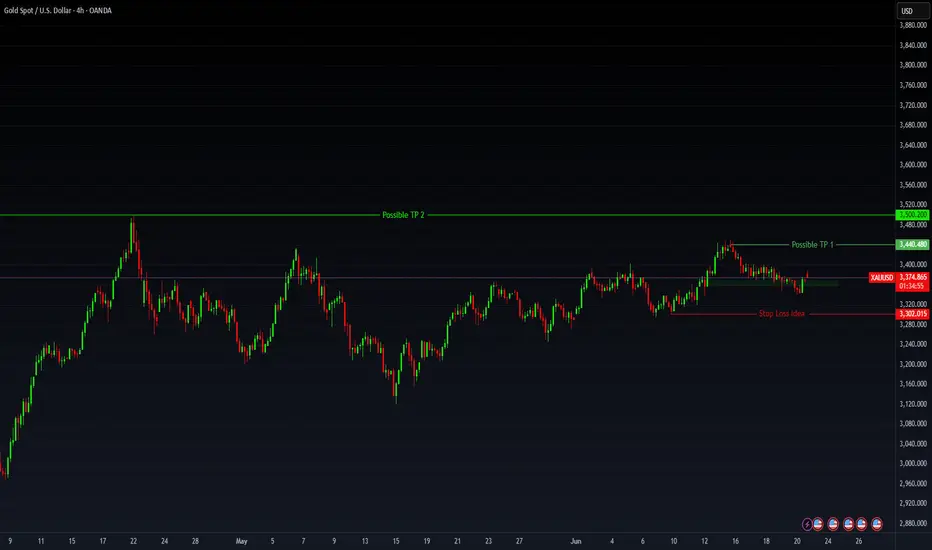
Gold’s Geopolitical Launchpad: Eyes on $3,500+🟡 GOLD - Macro Fuel Meets Technical Momentum Trade Levels Inside
Gold continues to flex its haven status as geopolitical tensions flare once again—this time triggered by reports of a U.S. airstrike on Iranian nuclear facilities. That headline risk has lit the fuse under precious metals, and the reaction in futures markets has been swift.
Friday’s intraday washout—largely driven by hopes that President Trump would opt for diplomacy—was short-lived. The strong recovery into New York close left a long lower shadow, signaling buyers are already pricing in weekend escalation risk.
💡 Macro View:
- Analysts project a move toward $3,500–$3,700, driven by a twin-engine of geopolitical instability and sticky inflation.
- Central banks are staying long; ETF inflows are ticking up—this isn’t just speculative hype.
- Goldman’s base case: $3,700 EOY, $4,000 by mid-2026. Recession/volatility scenarios stretch targets up to $4,500.
🔧 Technical Setup:
- Bias across all time frames remains bullish. Open float pressure is stacking with long-side conviction.
- Key long trigger zone sits between $3,369–$3,375—I’m watching for confirmation here.
- Profit targets:
- First resistance: $3,440.48
- Second target: $3,500 zone
- Stretch: $3,520+ if volatility expands
Gold remains weak and is expected to fall below 3,300
Gold fell today due to the news of a comprehensive ceasefire in the Iran-Israel conflict. In addition, as Fed officials claimed that there was no need to cut interest rates at present, expectations of interest rate cuts fell, the dollar strengthened, and gold was under pressure. In the short term, it may continue to fall and further test 3291 to 3285. Therefore, today we should continue to operate short, pay attention to 3336-38 to suppress shorts, defend 3346, and look at 3300/3285 support.
Gold short-term trading: short near 3336, stop loss 3346, take profit 3300

Buy gold, there may be a rebound in the short termAt present, gold has touched the area of 3325-3315 mentioned in my previous article, and the lowest price is around 3316. At present, due to the current important support area of 3310-3300 below, gold still has a rebound demand in the short term; although gold has not rebounded sharply at present, the downward momentum has indeed slowed down, and gold may rebound after the short force is consumed. Moreover, the ceasefire between Iran and Israel has not yet been settled. Moreover, the ceasefire between Iran and Israel has not yet been settled. With the fluctuating situation in the Middle East, bulls may have opportunities to counterattack.
However, the current performance of gold is indeed relatively weak, so there is no need to expect gold to rebound and fill the upper gap area of 3360-3370 in the short term; in trading, the rebound expectation can be appropriately lowered, and long positions can continue to be held and look up to the 3340-3350 area.

GoldKey Data Points:
Current Price: 3,309.065 USD
Open: 3,358.435 USD
High: 3,363.900 USD
Low: 3,307.295 USD
Change: +1.77% (+59,760 points)
Volume: Not explicitly stated but implied by "1B" (likely 1 billion units).
Price Action & Technical Observations:
Trend:
The price is currently below the open (3,309.065 vs. 3,358.435), suggesting a pullback after an intraday high of 3,363.900.
The +1.77% daily gain indicates overall bullish momentum, but the candle shows rejection near highs (wick formation).
Support/Resistance Levels:
Resistance:
Immediate: 3,362–3,375 USD (previous highs/profit targets).
Strong: 3,406–3,425 USD (key profit levels).
Support:
Immediate: 3,288–3,265 USD (labeled "Entity" and "Profit" zones).
Strong: 3,250 USD (psychological level).
Profit Targets:
The chart marks three profit-taking levels:
3,323 USD (minor), 3,362 USD (mid), 3,406 USD (major).
This suggests traders are eyeing these levels for potential reversals or take-profit actions.
Volume & Momentum:
The "+59,760" change with "1B" volume implies strong buying interest, but the long upper wick hints at selling pressure near highs.
Potential Scenarios:
Bullish Continuation:
If price holds above 3,288–3,265 USD, a retest of 3,362–3,406 USD is likely.
Bearish Reversal:
A break below 3,265 USD could trigger a drop toward 3,250–3,225 USD.

XAU/USD) Bullish reversal analysis Read The captionSMC trading point update
Technical analysis of Gold (XAU/USD) on the 30-minute timeframe, based on technical signals and price action behavior. Here's the breakdown
---
Gold Bullish Reversal Setup – Targeting 3,384
---
Key Technical Highlights:
1. Support Zone & Price Reaction:
Price has tested a strong horizontal support level (highlighted in yellow).
Multiple bullish rejection wicks indicate buying pressure at this zone.
The green arrows show successful support bounces, hinting at bullish intent.
2. Trendline Analysis:
Price bounced near the lower boundary of the falling wedge/downtrend channel.
An uptrend line convergence supports potential reversal.
A breakout above the short-term descending trendline is indicated.
3. EMA & Target Projection:
EMA 200 at 3,364.33 may act as dynamic resistance, the next short-term hurdle.
Target zone projected at 3,384.04, offering a potential move of +65.67 pts (~1.98%).
4. RSI Indicator:
RSI(14) is oversold (~29.93), signaling a potential reversal.
A bullish crossover may be forming, supporting upward momentum.
---
Trading Plan:
Entry Zone: Near current support area around 3,325
Target: 3,384
Stop Loss (Suggested): Below 3,300, under support structure
Risk/Reward: Favorable based on support hold and breakout projection
Mr SMC Trading point
---
Conclusion:
This setup suggests a short-term bullish reversal from a key support area, with confirmation likely if price breaks above the descending trendline and clears the 200 EMA.
Please support boost 🚀 this analysis)

Gold updateAfter the previous level was broken and structure shifted, we’re now entering a new phase of analysis.
In this fresh setup, we’re looking for buy opportunities — but not blindly!
As always, waiting for a clean pullback to the new zone and a solid entry signal.
Experience teaches us: real profits come from patience and planning.
Here’s my new gold analysis — high probability, low risk.
For detailed entry points, trade management, and high-probability setups, follow the channel:
ForexCSP

Weakness continues, continue to short the bear market📰 Impact of news:
1. Pay attention to Powell's speech in New York
2. Pay attention to geopolitical influence
📈 Market analysis:
Gold opened lower and showed a weak situation. The 1H moving average was arranged downward. In the short term, bears still occupied the main trend. From the 4-hour analysis of gold, the bulls still had repeated resistance before breaking down. Once it breaks down, the market will go further bearish. Pay attention to 3330 below. 3400 is still the key above in the short term. Only by breaking through the bulls can the rebound continue. In terms of operation, high-altitude and low-long are temporarily maintained. Pay attention to the short-term resistance of 3355-3365 above, and the support of 3340-3330 below. Pay attention to the breakthrough! Pay attention to Powell's speech in the New York session.
🏅 Trading strategies:
SELL 3370-3365-3355
TP 3340-3330
BUY 3340-3335-3320
TP 3345-3355-3365
If you agree with this view, or have a better idea, please leave a message in the comment area. I look forward to hearing different voices.
TVC:GOLD FXOPEN:XAUUSD FOREXCOM:XAUUSD FX:XAUUSD OANDA:XAUUSD

Gold is under pressure and continues to focus on weekly support
The Israeli-Iranian conflict that broke out on June 13th lasted for 12 days before a ceasefire agreement was reached. Iran retaliated against the US military base but did not block energy transportation. Trump called its response weak, and market concerns cooled. Gold and oil prices gave up their gains. Spot gold closed at $3,368.98 per ounce, close to flat. U.S. crude oil fell 9% from a 5% increase. Trump announced on Tuesday that Israel and Iran had reached a ceasefire agreement. After mediation by Qatar, Iran agreed, and Israel also hoped to end the conflict within a few days.
Gold fell as the situation eased and the demand for safe-haven assets weakened. Oil prices fell more due to the lack of risk in the Strait of Hormuz, and U.S. stock index futures rose. Federal Reserve Vice Chairman Bowman unexpectedly said that interest rates may be cut in July. U.S. Treasury yields fell and the U.S. dollar index fell, but did not support gold prices. The U.S. economy is facing inflation and growth slowdown pressure. If the situation in the Middle East worsens, oil prices may soar, exacerbating the risk of stagflation. Short-term ceasefires and differences with the Federal Reserve suppress gold prices. Medium- and long-term geopolitical risks and expectations of interest rate cuts support gold. Investors can pay attention to relevant developments and diversify their allocations.
In terms of gold, the overall price of gold fell on Monday. The highest price rose to 3396.68 on the day, and the lowest price fell to 3346.92, closing at 3368.94. On Monday, gold jumped higher in the early trading, and then came under pressure again. It continued to rise after the European and US trading to test the opening high. The price fell very weakly overnight, and finally ended with a big negative. At present, gold is still in a volatile decline.
From a multi-cycle analysis, first observe the monthly rhythm. The price ran according to the rhythm in May as the author said, and finally in a cross state. For June, focus on the gains and losses of the highs and lows in May. The price will only be a real break if it really closes above this position. The long-term watershed is at 2780. From a weekly level, the gold price is supported by the 3280 regional support level. From a mid-term perspective, we are still in a mid-term bullish position, but we need to pay attention to the market's retracement to the weekly support. At the same time, the price will be further under pressure only if it breaks the weekly support. From the daily level, the price breaks the 3365 daily watershed. The overall follow-up still focuses on the pressure performance, and the focus below is on the retracement to the weekly support. At the same time, according to the four-hour level, we need to pay attention to the 3360 position temporarily. Since gold is currently in a volatile decline, it will continue to be short before breaking 3405. In the short term, we will first focus on the four-hour and daily resistance pressure, and focus on the 3320 and 3280 area support below.
Gold 3360 and 3365 range is under pressure, and the target is 3320-3280
