GOLD BUY M15 Gold (XAU/USD) 15-Minute Chart Analysis – July 7, 2025
Trade Setup: The chart shows a bullish trade setup based on a potential reversal from a "Weak Low" support area around 3304. After forming a BOS (Break of Structure) and a small consolidation (highlighted box), price is expected to move higher.
Entry:
Long position initiated slightly above the consolidation zone.
Stop Loss (SL):
Set at 3304, just below the recent weak low support.
Target (TP):
Final target at 3326, where a key resistance level lies.
Key Levels:
Support Zone: 3304 (Weak Low)
Resistance Levels:
3317.5
3222.9
3326.2 (Final Target)
Market Structure Notes:
CHoCH (Change of Character) indicates potential shift to bullish momentum.
Price is expected to form higher highs and higher lows on its way to the target.
Goldlong

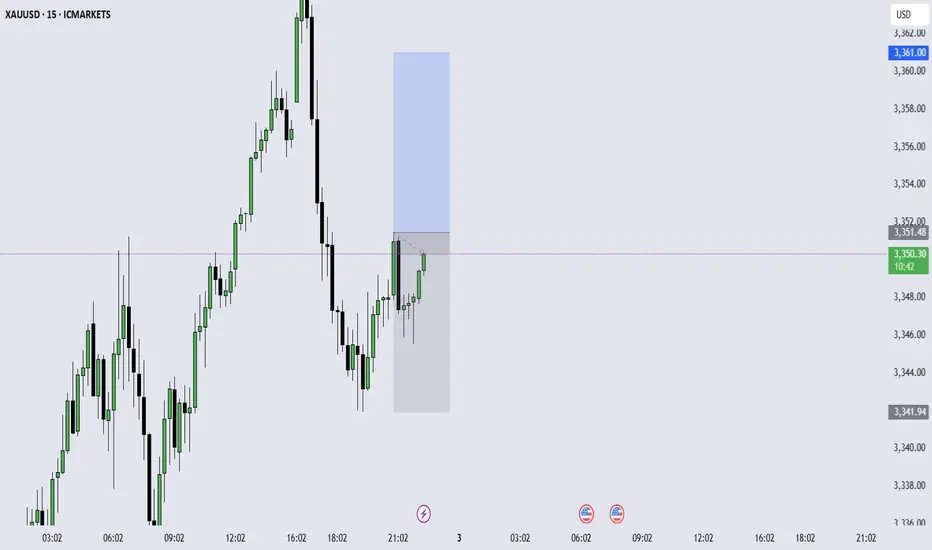
GOLD swing longPlacing bids for potential 1-2 setup to the upside, grey box is ideal target for this setup to trigger however scaling in on spot won't hurt

GOLD/USD Bearish Rejection From Resistance Zone – Potential DropGOLD/USD Bearish Rejection From Resistance Zone – Potential Drop Ahead! 🎯
📊 Technical Analysis Summary:
The chart illustrates a bearish setup forming after multiple rejection points near a key resistance zone around 3,360–3,380 USD.
🔍 Key Observations:
🔴 Double Rejection Pattern:
Red arrows highlight strong bearish rejections from resistance.
Indicates sellers are defending this zone aggressively.
🟠 Support Turned Resistance:
The previous support (labelled as "SUPPOT") is now acting as resistance.
Classic bearish retest behavior.
🔷 Bearish Flag Formation:
Price consolidates in a descending flag pattern.
Breakdown below the flag suggests continuation to the downside.
🎯 Target Zone:
If breakdown confirms, price may drop towards target area near 3,275–3,280 USD (marked as “TARGET FAXS”).
🟧 Important Reaction Zones:
Multiple orange circles indicate zones of high reaction – historically significant for both buyers and sellers.
📌 Conclusion:
Unless bulls reclaim the 3,360–3,380 resistance zone convincingly, the bias remains bearish, and the next leg down may target the 3,280 USD area.
🔔 Traders should watch for a clean break below 3,320 to confirm bearish continuation.

XAUUSD Weekly Chart Buying area📊 XAU/USD (Gold) Price Analysis – 4H Chart
🕒 Date: July 6, 2025
🔍 Technical Overview:
Gold is currently trading around the $3,337 level, showing signs of consolidation after a recent bounce.
🔸 Key Zones:
🟡 Resistance Area 1: $3,295 - $3,310
🟡 Resistance Area 2: $3,250 - $3,270
🟡 Target Zone: $3,390 - $3,410
📈 Possible Scenarios:
Price may retrace to the $3,295 - $3,310 resistance area, hold support, and aim for the $3,390 - $3,410 target zone.
A deeper pullback to the lower $3,250 - $3,270 resistance turned support area may occur before a stronger bullish move.
Breakout confirmation will come on a clean close above the $3,337 level with volume.
📌 Bias: Bullish above the $3,295 level
📌 Watch for: Bullish price action or liquidity grabs near support zones
💡 This setup is based on structure, liquidity zones, and institutional footprints.

This week's market review and next week's market strategy analys
Gold trading has ended this week. This week can be said to be very exciting. It closed with a positive line this week, with the lowest point near 3247, and then rebounded to 3365 and then retreated. When the non-farm data were all negative, the lowest point fell to 3311 and rebounded. Gold did not fall below the support of 3300. This shows that the gold bulls are still there. We also went long at the bottom many times after the non-farm data. I believe that traders who follow me can see that we have publicly gone long at 3324 many times and exited with all profits. We firmly believe that the retracement is an opportunity to go long, and the market result is just as I analyzed. The bulls returned to the range before the non-farm data. Since the market is closed on Friday for Independence Day, the overall fluctuation of gold will not be large. We will continue to be bullish on gold next week, and the operation will continue to be mainly based on retracement and long. If your current gold operation is not ideal, I hope I can help you avoid detours in your investment. Welcome to communicate with me.
From the 4-hour analysis, pay attention to the 3324 support line below, focus on the 3316 support line, and pay attention to the 3345-50 short-term resistance above, and focus on the 3365-70 line suppression. The overall low-multiple cycle participation main tone remains unchanged. In the middle position, watch more and do less, be cautious in chasing orders, and patiently wait for key points to participate. I will release signals on the free channel for specific operation strategies, and pay attention in time.
Gold operation strategy:
Gold 3324-30 line long, stop loss 3315, target 3365-70 line, continue to hold if broken

Gold - The final resistance breakout!Gold - TVC:GOLD - prepares a final rally:
(click chart above to see the in depth analysis👆🏻)
Over the past 12 months, Gold rallied more than +70%. However the past three months clearly rejected a major horizontal resistance. But price action on the smaller timeframe remains incredibly bullish. Therefore an all time high breakout will most likely follow.
Levels to watch: $3.500
Keep your long term vision!
Philip (BasicTrading)

Go short before breaking 3350, go long before falling to 3320📰 News information:
1. Geopolitical situation
2. Tariff implementation and interest rate cut bill
📈 Technical Analysis:
As I said, the US stock market closed early today, and the market will lack some momentum. It is difficult to have a large fluctuation. It is expected to fluctuate and consolidate. I also explained in the previous post that the upper pressure in the short term is at 3340-3350. If it is touched, we can try to short and defend 3360. If it falls back to 3323, we can try to go long for the first time. If it continues to fall, it is expected to reach 3315-3305. Therefore, if it first touches 3323, go long, SL 3316, and consider going long if it touches 15-05 below.
🎯 Trading Points:
SELL 3340-33350
TP 3330-3320-3310-3300
BUY 3323
TP 3333-3340-3350
BUY 3315-3305
TP 3325-3333-3340
In addition to investment, life also includes poetry, distant places, and Allen. Facing the market is actually facing yourself, correcting your shortcomings, confronting your mistakes, and strictly disciplining yourself. I hope my analysis can help you🌐.
TVC:GOLD OANDA:XAUUSD FX:XAUUSD FOREXCOM:XAUUSD PEPPERSTONE:XAUUSD FXOPEN:XAUUSD

U.S. stocks are closed, how to operate gold volatility📰 News information:
1. Geopolitical situation
2. Tariff implementation and interest rate cut bill
📈 Technical Analysis:
Gold has maintained a volatile pattern recently, lacking a sustained unilateral trend. The unclear short-term direction of DXY has limited the volatility of gold. The market has repeatedly shown a mixture of high-rise decline and downward recovery. It is unable to effectively break through the previous high and lacks the momentum to break downward. The short-term pressure during the day is concentrated on the 3340-3345 line, and the upper middle track is at 3350. If it fails to effectively break above 3350, then gold may fall further. On the contrary, if it can stand above the middle track 33350, then gold may rise further. The short-term support below is near the 3323 line. If it fluctuates during the day, maintain a high-altitude low-multiple cycle.
🎯 Trading Points:
SELL 3340-3350
TP 3330-3320-3310
BUY 3320-3310
TP 3340-3350
In addition to investment, life also includes poetry, distant places, and Allen. Facing the market is actually facing yourself, correcting your shortcomings, confronting your mistakes, and strictly disciplining yourself. I hope my analysis can help you🌐.
FXOPEN:XAUUSD PEPPERSTONE:XAUUSD FOREXCOM:XAUUSD FX:XAUUSD OANDA:XAUUSD TVC:GOLD

XAUUSD Consolidates Below Resistance – A Breakout Imminent?On the 4-hour timeframe (H4), XAUUSD is clearly consolidating just below the key resistance zone near $3,366, forming higher lows and lower highs within a tightening range highlighted by the shaded area.
1. Key Price Action Highlights
Price has been forming higher lows, suggesting growing bullish momentum.
The $3,366 resistance remains intact – a breakout above this level could confirm bullish continuation.
A visible double bottom (W pattern) formed around June 28 hints at a strong technical rebound after a correction phase.
2. Important Support and Resistance Levels
Price Level
Significance
$3,366 – $3,380
Major resistance zone – likely breakout target
$3,300
Key near-term support where price recently bounced
$3,242
Deeper support – a breakdown here could confirm bearish reversal
3. Suggested Trading Strategy
Buy on breakout above $3,366 with strong volume and clear confirmation (e.g., a large-bodied candle closing above resistance).
Consider buying on a pullback to the $3,320 – $3,300 zone for better risk-reward.
Stay cautious if price breaks below $3,300 – this could signal a bearish shift in momentum.
Gold is currently in a tight consolidation phase under major resistance, with bullish structure still intact. A breakout above $3,366 could trigger a sharp move upward. Until then, traders should monitor the lower boundaries for potential pullbacks or invalidation signals.

Gold accumulates and breaks through 3350 points
⭐️Personal comments:
Gold price rebounded around 3350. There was no important news and bank holidays in the US session on Friday, so it rebounded in the short term
⭐️Set gold price:
🔥Sell gold area: 3365-3367 SL 3372
TP1: $3355
TP2: $3342
TP3: $3330
🔥Buy gold area: $3311-$3313 SL $3306
TP1: $3325
TP2: $3338
TP3: $3350

Gold fluctuates during the day, short-term profits will be left
📌Main driving events of gold
The big non-agricultural data in the United States caused the gold price to fall by almost 40 US dollars in one breath, but after a short emotional storm, the market returned to calm. Today's market began to bottom out and rise. As of now, the non-agricultural market has been backed by 50%, and the energy of the shorts has been basically digested. Next, the bulls will start to exert their strength! Today's direction is still the same and continue to be bullish!
📊Comment analysis
In the US market, the gold price rebounded after the decline and the bottom of the second retracement appeared. The support level is 3322. After a night of fluctuations, gold has begun to rise, and the low point has begun to rise. The key point of the day is still 3323. In the morning, we wait for the gold price to fall back to around 3323 and we will buy the bottom and go long. We don’t expect to surpass yesterday’s high point during the day, but at least it will go to 3350!
💰Strategy Package
Long position:
Gold long at 3322-3327, stop loss 3315, target 3350-3360
⭐️ Note: Labaron hopes that traders can properly manage their funds
- Choose the number of lots that matches your funds

MGC UPDATE 7/2/2025COMEX_MINI:MGC1! played out as expected weekly level was respected and it it clear because of BFI sponsorship Thanks for the people who gave some interest to my last post always happy to help another fellow trader
www.tradingview.com

Will the NFP impact cause the bear market to dominate?📰 News information:
1. Initial jobless claims and NFP data
2. The final decision of the Federal Reserve
📈 Technical Analysis:
In the previous post, I have stated that if the hourly line closes above 3320, gold will fall into high consolidation in the short term. Currently, gold fluctuates narrowly in the short term. I think now we just need to be patient and wait for key points to enter the market. The daily and weekly lines clearly show that the high point of the oscillation range is constantly moving up, and the center of gravity continues to rise. The current market is quietly accumulating momentum, and a new round of weekly and monthly lines are about to rise. Therefore, first of all, I will pay attention to the defensive point below 3320, and then refresh the point below is the previously mentioned 3315-3305. If the point below is touched to get effective support, you can consider going long. Bros who trade independently must strictly set TP and SL to avoid the impact of market fluctuations.
🎯 Trading Points:
BUY 3320-3315-3310
TP 3330-3340-3360
In addition to investment, life also includes poetry, distant places, and Allen. Facing the market is actually facing yourself, correcting your shortcomings, confronting your mistakes, and strictly disciplining yourself. I hope my analysis can help you🌐.
FXOPEN:XAUUSD PEPPERSTONE:XAUUSD FOREXCOM:XAUUSD FX:XAUUSD OANDA:XAUUSD TVC:GOLD

NFP unexpectedly broke out, where will gold go?📰 News information:
1. Initial jobless claims and NFP data
2. The final decision of the Federal Reserve
📈 Technical Analysis:
The unexpectedly negative NFP data caused a sudden plunge in gold prices, which forced me to terminate the transaction urgently. Currently, gold has not fallen below the 3,300 mark. Therefore, I will still pay attention to the closing of the hourly line. If gold closes below 3,320, the downward trend will continue. On the contrary, if it closes above 3,320, gold will consolidate at a high level in the short term. Two days ago, I gave the support level of 3315-3305 below. Please be cautious in trading at the moment.
🎯 Trading Points:
For now, let’s focus on the hourly closing situation
In addition to investment, life also includes poetry, distant places, and Allen. Facing the market is actually facing yourself, correcting your shortcomings, confronting your mistakes, and strictly disciplining yourself. I hope my analysis can help you🌐.
TVC:GOLD OANDA:XAUUSD FX:XAUUSD FOREXCOM:XAUUSD PEPPERSTONE:XAUUSD FXOPEN:XAUUSD

XAU/USD 4H – Retracement or Rejection? Key Levels to WatchGold bulls made a strong push out of the descending channel, but now the real test begins. The market is currently in retracement mode after a sharp impulse, and the next move will be decisive.
🔹 Channel Breakout & Retest in Play:
Price broke out of the descending channel with momentum and hit the $3,357 region before pulling back. We're now hovering around the 0.236 Fib at $3,331 — with the 0.382 and 0.618 Fib zones below offering potential long entry confluence.
🔹 Fibonacci Cluster Support Zone:
Between $3,314 – $3,287 lies a high-probability demand zone, where multiple Fibonacci levels converge with the broken channel top. This area also aligns with the 50 EMA, creating a pocket for bullish continuation — if held.
🔹 RSI Divergence to Watch:
RSI shows signs of slowing bullish momentum after peaking, which suggests this retracement could deepen toward the 0.5–0.618 levels before any meaningful bounce. A bullish RSI reversal in this zone would confirm re-entry.
📌 Scenario 1 – Bullish Continuation:
Price finds support between $3,314–$3,287
Momentum kicks in for a leg up toward $3,388
Final TP at $3,427 (Fib -0.618 extension)
📌 Scenario 2 – Rejection and Deeper Drop:
Failure to hold the 0.5 zone flips the bias bearish
Watch for re-entry back into the previous channel
Next downside target: $3,251 and potentially $3,233–$3,221 (Fib + extension)
💡 Elite Insight:
The pullback is not the risk — entering without a plan is. This is the zone where patience meets precision. Let the levels do the work.

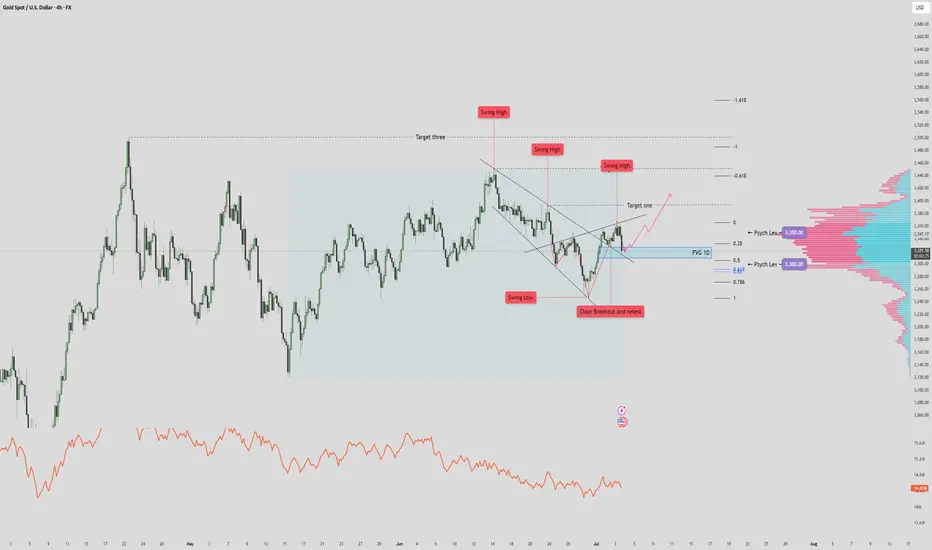
XAUUSD $3500 Recovery? Reverse Heads and Shoulders? 🔎 STRUCTURE & TECHNICAL ELEMENTS
1. Pattern:
A falling wedge was formed and broken cleanly to the upside → bullish reversal structure.
Breakout was followed by a successful retest at prior structure lows (marked “Clear Breakout and Retest”).
2. Fair Value Gap (FVG 1D) Zone:
Currently being tested. This zone coincides with:
Minor support from prior consolidation
Fib retracement (0.5 level)
Potential demand area (watch for bullish reaction/candle structure here)
3. Volume Profile:
3,350 = POC (Point of Control) → heavy resistance.
3,300 = Secondary HVN → strong support below current price.
Low-volume nodes just under current price → if broken, price likely accelerates into the GP zone.
4. Fibonacci & Liquidity Confluence:
Golden Pocket (3287) just below 3,300 = ideal liquidity draw if FVG fails.
Target 1 / 2 / 3 above are Fibonacci-based projections + historical swing zones.
✅ SCENARIO 1: Bullish Case – FVG Holds
If price respects the FVG 1D zone, expect:
Continuation up toward Target One (~3,430)
Extension to Target Two (~3,470) and even Target Three (~3,540+) possible
Confirmation: Bullish engulfing / high-volume bounce / sweep of intraday lows without close below FVG
Bias: Bullish continuation as long as price holds above FVG/0.5 Fib
🚨 SCENARIO 2: Bearish Case – FVG Breaks Down
If price closes below FVG zone, particularly below 3,312:
High probability drop toward 3,300 (psych level)
Liquidity sweep and deeper correction into Golden Pocket (~3,287) likely
This area can act as a high-probability long re-entry zone
Bias: Short-term bearish if close below FVG + swing structure invalidation
⚖️ REFINED SUMMARY
Price rejects off FVG - we can expect target 1 and 2 tagged.
Price breaks & closes below FVG zone - we can expect it to drop/wick to 3,300
Gold non-agricultural layout strategy
💡Message Strategy
Small non-farm data "big surprise"
The ADP employment report released on Wednesday showed that the number of private employment in the United States decreased by 33,000 in June, the first decline since March 2023. Economists surveyed previously expected the number to increase by 100,000 on average.
The ADP employment report showed that the number of private employment in the United States fell for the first time in more than two years in June, indicating that the Federal Reserve may cut interest rates as early as September.
Spot gold closed up $18.20 on Wednesday at $3,356.90 per ounce.
Bednarik pointed out that gold has gained upward momentum recently, with a gold price target of $3,373.50 per ounce. The "big surprise" of the ADP data suggests a weak non-farm payrolls report in June.
📊Technical aspects
1. The daily line was the support line for the rise in the previous month. It fell back very hard last week and turned into suppression. It was tested repeatedly and finally a big Yin hit the lower track of the pattern. However, it started at a low point this week and rose steadily. Now it has returned to the top of the lifeline again. At this point, the space will consider switching again.
2. The four-hour pattern opens slightly upward, with the lifeline 3330 as the dividing line between strength and weakness. Hold here and climb upward step by step.
3. The double lines on the hourly chart formed a dead cross after breaking through and turning into pressure last week, which helped to further increase the volume and fall by more than 100 US dollars. After breaking through and standing on it this time, it turned into support. The double line range is 3332-3342. This area is used as the boundary to switch between the upper and lower spaces. The support line for the bulls to dominate is the upper rail position of 3332, and the support line for the bulls to sweep is the lower rail position of 3316
💰Strategy Package
Long Position:3332-3340,SL:3316,Target: 3400

Buying the Dip or Catching a Knife? My Gold Setup Explained.Entered a long position on XAU/USD from the 1H demand zone following sharp intraday selling into a key support level. With gold hovering near $3,300 and a significant testimony from Fed Chair Powell on deck, the setup aligns with both technical rebound potential and fundamental uncertainty that could fuel upside.
The goal here is to play the liquidity vacuum left after aggressive positioning was cleared, with tight invalidation and asymmetric reward.
Technicals:
• Entry aligned with prior price inefficiency and confluence of multiple demand zones
• 1H structure shows clear deviation below the range with immediate buy-side response
• EMA channel flattening, indicating potential compression ahead of expansion
• First target: $3,352
• Risk-managed with defined stop-loss below $3,260
Execution Note: This is not a “hold forever” trade. It’s an opportunistic reaction to unwind + sentiment imbalance.
Fundamentals
• Gold saw a 25% surge in 2024 due to safe-haven demand and dovish policy, but enters 2025 under pressure from:
▫️ A strong USD
▫️ Higher cost of carry
▫️ Speculators taking profit
• Fed policy remains the core variable:
▫️ A hawkish tone from Powell could weigh on price
▫️ Rate cuts would likely revive bullish momentum
• Central bank demand remains supportive
• Geopolitical tensions (Russia-Ukraine, Israel-Iran) could trigger safe-haven bids again.
Bearish headwinds:
• Waning bullish momentum per RSI divergence
• Reduced rate cut expectations post-election
• Powell’s testimony could revive volatility either way.
This is a short-term tactical long, not a macro bet. With sentiment temporarily overextended and key support defended intraday, this is a high R/R window to exploit Powell-related volatility.
Let’s see how price reacts into $3,350+. Any sustained strength there would open room toward $3,400, while failure would confirm a retest of $3,260s.
Note: Please remember to adjust this trade idea according to your individual trading conditions, including position size, broker-specific price variations, and any relevant external factors. Every trader’s situation is unique, so it’s crucial to tailor your approach to your own risk tolerance and market environment.

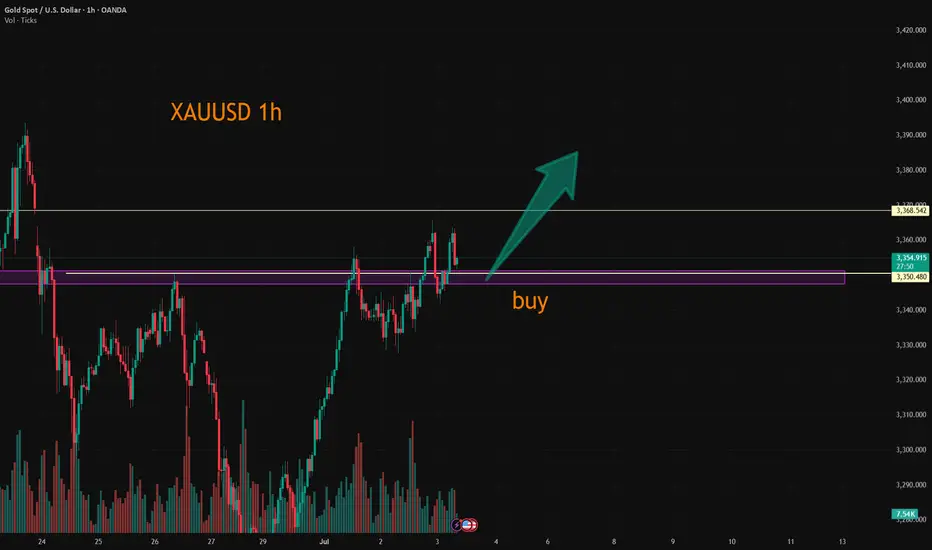
XAUUSD:A long trading strategy
The highest gold price in the Asian session reached 3365.4, which is already our mid-line target range. If you have completed and left the market, congratulations, because I personally set the TP point of 3368, so it did not touch, the trend of the past two days is appropriate rewithdrawal after strengthening, the high is also gradually rising, the overall long trend has not changed. For today's data, the probability will make gold prices continue to rise, trading ideas or to do the main.
Trading Strategy:
BUY@3347-51
TP:3365-70
This TP range is also the target range of the median trader, for friends who do not have automatic stop profit, you can take a profit manually at that time.
More detailed strategies and trading will be notified here ↗↗↗
Keep updated, come to "get" ↗↗↗
Gold Breakout Retest – Will PRZ Trigger the Next Rally?Gold ( OANDA:XAUUSD ) attacked the Resistance lines and Resistance zone($3,350-$3,326) as I expected in yesterday's idea .
Gold seems to have broken the Resistance zone($3,350-$3,326) and Resistance lines and is pulling back to this zone.
In terms of Elliott Wave theory , Gold appears to have completed wave 3 and is currently completing wave 4 .
I expect Gold to have a chance to rise back to the Resistance zone($3,394-$3,366) after entering the Potential Reversal Zone(PRZ) .
Note: Stop Loss (SL) = $3,297=Worst SL
Gold Analyze (XAUUSD), 1-hour time frame.
Be sure to follow the updated ideas.
Do not forget to put a Stop loss for your positions (For every position you want to open).
Please follow your strategy; this is just my idea, and I will gladly see your ideas in this post.
Please do not forget the ✅ ' like ' ✅ button 🙏😊 & Share it with your friends; thanks, and Trade safe.

XAUUSD:Today's Trading Strategy
Gold retreated in the sub-session, I have personally increased my long position near 3331, the overall trend is bullish unchanged, the median strategy is patient to rise. If you are trading short, you can go long at 3325-3330 and leave at 3340-45. The same can be said if you want to solve the problem; Trade according to your trading preferences and risk tolerance.
More detailed strategies and trading will be notified here ↗↗↗
Keep updated, come to "get" ↗↗↗

XAUUSD Set for Strong Bullish Wave – Targeting 3,726?Gold (XAUUSD) is showing signs of a bullish recovery after a recent correction between the 3,290–3,340 USD zone. On the daily chart, a clear Elliott Wave formation is unfolding, with the price potentially entering wave 5 aiming for the 0.618 Fibonacci extension at 3,726 USD.
Clear Wave Structure:
The a-b-c corrective wave appears to have completed in mid-May.
The price is now in wave 3 and preparing for a potential extension in wave 5.
Candlestick and Buying Momentum:
Recent candles show strong buying pressure with four consecutive bullish sessions.
The current upward momentum is testing the 3,352 resistance – a breakout could open the path to 3,450 and eventually 3,726 USD.
Support & Resistance Levels:
Immediate support: 3,320 – 3,330 USD
Key resistance: 3,450 USD (recent swing high)
Extended target: 3,726 USD (Fibonacci 0.618 from wave 2 low to wave 3 peak)
Suggested Trading Strategy:
Favor buy on dip strategy, waiting for a minor pullback to the 3,330–3,340 area before entering long.
Set stop-loss below 3,300, with targets at 3,450 and 3,726 USD respectively.
Conclusion:
The XAUUSD chart suggests a potential strong bullish wave according to the Elliott Wave framework, with a breakout likely leading to the 3,726 USD zone. Traders should closely monitor price action around the 3,350 level for confirmation of continued upward momentum.
What’s your view on this analysis? Drop a comment and let’s discuss your trading strategy together!
