Long Trade Setup: XAUUSD 🟡 Trade Setup: XAUUSD (Gold Spot / U.S. Dollar)
Timeframe: 1H
Bias: Bullish Reversal
Type: Liquidity Trap Breakout
Instrument: Gold / USD
---
🧠 Step 1: Market Context
Gold has been in a downtrend, forming consistent lower lows. Recently, it broke below a key support level, making it appear like further downside is coming. However, price has since moved sideways, suggesting loss of bearish momentum.
---
🎯 Step 2: Liquidity Trap Detected
This breakdown below support seems to be a false move, possibly engineered to:
Trigger stop-losses below the previous low
Attract sellers expecting further downside
Create sell-side liquidity for institutions
This pattern is known as a liquidity trap or stop hunt.
---
📏 Step 3: Confirmation from Price Action
A descending trendline breakout is visible on the 1H timeframe.
Price broke out, retested the trendline, and is now showing bullish candles.
This signals potential accumulation and trend reversal.
---
💼 Step 4: Trade Details
Entry: 3,393.73
Target (TP): 3,500.41
Stop Loss (SL): 3,351.50
Risk to Reward Ratio: ~2.5:1
This trade offers a solid risk-managed setup, ideal for intraday to short-swing traders.
---
🔍 Step 5: What to Watch For
Watch for bullish continuation above 3,400.
If price closes above 3,420, breakout buyers may join in.
If price drops below 3,375, exit and reassess.
---
📌 Summary
This trade banks on the idea that smart money is accumulating positions while retail traders are trapped short. The risk-reward ratio is favorable, and technical signals align for a potential upside move.
XAUUSD, Gold analysis, Liquidity trap, Stop hunt, Trend reversal, Technical analysis, Gold breakout, Smart money move
#XAUUSD #Gold #Breakout #LiquidityTrap #TechnicalAnalysis #SmartMoney
#Forex #TradingView #GoldAnalysis #PriceAction #TrendReversal #RiskReward
Goldlong

Current Gold Trend Analysis and Trading RecommendationsOn Tuesday, gold dipped to around $3,374 in the early trading session, then rebounded to the intraday high. In the U.S. trading session, it is currently quoted at about $3,388, approaching the psychological level of $3,400. From the 4-hour chart of gold, the current upward momentum remains intact. The support below is focused on around $3,350, and the strong support is highlighted in the $3,350-$3,330 area, which is also the position of the 5-week moving average. Only by breaking the $3,350 area is there hope to reverse the trend and fall completely. If it does not break here, the bulls may still repeat.
Regarding the current trend, gold tends to continue to test the bottom and then rebound, maintaining a large range of sweeping. In terms of operation, it is recommended to go long when gold rebounds to the vicinity of 3370-3360, with the target looking at the 3490-3400 range. The short strategy is to go short near 3400, with the target looking at the 3370-3350 line.
XAUUSD
buy@3370-3360
tp:3390-3400
sell@3395-3400
tp:3370-3350
Investment itself is not the source of risk; it is only when investment behavior escapes rational control that risks lie in wait. In the trading process, always bear in mind that restraining impulsiveness is the primary criterion for success. I share trading signals daily, and all signals have been accurate without error for a full month. Regardless of your past profits or losses, with my assistance, you have the hope to achieve a breakthrough in your investment.

Wide range fluctuations continue, the latest layout of gold📰 Impact of news:
1. Initial jobless claims data
2. US-Iran conflict continues
3. Pay attention to the Fed's decision
📈 Market analysis:
At present, the gold price is testing the 3380 line again, and the strong support below is 3365-3355. As long as it does not fall below this key support, the bulls will remain strong. At the same time, the two key points of 3405 and 3420 above are still short-term resistance. Breaking through may directly test 3450. In the short term, gold fluctuates repeatedly at the 3405-3365 level, temporarily maintaining a high-altitude low-multiple cycle. There is also initial jobless claims data released today. At the same time, the geopolitical situation in the short term is severe, so we need to be cautious. In addition, the New York Stock Exchange will be closed tomorrow. The focus this week is mainly on Friday, especially when it is superimposed with the Fed's interest rate decision, we need to be vigilant about the transmission effect of sudden changes in liquidity on the market.
🏅 Trading strategies:
BUY 3380-3365-3355
TP 33395-3400-3405
SELL 3405-3390
TP 3380-3360
If you agree with this view, or have a better idea, please leave a message in the comment area. I look forward to hearing different voices.
OANDA:XAUUSD FX:XAUUSD FOREXCOM:XAUUSD FXOPEN:XAUUSD TVC:GOLD

XAUUSD:Go long
As can be seen from the chart, the decline of gold actually did not fall below 3380 each time, the actual close longer lower shadow, and from yesterday's trend can be seen 3400 is a certain pressure exists, so today to see whether this position can break through. After the break, we continue to look up, and then increase the trading range.
For now or first around the narrow range to trade.
Trading Strategy:
BUY@3378-84
TP:3395-3400
↓↓↓ More detailed strategies and trading will be notified here ↗↗↗
↓↓↓ Keep updated, come to "get" ↗↗↗

GOLD/USD Bearish Rejection at ResistanceGOLD/USD Bearish Rejection at Resistance 📉🟥
🔍 Technical Analysis Overview:
The GOLD/USD chart shows a clear bearish rejection pattern forming near the resistance zone around $3,450, marked with red arrows. After price tested this level twice, strong selling pressure appeared, resulting in a sharp decline.
📌 Key Observations:
🔴 Resistance Zone:
Price was rejected from the resistance area around $3,450 twice, indicating strong seller presence.
Double top-like behavior seen with lower highs confirming weakening bullish momentum.
🟠 Support Zone:
A well-respected support level near $3,250 has been identified based on past reaction (highlighted with orange circles).
Price previously bounced twice from this zone, validating it as a strong support level.
🎯 Target Level:
A near-term target of $3,305.586 is marked, which aligns with previous reaction zones and short-term structure support.
If momentum continues, a deeper push toward $3,250 support is probable.
📉 Bearish Bias Justified By:
Clear rejection from resistance
Lower high formation
Current consolidation with downward bias
Possible breakout to downside if $3,305 fails to hold
⚠️ Risk Note:
If price retraces and breaks back above $3,400 with volume, the bearish setup will be invalidated.
📊 Conclusion:
The chart favors bearish continuation with a primary target around $3,305, and extended downside to $3,250 if bearish pressure sustains. Traders should watch for bearish confirmation patterns below current price before engaging.
🔽 Resistance: $3,450
🔼 Support: $3,250
🎯 Target: $3,305

XAUUSD:A long trading strategy
Yesterday was affected by the easing signal gold high continued to correction, fell back to 3400 again, the trend exceeded personal expectations. Gold received another boost after the president's news, and rebounded slightly in the Asian session. In this eventful autumn, the market is subject to frequent news factors, the trend is slightly turbulent, to be ready to sweep back and forward.
Today's overall volatility is expected to have a contraction, individual expectations of the final close of the small negative line is more likely
Trading Strategy:
BUY@3380-85
TP:3404-3410
↓↓↓ More detailed strategies and trading will be notified here ↗↗↗
↓↓↓ Keep updated, come to "get" ↗↗↗

GOLD H1 Intraday Chart Update for 18 June 25Hello Traders, Welcome to the FOMC Day
as you can see that market is in tight range for now which is 3370-3400, we are still waiting for long above 3400 Psychological Level once market will clearly breaks 3400 level we consider long opportunities
if market breaks 3350 Psychological digit successfully then it will move towards 3325 first then focus will 3300 Major Support Level
All eyes on FOMC for the day
Disclaimer: Forex is Risky

Gold is under pressure! What is the key to breaking the deadlock
📌 Core driving events
The conflict between Iran and Israel has entered the fifth day. Air raid alerts in Tel Aviv are frequent. The fire on a cruise ship in the Strait of Hormuz has exacerbated the panic of energy transportation. Safe-haven buying supports gold prices;
Trump's contradictory statement of "peace talks + tough" (may send executives to meet but demand "unconditional surrender") has exacerbated the market's disagreement on the direction of the conflict, and risk aversion has fluctuated repeatedly.
The Federal Reserve will announce its interest rate decision today. The market expects it to remain unchanged at 4.25%-4.50%, but Powell's statement on rate cuts will affect the trend of the US dollar (Trump continues to pressure for a 1 percentage point rate cut).
📊Comment Analysis
1-hour chart: 3396 becomes the intraday strength and weakness watershed
The Asian morning session hit a high of 3396 US dollars and fell back. This point is the previous high pressure point. If the intraday rebound does not break through this position, the bearish thinking will be maintained;
💰Strategy Package
Set gold price:
🔥Sell gold area: 3390-33396 SL 3402
TP1: 3380 US dollars
TP2: 3375 US dollars
🔥Buy gold area: $3374-$3368 SL $3362
TP1: 3390 US dollars
TP2: 3400 US dollars
⭐️ Note: Labaron hopes that traders can properly manage their funds
- Choose the number of lots that matches your funds

Gold Pulls Back After Testing Resistance📊 Market Overview:
Gold fell to a low of $3,374 earlier today after testing the $3,434 resistance late last week. The drop was primarily due to profit-taking near recent highs, alongside a mild recovery in the US dollar. Despite this pullback, the medium-term uptrend remains supported by expectations of upcoming Fed rate cuts and persistent geopolitical tensions in the Middle East.
📉 Technical Analysis:
• Key Resistance: $3,434 – $3,450
• Nearest Support: $3,374 – $3.360
• EMA: Price remains above both EMA 09 and EMA 20, suggesting a continuation of the short-term bullish trend.
• Candlestick / Volume / Momentum:
o RSI is holding around 61–63, no longer in overbought territory.
o MACD remains positive, though upward momentum has slowed.
o Bearish candles during the Asian session suggest lingering sell pressure near $3,430. A technical rebound from $3,374 is currently underway.
📌 Outlook:
Gold may consolidate between $3,370–$3,390 in the near term. If the $3,360 support holds, a rebound toward $3,420–$3,440 is likely. However, a stronger USD could increase downside pressure.
💡 Suggested Trade Strategy:
🔻 SELL XAU/USD at: $3,410 – $3,420
🎯 TP: $3,385
❌ SL: $3,430
🔺 BUY XAU/USD at: $3,374 – $3,378
🎯 TP: $3,400 – $3,420
❌ SL: $3,360
Falling below 3380,testing 3365,the low position remains bullish📰 Impact of news:
1. Geopolitical tensions in the Middle East
2. Iran nuclear talks
3. Retail sales data
📈 Market analysis:
After rebounding to the 3400 line, gold encountered resistance and fell back to test the support level of 3380. Although it was very close to the point of 3405 we gave, I did not enter the trade because gold has been in the middle section in the short term and has not rebounded to the ideal point.
There are too many long orders at high levels in gold. The international situation is so tense that gold is still slowly declining, but the geopolitical situation is still continuing. In addition, the retail sales data is bullish. Then, as the trading strategy given at noon, it is expected to test the short-term support of 3365-3355 below. I will consider going long in this range
🏅 Trading strategies:
BUY 3365-3355
TP 3380-3390-3400
If you agree with this view, or have a better idea, please leave a message in the comment area. I look forward to hearing different voices.
TVC:GOLD FXOPEN:XAUUSD FOREXCOM:XAUUSD FX:XAUUSD OANDA:XAUUSD

Gold Potential Bullish ContinuationAfter retracing to the approx. 3370 - 3380 zone, gold still seems to exhibit signs of overall potential Bullish momentum as the price action may form a credible Higher Low with multiple confluences through key Fibonacci and Support levels which presents us with a potential long opportunity.
Trade Plan:
Entry : CMP 3393
Stop Loss : 3286
TP : 3499 (Before All Time High)

GOLD is in Retracement GOLD is in bullish trend and it can make a retracement so that would be around 3260

Buy GoldPrice is at a major Daily resistance,but becuz of the war between Israel and Iran, price may spike below to take out traders, then continue pushing upwards. However , all this is possible if this region hold support, if it does, I'd look to see a pattern been formed on the 1hr tf that indicates bullish momentum, if this doesn't happen, then there's a previous weekly resistant that price may fall in order to tap. But the most important thing is having a good psychology, that's what makes you a good trader, we can say so much about the market direction,but it should be noted that, things do change, anything can happen, so while waiting for the right setup or while anticipation for buys, only those with a strong and disciplined mindset will survive the chaos... Happy Trading 💹

Forward-looking trading, focus on 3380 support📰 Impact of news:
1. Geopolitical tensions in the Middle East
2. Iran nuclear talks
3. Retail sales data
📈 Market analysis:
Gold prices are currently in a narrow range of fluctuations again, and the signal of Iran restarting nuclear negotiations has weakened risk aversion, triggering a correction in gold prices during the session, but tensions in the Middle East remain an uncertain factor. In the short term, we still need to focus on the breakthrough of the 3380 support line. If the 3380 support line is strong, we can still maintain a long trading idea in the short term and look to 3400. On the contrary, once it falls below, it is expected to look to the 3350 line. Pay attention to the breakthrough of 3400 on the upside. If the Asian and European sessions cannot effectively break through this short-term resistance, gold will continue to fluctuate.
🏅 Trading strategies:
BUY 3380-3370
TP 3390-3400-3450
SELL 3400-3390
TP 3380-3370-3350
If you agree with this view, or have a better idea, please leave a message in the comment area. I look forward to hearing different voices.
OANDA:XAUUSD FX:XAUUSD FOREXCOM:XAUUSD FXOPEN:XAUUSD TVC:GOLD

Gold on the Rise! – Bullish Setup in Focus The chart shows a repeating consolidation‑then‑breakout pattern, with Gold forming ascending swing structures, consolidating in rectangles (green), then riding higher along a rising trendline (purple). Price has just bounced off that trendline again, signaling a possible new leg up—potentially targeting the upper range near $3,448–3,450. A clear breakout above that level could open the door toward $3,500+.
📍 Trading Plan
🎯 Entry
Long on breakout above recent consolidation highs (~$3,440–3,448).
Alternatively, buy the dip near the purple trendline (~$3,385–3,390), with confirmation (hammer candle, bounce).
🛑 Stop‑Loss
For breakout: just below the top of the rectangle consolidation (~$3,389).
For trendline entry: slightly below recent swing low (~$3,358–3,360).
🎯 Profit Targets
Primary: upper rectangle level (~$3,448–3,450).
Extension: historic all‑time high region (~$3,500) → next major zone.
🎥 Path
Potential minor pullback toward trendline.
Bounce establishes support.
Surge toward top of range.
Breakout with trend continuation to new highs.
📊 Trade Risk & Reward
Target ~60–100 pts above entry, stop ~50 pts below → ideal Risk:Reward ≥ 1:1.2.
📌 Key Levels to Monitor
Level Role
$3,360 Swift dip support (green base line)
$3,390–3,400 Trendline confluence zone
$3,440–3,450 Breakout area & top of rectangle
$3,500 Next major resistance/all‑time high
🧭 Market Context & Drivers
Broad uptrend remains intact amid geopolitical tensions, especially the Israel–Iran situation, which continues to support safe-haven flows
Markets are positioning ahead of Fed’s June 18 decision; dovish signals could fuel continuation toward new highs (~$3,500+)
.
Technical structure reflects bullish momentum—ascending wedge patterns with shallow dips and strong trendline bounces
.
✅ Summary
Bias: Bullish – uptrend intact.
Strategy: Go long on dip near trendline or on breakout above $3,445.
Stop‑Loss: Just below last swing low ($3,360).
Targets:
Near-term: $3,448–3,450
Medium-term: $3,500+

GOLD/USD Bearish Rejection at Resistance ZoneGOLD/USD Bearish Rejection at Resistance Zone 📉🟥
📊 Technical Overview:
The chart for GOLD/USD shows a clear price action behavior between a well-defined resistance zone (~3,480–3,510) and a support zone (~3,260–3,280).
🔻 Bearish Signals:
The price has tested the resistance zone multiple times (highlighted with red arrows and orange circles) but failed to break above it, indicating strong selling pressure.
The current price action suggests another lower high formation, which is a bearish signal 📉.
Recent candles are rejecting the upward move, pointing to potential downside movement.
🟩 Support Confirmation:
Previous reactions from the support zone (green arrows) show that buyers have consistently stepped in near the 3,260–3,280 range.
This level remains a key demand zone where a bounce might be expected.
🔁 Outlook:
If the price continues to reject the resistance and follows the pattern, we might see another drop towards the support area.
A break below the support zone would confirm a bearish breakout and could open the door to deeper downside targets.
📌 Conclusion:
GOLD/USD is trading within a range, but the repeated failures at resistance suggest bearish momentum might take control in the short term. A move back toward the support zone is likely unless a breakout above resistance occurs.
📉 Resistance: 3,480–3,510
🟩 Support: 3,260–3,280
🔍 Bias: Short-term Bearish unless resistance breaks

GOLD Intraday Chart for 17 June 25Hello Traders,
as you can see that market was going down very badly and it's actually stuck below 3400 Psychological Level
Definitely we are sellers now as long as market sustain below 3400 Psychological Level
below 3380 level GOLD will move towards 3360 or even 3350
Disclaimer: Forex is Risky

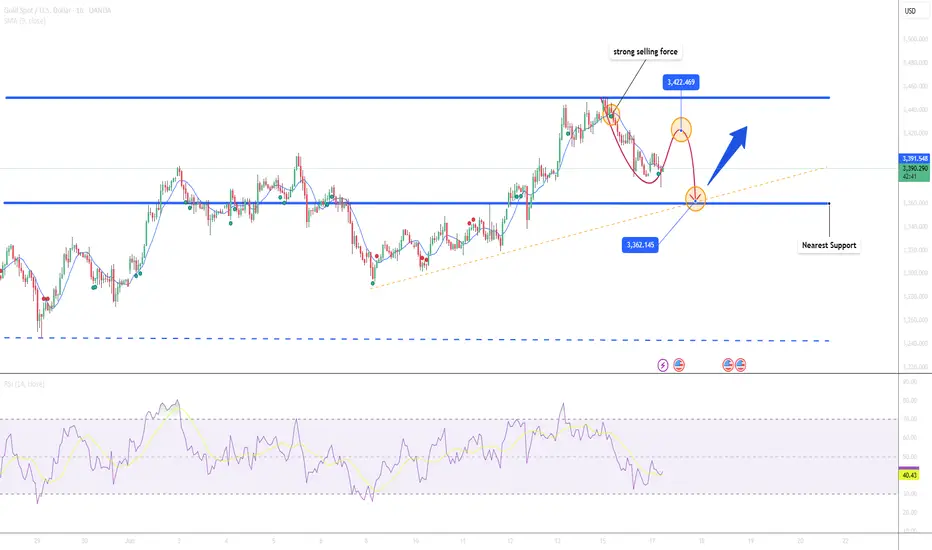
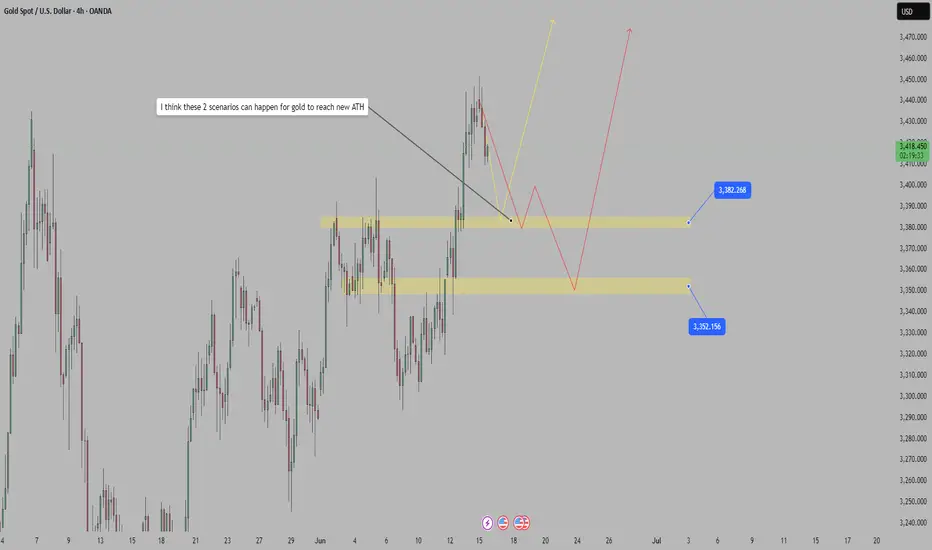
I think these 2 scenarios can happen for gold to reach new ATHGold supported by Israel-Iran conflict, US intervention in focus
Gold's sharp rise came late last week after Israel struck multiple targets in Iran, including Tehran's nuclear facilities.
The attack sparked fierce retaliation from Iran, which launched a barrage of missiles at key Israeli targets, including the financial capital Tel Aviv. Some of the Iranian missiles were also seen penetrating Israel's "Iron Dome" defense system.
What do you think?
Best regards, StarrOne !!!
Gold Price Analysis June 16There is not much surprise when the price gap up appeared on Monday morning
there is no barrier that can stop the price of gold from increasing towards ATH.
Gold has a slight correction in Tokyo session after the price gap up touched the round resistance zone 3450.
The correction may extend to 3413 in European session. This is a BUY zone with the expectation that Gold will regain the ATH hook. If broken, there will be some Scalping buy zones but the risk is quite high so to be safe, wait for 3398.
3463 acts as temporary resistance for a reaction period before Gold returns to the all-time high. Maybe before 3490 there will be another price reaction before reaching the top.

GOLD- XAU-USD Hello Traders! The GOLD MARKET is on fire! 🚨🔥
XAUUSD has officially broken above the key resistance zone — this is not just a move, this could be the start of something BIG! 💥📈
Is this the golden breakout we’ve been waiting for, or just a short-lived spike?
Are we heading toward the next major target, or is a pullback on the horizon? 🎯🔍
Your insights matter — comment below with your analysis and let’s decode this golden move together!
Stay sharp, stay golden! ⚔️💰
#XAUUSD #GoldBreakout #ForexTraders #MarketMomentum #GoldAnalysis #TradeSmart

3400 3380 are the two points that determine the trend of gold📰 Impact of news:
1. Geopolitical risks
2. Expected Fed policy
📈 Market analysis:
This week, the Federal Reserve's policy meeting, retail sales data, initial jobless claims and geopolitical situation will be the core factors affecting global markets. In the short term, gold rebounded after hitting the 3383 line. This round of decline was relatively rapid. At the same time, there is a certain resistance at the 3405-3410 line above in the short term, which is also the main reason for our long orders to leave the market. In the short term, it is recommended to first look at the support situation at the 3380 line below, and then enter the long order after obtaining effective support above this position. On the contrary, if it falls below this short-term support, the gold price is expected to fall to the 3350 mark! For the evening layout, it is recommended to focus on the 3400 long-short watershed, pay attention to the 3410 line of resistance, and pay attention to the 3380 line of support below.
🏅 Trading strategies:
BUY 3390-3380
TP 3400-3410-3420
SELL 3400-3390
TP 3380-3360-3350
If you agree with this view, or have a better idea, please leave a message in the comment area. I look forward to hearing different voices.
TVC:GOLD FXOPEN:XAUUSD FOREXCOM:XAUUSD FX:XAUUSD OANDA:XAUUSD

XAU/USD Bullish Continuation SetupThe chart illustrates a bullish market structure for XAU/USD, with price action currently trending upwards. Key technical observations:
Support Zone:
Price has recently bounced from a support zone around 3,399.710, indicating strong buying interest.
Bullish Projection:
A bullish continuation is expected. The chart outlines a potential scenario with a minor retracement towards 3,432.835 or 3,399.710, followed by a strong upward move.
Targets:
Immediate resistance is around 3,502.669.
If broken, price may aim for 3,550.351.
Final projected target lies near 3,680.000, which aligns with a historical supply zone.
Indicators:
The green enveloping bands suggest increasing volatility, with the price respecting the upper band, supporting bullish momentum.
Conclusion:
XAU/USD appears poised for a bullish breakout continuation. A potential pullback could offer a buy opportunity, targeting higher resistance zones as long as the structure remains intact

Gold Outlook: Bulls Defend Support Amid Rising Geopolitical RiskGold (XAU/USD) remains within a strong bullish structure on the 4-hour chart, trading inside an ascending channel. Recently, price attempted to break above the key resistance near $3,450 but failed, leading to a minor pullback toward the mid-channel area around $3,428–$3,430, where buyers are currently defending support. The key support remains at $3,394–$3,400, which also coincides with the ascending channel’s lower boundary.
As long as price holds above this level, the bullish trend remains intact, and there is potential for a breakout above the $3,450 resistance zone. If a breakout occurs and price closes above $3,450 on the 4-hour chart, the next bullish targets would be around $3,475 and then $3,500–$3,510. On the downside, if price fails to hold $3,394, it may trigger a short-term bearish correction toward the next support zone around $3,380–$3,370.
Overall, gold is currently in a consolidation phase inside the $3,394–$3,450 range, with a bullish bias above $3,394. A breakout above $3,450 may trigger strong upward momentum, while a break below $3,394 could open the door for a deeper correction.
🔑 Key Levels
Support: ~$3,394–$3,400 (channel floor) and intermediate support at $3,430–$3,440 .
Resistance: Immediate resistance zone is $3,445–$3,450, with broader upside potential toward $3,500+ if that break occurs.
Note
Please risk management in trading is a Key so use your money accordingly. If you like the idea then please like and boost. Thank you and Good Luck!
