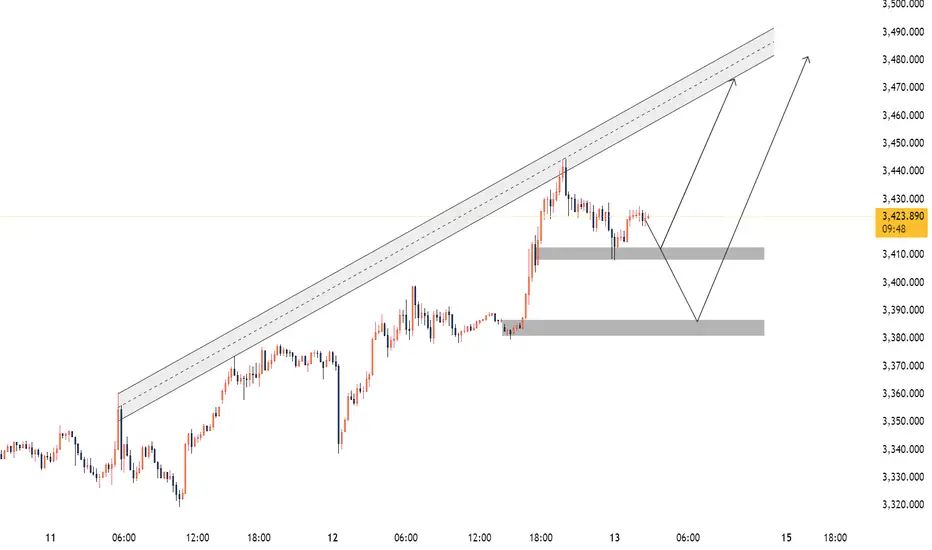
Gold/XAUUSD Possible Move 13 June 2025 The market continues to exhibit strong bullish momentum within a well-respected ascending channel. After an impulsive breakout to the upside, price is now retracing in a healthy corrective move, offering high-probability buying opportunities at two well-defined demand zones.
🔍 Technical Structure:
Price is trending inside an ascending parallel channel, with clear respect for both the median and outer trendlines.
A significant bullish impulse pushed price above previous local highs, suggesting institutional interest and continuation potential.
Currently, price is retracing and approaching two key demand areas that align with bullish continuation setups.
🎯 Key Buy Zones:
✅ Zone 1: 3,408 – 3,412
Minor mitigating demand zone, likely to act as support if the market retraces slightly.
Ideal for aggressive long entries if price shows confirmation (e.g., bullish engulfing, LTF structure shift).
✅ Zone 2: 3,380 – 3,385
Deeper unmitigated demand zone, aligned with a potential liquidity sweep and strong institutional support.
Considered a high-probability entry area for larger impulse moves.
🌍 Fundamental Context:
Recent geopolitical tensions in the Middle East, can lead to sharp intraday moves, with 100+ pip 5-minute candles not being out of the question.
Given this backdrop, demand zones become critical areas for smart money entries as traders seek to align technical levels with macro drivers.
📈 Trade Signal:
Bias: 🔵 Bullish
Buy Zone 1: 3,408 – 3,412
SL: Below 3,395
TP: 3425, 3440, trail till 3,470
R:R: ~1:3
Buy Zone 2: 3,380 – 3,385
SL: Below 3,368
R:R: ~1:4
🧠 Final Note:
Watch for price reaction at both zones. Use LTF confirmation before entry and respect your risk management. With news-driven volatility in play, quick movements are expected, offering excellent trade opportunities for prepared traders.
Goldlong
Gold Buy Setup📍 GOLD 4H BUY SETUP
Price bounced perfectly off a major demand zone, reclaiming structure and pushing above the Ichimoku cloud — classic bullish confirmation.
✅ Entered at 3372 with a tight SL at 3331
🎯 Targeting 3499 — key buy-side liquidity resting above recent highs
📊 Risk-to-Reward: 1:3.18 (High probability setup)
We’ve got:
Strong volume surge off demand
EMA support holding firm
Structure break + reaccumulation
📈 Eyes on wave continuation — clean long into liquidity.

Gold Bull Run: Wave 5 on the Way!
Elliott Wave Setup – We're in Wave 5, riding a powerful upward channel from the recent Wave 4 low, aiming for ~$3,500–3,600
Key Resistance & Breakout – The $3,497–3,500 area is critical. A clean breakout above this could open the next leg toward ~$3,600–3,700, echoing forecasts from ANZ and Cantor .
Support Level – Immediate support lies around the $3,392 area (recent resistance turned support). A dip back to $3,420–3,440 could provide a strong buying opportunity.
Macro Drivers – Geopolitical tensions (especially in the Middle East) and a soft U.S. dollar are fueling safe-haven buying, matching broader bullish sentiment
.
📈 Outlook: Minor pullback expected, then resumption of rally. Breakout above $3,500 could trigger the next surge.
🛡️ Strategy Tip: Consider buying on dips around $3,420–3,450 with resistance-based stop-loss and targets at $3,500 then $3,600–3,700.

GOLD Intraday Chart Update For 13 June 25Hello Traders,
First of all congratulations to all of you as 3430-40 zone GAP filled today but sad new is war scenarios resume
so advise for you is take limited risks
all eyes on 3450 Psychological level breakout, intraday expected range is 3400-3450 if markets break 3450 then it will move towards 3480
if market breaks 3400 successfully then it will move back towards 3370 or even 3355
Disclaimer: Forex is Risky

GOLD/USD Bullish Breakout ConfirmationGOLD/USD Bullish Breakout Confirmation 🚀📈
📊 Technical Analysis Overview:
The chart illustrates a bullish breakout above a well-defined resistance zone around $3,390–$3,400. Price action has decisively closed above this resistance, suggesting strong bullish momentum.
🔍 Key Observations:
🟦 Support Zone:
Marked clearly between $3,250–$3,280, this level has held firm multiple times (highlighted with green arrows and orange circles), confirming buyer interest and market structure.
🟦 Resistance Turned Support:
The previous resistance zone around $3,390–$3,400 has now potentially turned into a new support. Price retesting this zone and holding would further validate the breakout.
📈 Future Projections:
The chart anticipates a retest-pullback-continuation scenario:
Pullback to new support 📉
Bullish continuation toward $3,460+ 🎯 if support holds.
✅ Bias:
Bullish as long as price remains above the $3,390 zone. Break and hold below would invalidate the bullish setup.
📌 Strategy Tip:
Look for confirmation on the lower timeframes (e.g., bullish engulfing or pin bar) on the retest before entering long.

Gold May See Minor Pullback After Testing $3400📊 Market Development:
Gold surged to approach the $3,400 mark after U.S. Unemployment Claims came in higher than expected. The weak labor data increased speculation of an earlier rate cut by the Fed, pressuring the USD and bond yields, which in turn supported gold prices.
📉 Technical Analysis:
• Key Resistance: $3,400
• Nearest Support: $3,365
• EMA: Price remains above EMA 09 → bullish bias intact
• Candle/Volume/Momentum: Long upper wick on H1 suggests profit-taking near $3,400; declining volume may signal weakening momentum.
📌 Outlook:
Gold may experience a short-term pullback if it fails to break above $3,400 and the USD strengthens in the New York session.
💡 Suggested Trade Setup:
🔻 SELL XAU/USD at: $3,395–$3,400
🎯 TP: $3,375
❌ SL: $3,406
🔺 BUY XAU/USD at: $3,365–$3,370
🎯 TP: $3,390
❌ SL: $3,355

Gold Price Analysis June 12Yesterday's D1 daily frame bounced and closed above 3348. That led to a price gap today.
3375 is a resistance zone that is showing price reaction in the Asian session. If it cannot be broken at the end of the session, it is possible to set up a sell at 3355 for BUY strategies in the GAP zone.
Any price decrease today is considered a good opportunity for buying Gold to aim for 3411.
Pay attention to the 3355-3347-3338 zone for BUY signals today. Target is still 3411 but there is still 3386 which may have a reaction.

Gold prices soared again!Market news:
Spot gold continued to be strong in the early Asian session on Friday (June 13), and is currently trading around $3,423 per ounce. London gold prices have risen for three consecutive days, fueled by geopolitical tensions in the Middle East and the Federal Reserve's interest rate cut bets caused by the cooling of US economic data. The global financial market is in a complex environment with multiple factors intertwined, and the attractiveness of international gold as a safe-haven asset has once again become prominent.Tensions in the Middle East have become an important catalyst for the rise in gold prices. The supporting role of geopolitical risks on gold prices cannot be underestimated. Historically, whenever there is a major conflict or escalation of tensions in the Middle East, gold has often become a safe haven for funds. At present, the confrontation between Iran and the United States and the potential conflict risks of regional military bases have provided solid momentum for gold prices to rise.In the short term, gold still has strong upside potential, especially driven by geopolitical risks and expectations of interest rate cuts. However, investors need to be wary of the risk of a correction that may be brought about by inflationary pressures and uncertainty in trade policies. For long-term investors, the value of gold as a safe-haven asset in a diversified investment portfolio cannot be ignored.
Technical review:
Technically, gold maintains a strong positive structure, and yesterday's sharp rise approached the 3400 mark. The daily chart still remains above the MA10/5-day moving average, and the RSI indicator is at the 50-value axis and turns upward, and the price is in the upper track of the Bollinger band. The short-term four-hour chart moving average system maintains a golden cross opening upward, and the price gradually moves up along the MA10-day moving average, and the price is running in the upper track of the Bollinger band channel. The technical side of gold continues to fluctuate upward, with low-multiple layout as the main idea and high-altitude auxiliary. The current market is strong. If it breaks through the high on Thursday, there will be a second chance of rising on Friday. In terms of operation, keep the idea of buying on pullback. Pay attention to the support near 3407 below in the short term, and pay attention to the resistance near 3438 above. It may fall back after a strong pressure of 3450;
Today's analysis:
The situation in the Middle East has escalated. Gold has risen again due to risk aversion, directly breaking through 3400. The risk aversion sentiment of gold has heated up, and there are signs of easing for the time being. Then the risk aversion sentiment of gold may increase, and gold is expected to continue to rise. Gold bulls have begun to take the lead again under the blessing of risk aversion. At present, gold buying is better, so continue to buy. The 1-hour moving average of gold has formed a golden cross upward buying arrangement. The buying power of gold is getting stronger and stronger, and it is unstoppable. The outbreak of risk aversion is completely an emotional catharsis. Only when the emotions are fully released, the strength of gold bulls will weaken. The decline of gold is buying. The Asian session of gold fell back to the 3400-line barrier to support low-price buying.
Operation ideas:
Buy short-term gold at 3410-3420, stop loss at 3395, target at 3430-3450;
Sell short-term gold at 3447-3450, stop loss at 3458, target at 3400-3380;
Key points:
First support level: 3407, second support level: 3392, third support level: 3378
First resistance level: 3438, second resistance level: 3450, third resistance level: 3473

XAU/USD(20250613) Today's AnalysisMarket news:
The number of initial jobless claims in the United States for the week ending June 7 was 248,000, higher than the expected 240,000, the highest since the week of October 5, 2024. The monthly rate of the core PPI in the United States in May was 0.1%, lower than the expected 0.30%. Traders once again fully priced in the Fed's two interest rate cuts this year.
Technical analysis:
Today's buying and selling boundaries:
3374
Support and resistance levels:
3434
3412
3397
3351
3337
3314
Trading strategy:
If the price breaks through 3397, consider buying in, and the first target price is 3412
If the price breaks through 3374, consider selling in, and the first target price is 3351

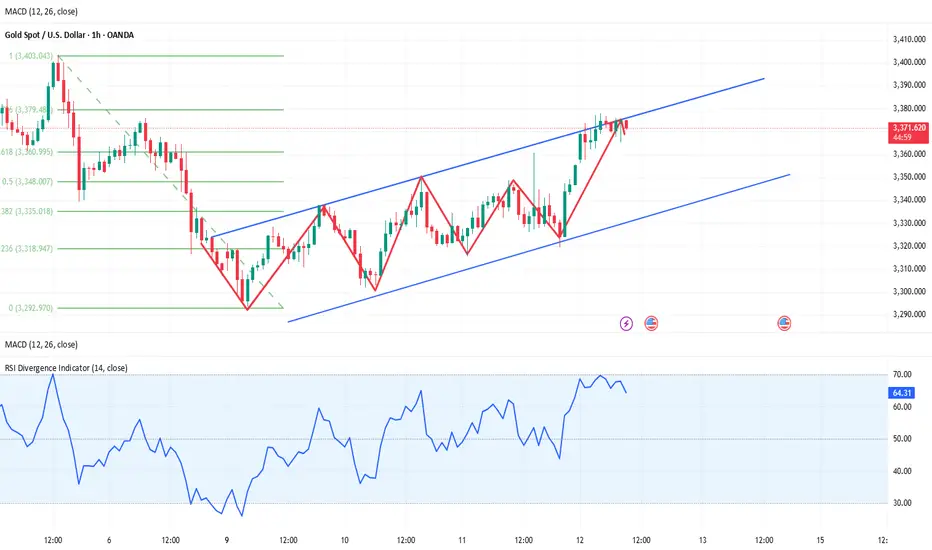
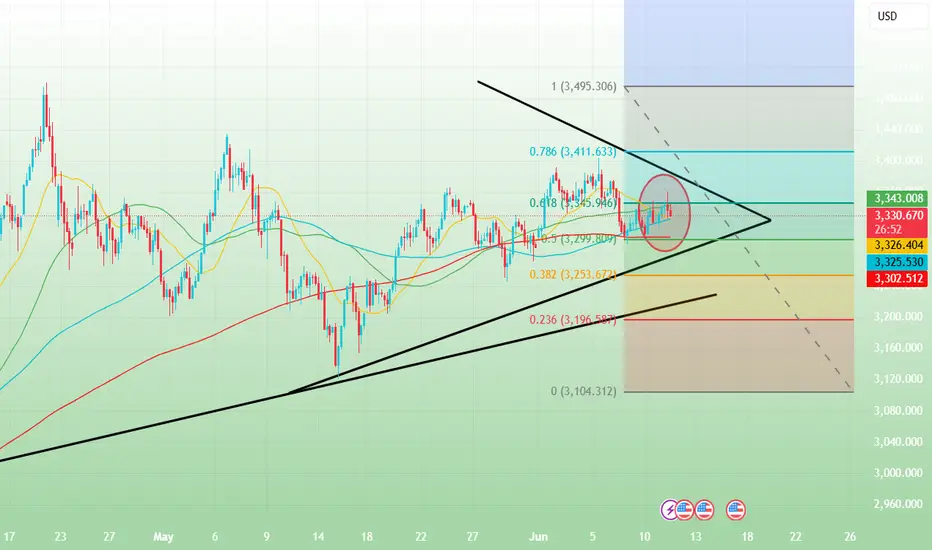
ELLIOT WAVEOANDA:XAUUSD 4 HOUR
**According to the Elliott Wave theory, the ongoing pattern appears to be a double correction. Wave 3 of {Y} has been completed, and Wave 4 is currently in progress. A potential buying opportunity may arise between the levels of 3360 and 3350. **
**However, if gold breaks below the 3350 level, further downside movement is expected, with the next support zone likely between 3315 and 3297. **
**Furthermore, if gold breaks the critical level of 3250, it may extend its decline toward the 3215–3197 range.**

Gold price fluctuates again, layout in the evening📰 Impact of news:
1. Initial jobless claims data favors bulls
📈 Market analysis:
The high of 3392 in the US market fell back for the first time to test the 3377 area to stop the decline and then tried again but failed to break through the 3400 integer mark. It can be seen that this position is very suppressed. The top and bottom conversion of 3377 has become the watershed for bulls to defend in the future market. 3400 is the short-term key pressure and the closing line has a long upper shadow K. If 3377 is lost, the price will fluctuate again. In the short term, focus on the 3390-3400 resistance on the upside and the 3377-3365 support on the downside.
🏅 Trading strategies:
SELL 3385-3395
TP 3370-3360
BUY 3365-3360
TP 3390-3400
If you agree with this view, or have a better idea, please leave a message in the comment area. I look forward to hearing different voices.
TVC:GOLD FXOPEN:XAUUSD FOREXCOM:XAUUSD FX:XAUUSD OANDA:XAUUSD

XAUUSD:Go long
After completing long orders around 3358-3380, the current thinking is still long. The pressure transition has been completed near 3376, which can be regarded as support for now. Go long according to this level.
Trading Strategy:
BUY@3375-79
TP:3390-3400
↓↓↓ More detailed strategies and trading will be notified here ↗↗↗
↓↓↓ Keep updated, come to "get" ↗↗↗

EURUSD LongHere is our EUR USD Signal that we posted
As you can see it's running nicely at 258 Pips.
EURUSD Buy
📊Entry: 1.13538
⚠️SL: 1.12594
✔️TP1: 1.14732
✔️TP2: 1.16256
✔️TP3: 1.18194
We have 5 big swing trades running at present, all of which comes from our trading strategy that is solely based on pure maths. So far in 2025 we have hit 1 stop loss from over 100 trades.
My point to this post is to encourage you all to keep trying, don't give up. It took us over 2 years to perfect this strategy, and we know it works.
If you want any help just ask me, and I will help you.

Long profit-taking,how to position gold before unemployment data📰 Impact of news:
1. Pay attention to the initial unemployment claims data
📈 Market analysis:
After being pulled down, the gold price quickly rebounded to around 3385, and the RSI showed a V-shaped reversal. It is not recommended to chase the rise at present. In the short term, pay attention to the upper resistance area of 3385-3395. If the gold price effectively breaks through this resistance area, it is expected to touch the 3400-3410 line. On the contrary, it encounters resistance and pressure at the 3385-3395 line, and may retreat to the 3370-3360 line in the short term.
🏅 Trading strategies:
SELL 3385-3395
TP 3370-3360
If you agree with this view, or have a better idea, please leave a message in the comment area. I look forward to hearing different voices.
OANDA:XAUUSD FX:XAUUSD FOREXCOM:XAUUSD FXOPEN:XAUUSD TVC:GOLD

XAUUSD:Go long
Gold bottled out and rebounded, hitting the lowest 3319 line, which just gave us the opportunity to leave the 3320 stop profit. Then, under the stimulation of the news surface, it did not break through the 3375 line. Then, combined with the previous ideas, the next need to do long strategy. Keep an eye on the breakout at 3375 during the day.
Trading Strategy:
BUY@3353-58
TP:3375-84
↓↓↓ More detailed strategies and trading will be notified here ↗↗↗
↓↓↓ Keep updated, come to "get" ↗↗↗

Gold Extends Gains, Eyes 3400📊 Market Overview
• Following softer-than-expected US CPI data, gold surged strongly.
• This morning, gold touched a high of 3377 before pulling back slightly to around 3372.
• A weaker USD and growing expectations of Fed rate cuts remain key bullish drivers.
📉 Technical Analysis
• Key Resistance: $3,380 – $3,400
• Nearest Support: $3,325 – $3,310
• EMA09: Price remains above EMA09, signaling a short-term uptrend.
• Candlestick & Momentum: Gold has broken out of a consolidation zone with strong momentum, though short-term overbought signals are emerging.
📌 Outlook
Gold may enter a mild pullback within the 3370–3380 zone before finding fresh momentum from upcoming Fed signals or macro data. Caution is advised when trading near major resistance.
💡 Trading Strategy
🔻 SELL XAU/USD at: 3375–3377
🎯 TP: 3355
❌ SL: 3385
🔺 BUY XAU/USD at: 3325–3330
🎯 TP: 3350
❌ SL: 3315

Repeated sweeps, gold trend analysis and operation layout📰 Impact of news:
1. Pay attention to the initial unemployment claims data
📈 Market analysis:
Gold price jumped higher in Asian session. The short-term upper pressure is at 3375. Once it breaks, the upward route of bulls will be opened. The RSI indicator in the 1H chart began to retreat after touching the overbought area. Last night's high of 3360 is now a breakthrough, and the previous strong suppression is at 3350. This morning's Asian session was also broken and stabilized. Then 3360-3350 has changed from a suppression position to a support position. Therefore, the next position we should pay close attention to should be around 3360-3350. If it can fall back to 3360-3350 in the future, it is possible to enter the market to do more, but at the same time, it is also necessary to defend 3345. Independent trading requires a SL.
🏅 Trading strategies:
BUY 3360-3350
TP 3370-3380-3400
If you agree with this view, or have a better idea, please leave a message in the comment area. I look forward to hearing different voices.
TVC:GOLD FXOPEN:XAUUSD FOREXCOM:XAUUSD FX:XAUUSD OANDA:XAUUSD
At present, the market has invalidated the 4-hour bearish FVG.Gold Market Update:
The gold market is currently moving upward after previously sweeping the liquidity below the previous day's lows. This liquidity grab typically signals the exhaustion of bearish momentum, and in this case, it appears to have served as a springboard for the current upward movement.
Notably, the bearish PD arrays (Price Delivery Arrays)—which are often indicative of bearish structure and order flow—are currently failing to hold. This failure suggests a weakening of bearish pressure and a possible shift in market sentiment toward bullishness.
At present, the market has invalidated the 4-hour bearish Fair Value Gap (FVG) and successfully closed above it. This is a significant development, as it often implies that the price is rejecting lower levels and building strength to push further upward. In simple terms, the market has absorbed the bearish imbalance and chosen to go higher, showing strong bullish intent.
Given this scenario, it's reasonable to interpret that the market is now aiming for higher levels, specifically toward the previous weekly high—marked on the chart with the line labeled "WH" (Weekly High). The price action suggests that the market is in the mood to test or reach that level in the near term.
However, this is not a guarantee. It's essential to watch the market closely for further confirmation signals before making any trading decisions. Additional confirmations could come from continuation patterns, bullish structure formations, or order flow alignment.
---
Reminder:
Always Do Your Own Research (DYOR) before making any financial decisions.
This is not financial advice.

Gold Consolidates Around $3,340–Mild Bullish Bias Ahead CPI Data📊 Market Summary
Gold is consolidating around $3,340/oz, up about 0.5% today, as investors seek safe-haven assets amid ongoing US–China trade tensions. The market is also closely watching the upcoming U.S. CPI data release.
📉 Technical Analysis
Key Resistance:
• $3,350–3,360 – recent swing highs, aligning with the intraday EMA50 and Fibonacci resistance.
• $3,370–3,380 – major monthly high, potential breakout zone.
Nearest Support:
• $3,320–3,330 – EMA20–21 zone, daily support and key pivot level.
• Below $3,320, next support lies near $3,300.
EMA 09:
• Price is trading above EMA9 but still below EMA21–50 → suggests neutral-to-slightly bullish intraday bias.
Candlesticks / Volume / Momentum:
• Small-bodied candles with low volume → signs of sideways movement.
• RSI on H1 ~60, H4 ~55 → modest upward momentum, not yet overbought.
📌 Outlook
Gold is likely to continue consolidating around $3,340, with mild upside potential if the U.S. CPI data comes in hot or trade talks remain inconclusive.
💡 Suggested Trading Strategy
SELL XAU/USD at: $3,350–3,355
🎯 TP: $3,330–3,335
❌ SL: $3,360
BUY XAU/USD at: $3,320–3,330
🎯 TP: $3,340–3,345
❌ SL: $3,310

Gold/XAUUSD Possible CPI Move 11 June 2025Technical Analysis
Key Confluences Supporting the Buy Setup:
Trendline Support
The gold shows a well-respected ascending trendline, which has been tested multiple times. This provides a dynamic level of support.
Horizontal Support Zone (3323–3326)
This area previously acted as resistance and has now flipped to support. The consolidation here suggests a demand zone.
Bullish Market Structure
The market is forming higher highs and higher lows, indicating a bullish structure. The current pullback may serve as a liquidity grab before continuation.
Liquidity Below 3320
There is likely a liquidity pocket just below 3320. Price could sweep below support to trap sellers before reversing upward.
CPI News Catalyst
CPI data release can cause volatility. The stop-loss below 3314 is well-placed to allow for a spike without invalidating the bullish structure.
Trade Setup Summary
Bias: Bullish
Entry Zone: 3323–3326
Confirmation: Reaction from the trendline and horizontal support after CPI release
Take Profit (TP): 3335/3349 (targeting the recent high and potential double top liquidity)
Stop Loss (SL): Below 3314
Risk-Reward Ratio (RRR): Approximately 1:2
Entry Trigger: Look for a strong bullish rejection or engulfing pattern at the 3323–3326 zone to confirm entry.
Management: Consider partial profit booking near 3340 if volatility increases or if price shows signs of rejection before the target.

How to arrange the gold price in the evening? Go long at 3330📰 Impact of news:
1. CPI data is profitable
2. The US CPI rose slightly in May, and Trump's tariff effect has not yet fully emerged
📈 Market analysis:
The trend line position of the 4H chart coincides and resonates with the middle track of the Bollinger Band, with 3326 as the watershed reference. This is why it is difficult to break below this point after repeated tests. Once it breaks below, the short-term trend is likely to fluctuate from strong to weak. However, the current support below is still strong at 3330-3326. The repeated rise and fall of data during the day also stopped the decline at this point. If the price does not lose here, the pattern of strong fluctuations will remain unchanged, and the bulls will gradually regain lost ground. At present, it is time for space. The operation suggestion for the future market is to continue to rely on the bullish trend above 3330, and 3330-3326 can be flexibly entered. At the same time, the RSI indicator is above 50 and there is still some space from the overbought zone. The signal is given that 3360, although the long upper shadow line K is closed, is very likely not the short-term top. After the sharp rise and fall in 1H, it went sideways and waited for the next wave of strength. If the night close is above 3326, the upper area will probably be 3350-3360. If the price can break through and stabilize this level, the upward pace will most likely accelerate to reach 3370-3380.
🏅 Trading strategies:
BUY 3330-3326
TP 3350-3360
If you agree with this view, or have a better idea, please leave a message in the comment area. I look forward to hearing different voices.
OANDA:XAUUSD FX:XAUUSD FOREXCOM:XAUUSD FXOPEN:XAUUSD TVC:GOLD
Analysis of the latest gold price trends!Market news:
In the early Asian session on Wednesday (June 11), spot gold fluctuated in a narrow range and is currently trading at $3,330 per ounce. London gold prices rose and fell on Tuesday as the conflict between Russia and Ukraine continued and the World Bank also lowered its global economic growth forecast. Traders are closely watching the Sino-US trade negotiations, the results of which may ease trade tensions and boost the global economy, thereby reducing the demand for safe-haven assets, while the continued rise in US stocks has also suppressed the safe-haven buying demand for international gold.In the past few days, gold has fallen from its recent highs, mainly because the market has optimistic expectations for negotiations between China and the United States and Britain and Russia. If the United States and China reach a trade agreement, it will weaken the attractiveness of gold as a safe-haven asset. Gold is a hedge investment tool and usually rises during periods of geopolitical and economic uncertainty. The market is currently focusing on the upcoming US CPI data for May. Expected data show that inflation may rise slightly to 2.5%, with core CPI around 2.9%. If the data exceeds expectations, it may be bearish for gold in the short term; if inflation slows down, it will strengthen the market's expectations for the Fed to cut interest rates this year, which is bullish for gold prices.
Technical review:
Technical daily chart continues to close with alternating yin and yang cycles, the moving average is glued together, and the RSI indicator runs on the middle axis. The moving average of the four-hour chart is glued together, the price is adjusted near the middle track of the Bollinger Band, and the RSI indicator is flat. Gold rose above 3349 yesterday and fell back to 3320 in the early morning. After a sharp drop to 3315 in the Asian session, it needs to break the low point of 20 in the early morning and then quickly rise to 3331. Pay attention to the 3320 position in the Asian session. If 3320 stabilizes and moves upward, continue to look at the test of 3340/50 during the day. Otherwise, if it loses again or adjusts around 20 during the day, it will be regarded as a weak sell. Pay attention to 3306/3293 below. Gold technical aspects continue to be arranged with a shock idea. Under the premise that there is no news to stimulate the selling, gold continues to maintain low-price buying as the main technical aspect, and high-price selling as the auxiliary.
Today's analysis:
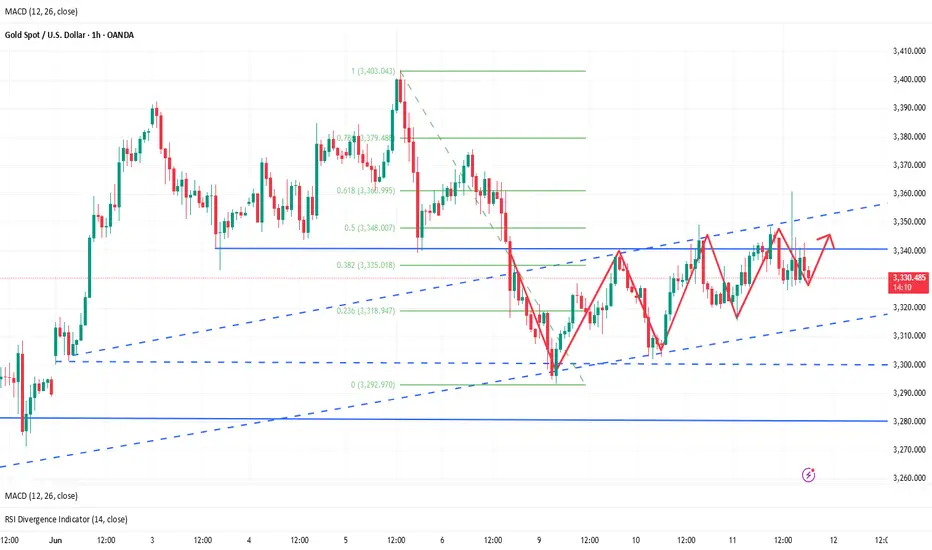
From the daily level, gold is in a high-level shock consolidation since the peak of 3500. The current highs of 3500, 3435, and 3403 are gradually moving down, and the lows of 3120, 3245, and 3293 are gradually rising. The shock range is gradually narrowing. The short-term market may continue to maintain shocks. If it breaks, it needs to wait for the direction of the breakthrough to be stimulated by major news!
So today's lock range is 3293-3360. It is recommended to sell at high prices and buy at low prices to treat shocks, mainly short-term or ultra-short-term, and do not chase ups and downs before the range is effectively broken.
Operation ideas:
Buy short-term gold at 3310-3330, stop loss at 3292, target at 3340-3360;
Sell short-term gold at 3350-3363, stop loss at 3362, target at 3300-3310;
Key points:
First support level: 3320, second support level: 3306, third support level: 3292
First resistance level: 3346, second resistance level: 3358, third resistance level: 3376
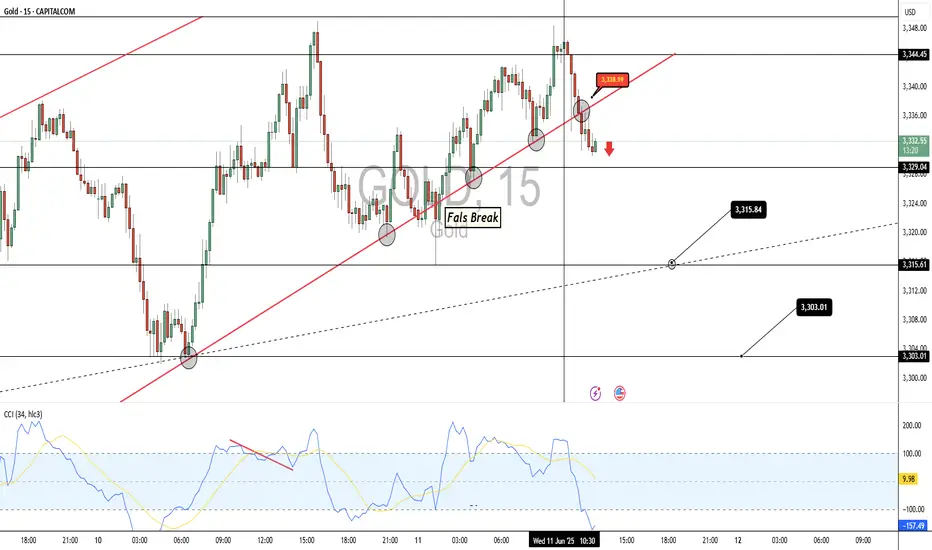
Clear Short opportuniy on Gold According to CCI Under Zero and -100
According to Breakout of Uptrendline
According to Divergence
To double Top ....etc