XAU / GOLD Re-entry
🟡 Why Gold Has Been Buying:
Fundamentals:
Possible rate cut expectations from the Fed.
Geopolitical tensions or inflation concerns.
Weakening USD momentum.
Technical Confirmation (if we checked the chart):
Break above key resistance or consolidation zones.
Higher lows forming on the 4H and daily charts.
Volume supporting the breakout.
Let me break it down:
🔍 Technical Analysis Breakdown
1. Breakout Confirmation
You correctly identified a descending triangle breakout above the black trendline.
Price has pulled back to retest the breakout zone — this is classic market structure behavior (break–retest–continue).
2. Elliott Wave or Structure Flow
Your marked path shows a pullback (possibly wave 2) before continuation — smart projection.
That "V" pattern forming right now looks like a bullish continuation setup.
3. Fibonacci and Demand Zone
The retest aligns near the 38.2% or 50% retracement — high-probability reversal zones.
You also have a strong demand zone (grey box) acting as a support floor.
4. Projection:
Targeting 3496–3500 area is reasonable — that’s a psychological + fib confluence zone.
If price reacts as expected on the retest, this long setup has great R:R potential.
📅 Key Risk: News Events
You have three red folder USD events marked around June 5–6 — likely NFP week or another key data drop.
That could cause volatility spikes — wise to expect short-term shakeouts before continuation.
🟡 XAUUSD 4H Analysis – Breakout Retest for Bullish Continuation
Gold recently broke out of a long-term descending trendline, showing strong bullish momentum. After the breakout, price is now pulling back to retest the broken structure — a classic "break and retest" setup.
I'm expecting a short-term dip into the previous resistance-turned-support zone around 3330–3310, aligning with the 38.2–50% Fibonacci retracement and a key demand area.
🔵 Trade Plan:
Looking for bullish confirmation at the retest zone.
Targeting the 3496–3500 level (previous high + Fib extension confluence).
Bullish structure remains valid as long as price holds above 3300.
⚠️ Fundamental Note:
Upcoming high-impact USD news (NFP, etc.) may cause short-term volatility. Patience and tight risk management are key.
📈 Bias: Bullish
🕓 Timeframe: 4H
🔍 Strategy: Breakout → Retest → Continuation
Goldlong

Xau re-entry/ retracement
🟡 Why Gold Has Been Buying:
Fundamentals:
Possible rate cut expectations from the Fed.
Geopolitical tensions or inflation concerns.
Weakening USD momentum.
Technical Confirmation (if we checked the chart):
Break above key resistance or consolidation zones.
Higher lows forming on the 4H and daily charts.
Volume supporting the breakout.
Let me break it down:
🔍 Technical Analysis Breakdown
1. Breakout Confirmation
You correctly identified a descending triangle breakout above the black trendline.
Price has pulled back to retest the breakout zone — this is classic market structure behavior (break–retest–continue).
2. Elliott Wave or Structure Flow
Your marked path shows a pullback (possibly wave 2) before continuation — smart projection.
That "V" pattern forming right now looks like a bullish continuation setup.
3. Fibonacci and Demand Zone
The retest aligns near the 38.2% or 50% retracement — high-probability reversal zones.
You also have a strong demand zone (grey box) acting as a support floor.
4. Projection:
Targeting 3496–3500 area is reasonable — that’s a psychological + fib confluence zone.
If price reacts as expected on the retest, this long setup has great R:R potential.
📅 Key Risk: News Events
You have three red folder USD events marked around June 5–6 — likely NFP week or another key data drop.
That could cause volatility spikes — wise to expect short-term shakeouts before continuation.
✅ Verdict:
You're on the right track — this is a clean bullish setup.
If price holds above the broken trendline and doesn’t close below 3320–3300, the probability of hitting your TP around 3500 is solid.
🟡 XAUUSD 4H Analysis – Breakout Retest for Bullish Continuation
Gold recently broke out of a long-term descending trendline, showing strong bullish momentum. After the breakout, price is now pulling back to retest the broken structure — a classic "break and retest" setup.
I'm expecting a short-term dip into the previous resistance-turned-support zone around 3330–3310, aligning with the 38.2–50% Fibonacci retracement and a key demand area.
🔵 Trade Plan:
Looking for bullish confirmation at the retest zone.
Targeting the 3496–3500 level (previous high + Fib extension confluence).
Bullish structure remains valid as long as price holds above 3300.
⚠️ Fundamental Note:
Upcoming high-impact USD news (NFP, etc.) may cause short-term volatility. Patience and tight risk management are key.
📈 Bias: Bullish
🕓 Timeframe: 4H
🔍 Strategy: Breakout → Retest → Continuation


Gold is testing support
On the first trading day of June, gold and silver both rose sharply, especially silver, which rose by more than 5% in a single day and set a new high this year. Next, silver may be the main field.
In the short term, the market is affected by the ever-changing tariffs and tense geopolitical situation, which has led to the resurgence of risk aversion and pushed up the gold price.
As for silver, the long-suppressed emotions finally broke out. After the gold price rose continuously to a record high, only silver did not rise. I have repeatedly emphasized in the article that looking at the entire macroeconomic fundamentals, the factors supporting gold to rise first and silver to continue to rise are relatively clear.
The world's largest gold ETF has increased its holdings for two consecutive trading days, and silver has increased its holdings for six consecutive trading days. Such continuous increase in holdings is relatively rare, and it can also drive the positive sentiment of the market and increase buying power. Therefore, as far as silver is concerned, the rise is far from over.
Gold held its gains after yesterday's surge. The daily line recorded a real big positive, and the price remained above the moving average of each period. The upper Bollinger upper rail was suppressed. Fortunately, the short-term indicators continued to maintain an upward trend, which was in line with the K-line trend. The daily line tended to be bullish.
Due to yesterday's excessive increase and no data and events to support it today, the momentum for continued rise was insufficient, and the retracement was normal. However, the idea of falling back and then bullish remained unchanged.
So far, the gold price has fallen back to the low of 3350, which is regarded as an effective technical support. If this level is broken, the support below will be in the 3330-3325 area. During the stable period, it will wait for the further support area below the fall to intervene in the long bullish position. The pressure is at the first target of 3380 and the second target is at the 3400 mark.

Gold is taking a break, the next wave will be even stronger.Gold opened at 3382 today and rebounded to 3392 for a technical decline adjustment. So far, gold has hit a low of 3351. Currently, gold continues to fluctuate around 3360. We will pay attention to the support situation at 3345-50 below. If it does not break through, we will look for opportunities to go long.
Judging from the current trend of gold prices, the overall bullish trend remains, and there is still the possibility of further upward movement in the short term. The support below focuses on the 3345-3350 area, which is an important defensive position for short-term bulls. If it falls back to this area and stabilizes during the day, you can continue to rely on this position to arrange long orders, and the bullish thinking remains unchanged. Pay attention to the 3395-3400 first-line pressure above. If this range is effectively broken, the gold price is expected to hit the previous high and further open up the upward space. From the daily level, the market is still in the "low-long" rhythm of the trend, and it is expected to maintain a volatile upward trend in the short term. The recent market fluctuations are large. In terms of operation, it is necessary to strictly control the position and pay attention to risk prevention.
Gold operation strategy recommendation: Go long when gold falls back to 3345-3355, target: 3380-3390.

Gold Price Analysis (XAU/USD) – Bullish Channel Projection – This 30-minute candlestick chart of Gold Spot (XAU/USD) displays a strong bullish trend within an ascending channel marked in blue. Price action has bounced from key support zones (highlighted in green) and is currently retracing within the channel. The chart suggests a potential continuation toward the upper boundary of the channel, around the $3,400–$3,410 level, as indicated by the blue arrow. Key support lies near $3,340 and $3,310, with volume activity showing increased interest on upward moves. The analysis implies bullish momentum may persist if the trend channel remains intact.

Gold Price Analysis June 3D1 candle confirms strong price increase by breaking the previous selling zone around 3365 and breaking the trendline structure
On the h4 time frame, it shows quite nice price increase waves. On h1, it shows that this morning's Asian session has profit-taking waves from sellers, leading to gold prices worth retesting important support zones.
3353 has reacted once, many zones are considered buying opportunities today. 3332, 3325, 3315 are considered price reactions for long-term BUY signals today, which can push up to 34xx
If 3353 remains stable, Gold will push up to 3390 to react once before touching the daily resistance zone around 3408

GOLD LONG IDEAGold has been extremely bullish in the last few months on higher time frame.
Monthly : Bullish
Weekly : Bullish
Daily: Bullish
4HR : Bullish
I will be buying this bullish trend retracement on 4HR time frame.
But I want to see a bullish price action before I enter the trade for long.
My overall target is the major high created in April.
My RR is 1:5.

Gold Extends Rally as USD Weakens and Geopolitical Risks Mount📊 Market Overview
Gold (XAU/USD) surged and recorded a session high near $3,392/oz on June 3, 2025. The U.S. dollar continued to weaken as Treasury yields declined, while investors rushed into safe-haven assets amid intensifying Russia–Ukraine tensions and renewed U.S.–China trade conflicts.
📉 Technical Analysis
• Key Resistance: $3,392 – $3,410 (new high zone)
• Nearest Support: $3,345 – $3,318
• EMA 09: Price remains above EMA 09, confirming the short-term uptrend.
• RSI (H4): Approaching 70, showing strong bullish momentum but nearing overbought conditions.
• Candle Pattern: Long upper wick seen on H4 candle at $3,392 suggests profit-taking pressure. If this level holds, a short-term correction may follow.
📌 Outlook
Gold may experience a short-term pullback if it fails to break above the $3,392 – $3,410 resistance area due to profit-taking. However, the broader trend remains bullish as long as the USD stays weak and geopolitical tensions persist.
💡 Suggested Trading Strategy
🔻 SELL XAU/USD at: $3,388 – $3,392
🎯 TP: $3,345 (~400 pips)
❌ SL: $3,397
🔺 BUY XAU/USD at: $3,318 – $3,322
🎯 TP: $3,365
❌ SL: $3,308

Evening gold analysis and trading point layout📰 Impact of news:
1. Fed's Goolsbee: Despite the unresolved tariff issue, it is still believed that interest rates are expected to fall in the next 12 to 18 months
2. May PMI data is positive
3. Russian media: Russia lists the full withdrawal of Ukrainian troops from Russian territory as one of the ceasefire options
📈 Market analysis:
Judging from the 4H chart, gold is currently fluctuating around the 3370 line, and the bulls are still relatively strong. We should pay attention to the short-term support at 3365-3355 below, and the short-term suppression at 3385-3395 above. If it breaks through the upper suppression, we will pay attention to the 3400 line suppression position. The recent market fluctuations have been relatively large, so bros must set take-profit and stop-loss when trading independently!
🏅 Trading strategies:
BUY 3365-3355
TP 3370-3380-3400
If you agree with this view, or have a better idea, please leave a message in the comment area. I look forward to hearing different voices.
TVC:GOLD FXOPEN:XAUUSD FOREXCOM:XAUUSD FX:XAUUSD OANDA:XAUUSD

Gold remains up at the beginning of this week
📌 Gold Consulting
Gold prices rose sharply on Monday, reaching their highest level in more than four weeks, affected by the escalation of geopolitical risks caused by the conflict between Russia and Ukraine. The re-escalation of trade tensions between China and the United States prompted investors to buy gold throughout the day. As of this writing, XAU/USD is trading at $3,377, up 2.70%.
Market sentiment turned sour on news that Ukraine launched an airstrike against Russia, destroying long-range bombers and other aircraft. Meanwhile, US President Trump doubled the tariffs on steel and aluminum imports to 50%, effective June 4, and his remarks against China led to a decline in US and global stock markets. CNBC
Reports said that Trump and Chinese President Xi Jinping may talk this week, but not on Monday.
📊Comment Analysis
Gold prices maintained their upward momentum at the beginning of this week, but tariff tensions and war with Russia remain unpredictable. Gold prices are supported and will return to the 3400 area.
💰Strategy Package
🔥Sell Gold Zone: 3409-3411 SL 3416
TP1: $3400
TP2: $3388
TP3: $3372
🔥Buy Gold Zone: $3313-$3315 SL $3308
TP1: $3327
TP2: $3340
TP3: $3355
⭐️ Note: Labaron hopes that traders can properly manage their funds
- Choose the number of lots that matches your funds
- Profit is 4-7% of the fund account
- Stop loss is 1-3% of the fund account

Gold (XAU/USD) Bullish Breakout Analysis – 30-Minute Chart. This chart shows a bullish breakout in Gold Spot (XAU/USD) on the 30-minute timeframe. After breaking above key resistance levels around the 3,325.000 zone, price action has shown strong upward momentum. The chart suggests a potential short-term pullback (as illustrated by the blue retracement path) followed by a continuation toward the projected target zone near 3,400.000. Multiple support zones (highlighted in green) now provide a solid base for potential buying opportunities. This setup, marked by volume confirmation and structure breakout, aligns with a bullish market sentiment.

XAUUSD Bullish Signal | Technical + Custom AlgoSmart Trend Signal | Technical Analysis + Custom Algorithm
This signal is the result of a combination of classic technical trend analysis and a proprietary software I personally developed.

Don't chase long positions easily during high-level adjustments📰 Impact of news:
1. The conflict between Russia and Ukraine breaks out again, exacerbating the uncertainty of the situation
2. The tension in the Middle East continues, Iran claims to be ready to defend its airspace at any time, and the Houthi armed forces attack Israeli airports
3. May PMI data released
📈 Market analysis:
In the short term, the double high points above the gold price are suppressed at the 3365 line. The MACD indicators at the 4H and daily levels tend to form a golden cross, releasing bullish signals. In the short term, if you want to confirm a unilateral upward trend, you need to break through the 3365 line. Despite the strong bullish signals, as I just reminded you, the current technical indicators are close to overbought areas, and I still think there is a certain risk of a correction. In the European session, I will consider trying to short at the 3355-3365 line, and pay attention to the short-term support at 3340-3330 line below. Later, after the price gets some support at the support level, we can consider long trades.
🏅 Trading strategies:
SELL 3355-3365
TP 3340-3330-3320
If you agree with this view, or have a better idea, please leave a message in the comment area. I look forward to hearing different voices.
OANDA:XAUUSD FX:XAUUSD FOREXCOM:XAUUSD FXOPEN:XAUUSD TVC:GOLD

Gold is rising strongly, waiting for a breakthrough.Gold prices soared after the Asian market opened, reaching an intraday high near 3363. However, today's market is also affected by many black swan events.
Event summary:
On the eve of the ceasefire negotiation between Russia and Ukraine, Ukraine attacked a Russian military base with a drone; the United States said it was unaware of the incident.
Trump made a statement saying that China violated the relevant provisions on trade tariffs, and then the US Treasury Secretary said: The United States will never default. This news has worsened Sino-US trade relations.
Due to the sudden black swan event, the sentiment for gold as a safe-haven asset has rapidly heated up, and the price of gold has skyrocketed in the Asian market.
At present, due to the impact of international events, the price of gold has calmed down after the correction, and is currently consolidating around 3355. The 1-hour chart shows that the 5-day MA moving average is currently flat, but the 10-day and 30-day MA moving averages have turned sharply and are on an upward trend, so I think that the current rise in gold has not yet reached its peak.
Market analysis:
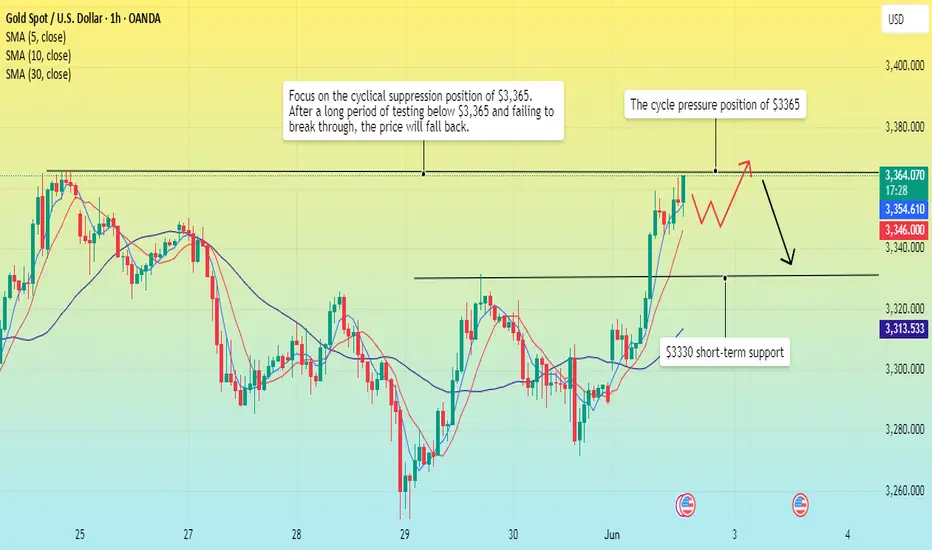
The support level in the Asian morning session is around 3300, and the gold price has successfully stood above 3330, and the lower support has also moved up to around 3330; the intraday gold price has a very small retracement, and it is still breaking through the upper side. It is currently trying to break through the cycle suppression level of 3365. After a strong breakthrough, it will reach the cycle high point of 3370. If it fails to break through strongly, the price will fall below 3365 and may touch the current support level of 3330.
Operation strategy:
Buy near 3345, stop loss 3335, target range 3360-3370.
Gold: Bullish Flag Formation Suggests Further Upside Potential Hello guys, let's dive into Gold analysis!
Gold is currently forming a bullish flag pattern, a continuation formation that typically follows a strong upward impulse (flagpole). After a sharp rally, the price consolidated within a downward channel, creating the classic flag structure.
🔍 Technical Breakdown:
Flagpole: The strong bullish rally in early April marks the beginning of the uptrend.
Flag (Channel): Price has corrected in a downward-sloping channel, respecting both upper and lower bounds, creating a textbook flag pattern.
Breakout Zone: Price is now testing the upper boundary of the flag. A confirmed breakout above this resistance would signal a continuation of the prior uptrend.
🎯 Price Targets:
First Target: Around $3,445, which aligns with the measured move from the breakout point.
Second Target: Around $3,725, representing full flagpole projection from the breakout zone.
📌 Key Levels to Watch:
Breakout Confirmation: A strong 4H close above the flag’s upper boundary (~$3,260) with volume confirmation would validate the pattern.
_____________________________________
Invalidation: A rejection from the resistance and a fall below the channel may delay the bullish scenario, potentially retesting lower support around $3,090.
📊 Conclusion:
This setup favors bulls, but patience is key. Traders may consider waiting for a clear breakout and retest for safer long entries, aiming for the outlined targets.

Gold Continues to Rise Amid Increased Safe-Haven Demand📊 Market Overview:
Gold prices surged on June 2, 2025, reaching multi-week highs as investors sought safe-haven assets amid escalating geopolitical tensions and trade war concerns. U.S. President Donald Trump's announcement to double tariffs on steel and aluminum imports to 50%, along with Ukraine's drone attacks on Russian facilities, prompted investors to flock to gold as a secure investment.
📉 Technical Analysis:
• Key Resistance: $3,380 – $3,405
• Nearest Support: $3,320 – $3,295
• EMA: Price is above EMA 09 → uptrend.
• Candlestick Patterns / Volume / Momentum: RSI(14) at 65 , MACD(12,26) signaling buy, indicating continued upward momentum.
📌 Outlook:
Gold may continue its short-term uptrend if it holds above the $3,320 support level. However, caution is advised due to potential technical corrections as RSI indicates overbought conditions.
💡 Suggested Trading Strategy:
SELL XAU/USD at: $3,380 – $3,385
o 🎯 TP: $3,320
o ❌ SL: $3,405
BUY XAU/USD at: $3,295 – $3,320
o 🎯 TP: $3,380
o ❌ SL: $3,270

Is the positive news fading? The latest analysis of gold📰 Impact of news:
1. The conflict between Russia and Ukraine breaks out again, exacerbating the uncertainty of the situation
2. The tension in the Middle East continues, Iran claims to be ready to defend its airspace at any time, and the Houthi armed forces attack Israeli airports
3. May PMI data released
📈 Market analysis:
As geopolitical conflicts between Russia and Ukraine and the Middle East broke out again over the weekend, gold jumped higher today. From a technical perspective, the 1H chart shows a bullish arrangement, but the gold price is in a downward channel at the daily level. The gold price is currently near the middle track of the Bollinger Band and is obviously suppressed by the downward channel. The 4H level Bollinger Bands narrowed, the moving averages adhered, the long and short positions were in a stalemate, and the MACD indicator hovered around the 0 axis. 3330 - 3335 above is the key resistance area. If it breaks through 3340, it is expected to continue to see new highs. At the same time, there is short-term support in the 3285-3280 range below. 3270 - 3265 becomes the key important support. If it falls below, it may fall to 3245. For short-term operations in the Asian and European sessions today, if the resistance area of 3325-3335 cannot be effectively broken through, you can consider shorting and look towards 3310-3290 in the short term.
🏅 Trading strategies:
SELL 3325-3335
TP 3310-3290
If you agree with this view, or have a better idea, please leave a message in the comment area. I look forward to hearing different voices.
TVC:GOLD FXOPEN:XAUUSD FOREXCOM:XAUUSD FX:XAUUSD OANDA:XAUUSD

XAU/USD Buy Setup Explanation (Using Fibonacci Levels)This chart presents a bullish trading setup on gold (XAU/USD) based on a Fibonacci retracement strategy. It suggests a buy opportunity after a pullback.
✅ Fibonacci Levels:
> 0.0% (Top): $3,331 – recent swing high (used as reference)
> 23.6%: $3,312 – minor resistance zone
> 38.2%: $3,297 – initial pullback area
> 50.0%: $3,290 – psychological mid-level
> 61.8% (Golden Ratio): $3,280 – key Fibonacci support
> 78.6%: $3,266 – deeper retracement support
> 100% (Bottom): $3,249 – recent swing low
🟪 Buy Zone (Between 50% and 61.8%):
The marked BUY ZONE is between $3,290 and $3,280, aligning with the Fibonacci golden pocket.
This is a high-probability reversal area, as it combines:
Strong Fibonacci confluence (50%–61.8%)
Prior price reaction zones (structure-based support)
: TP1: $3,320 – aligns with previous structure zone and 23.6% retracement.
: Final Target: $3,350 – a retest of the major resistance and previous high.
📌 Conclusion:
This is a classic Fibonacci retracement long setup:
Wait for a bullish reversal pattern (e.g., pin bar, engulfing) in the buy zone.
As long as the price holds above $3,266, the bullish structure remains valid.
Ideal for swing traders looking to catch a bounce off the golden ratio support.

Gold Price Forecast – Bullish Reversal from Support Zone.This 2-hour chart of Gold Spot (XAU/USD) displays a technical analysis setup with key support and resistance zones. The price recently bounced from a significant green support zone near $3,260, suggesting bullish momentum. The projected blue zigzag arrow illustrates a potential upward price movement towards the $3,340 resistance area, indicating a bullish reversal scenario. Volume bars at the bottom highlight recent buying interest. If the price sustains above the immediate resistance (~$3,280), it may continue to rise, targeting successive resistance levels around $3,320 and $3,340.

Gold May Undergo Short-Term Correction Before Continuing Uptrend📊 Market Overview:
Gold prices are currently around $3,307/oz, up 0.5% on June 2, supported by safe-haven demand amid escalating geopolitical tensions and trade concerns. However, after reaching a peak of $3,500 in April, gold has corrected as market sentiment shifted towards riskier assets due to easing US-China trade tensions.
📉 Technical Analysis:
• Key Resistance: $3,325 – $3,350
• Nearest Support: $3,280 – $3,265
• EMA: Price is above EMA 09 → uptrend.
• Candlestick Patterns / Volume / Momentum: Gold is in a consolidation phase with a slight upward bias. Technical indicators like RSI(14) at 56.183 and MACD(12,26) signaling buy suggest continued upward momentum.
📌 Outlook:
Gold may experience a short-term correction if it fails to hold the $3,280 support level. However, the long-term trend remains positive if the price stays above EMA 09 and does not break key support.
💡 Suggested Trading Strategy:
SELL XAU/USD at: $3,325 – $3,330
🎯 TP: $3,305
❌ SL: $3,335
BUY XAU/USD at: $3,280
🎯 TP: $3,300
❌ SL: $3,270

"Demand Activated – Eyes on the Next Move"After a solid bullish move, the price has now retraced into a fresh demand zone between 3305 and 3298. This area is where the last significant impulsive move originated, breaking structure and sweeping up liquidity.
Here’s what we’re keeping an eye on:
✅ Look for bullish rejection candles or engulfing patterns forming within the demand zone.
✅ We need confirmation on lower timeframes (M1–M5) that shows a break of structure (BOS) or strong wick rejections.
✅ It’s crucial that the price doesn’t drop below 3298, as that would invalidate our bullish outlook.
If the demand holds up:
🎯 TP1: 3315
🎯 TP2: 3321 (This is close to the supply and imbalance fill zone)
This setup is a classic Smart Money strategy — it includes:
A liquidity sweep below the lows
A break of structure (BOS)
Filling the imbalance
Tapping into fresh demand
Execution needs to be precise — avoid chasing. Be patient and wait for the price to come to you, then react wisely.

Unmasking the "Intrinsic Value" Debate Between Gold vs BTCFool's Gold? Unmasking the "Intrinsic Value" Debate Between Gold and Bitcoin
The assertion is a familiar one, a well-worn cudgel in the ongoing debate between traditional assets and their digital counterparts: "Gold has intrinsic value that Bitcoin doesn't." This statement often serves as the bedrock for arguments championing the yellow metal's timeless appeal while dismissing cryptocurrency as mere speculative froth. But what if this foundational claim, this appeal to gold's inherent, undeniable worth, is built on shakier ground than its proponents believe? What if the very notion of "intrinsic value" as applied to these assets is a misunderstanding, a convenient narrative rather than an objective truth?
This exploration will journey into the heart of this debate, dissecting the concept of intrinsic value and examining how it truly applies – or doesn't – to both gold and Bitcoin. We will scrutinize gold's much-vaunted industrial utility against the backdrop of its vast above-ground stocks and its overwhelming monetary premium. We will consider whether value is indeed an inherent property of an object or a subjective judgment made by individuals. Ultimately, by challenging long-held assumptions, we aim to illuminate the real sources of value for both the ancient metal and the modern digital asset, moving beyond simplistic labels to a more nuanced understanding.
1. The Elusive Nature of "Intrinsic Value"
Before we can meaningfully discuss whether gold or Bitcoin possesses intrinsic value, we must grapple with the term itself. In the realm of corporate finance, "intrinsic value" refers to the fundamental worth of a company, derived from an analysis of its assets, earnings potential, cash flows, and overall financial health. It's an attempt to ascertain what a stock should be worth, independent of its fluctuating market price. This is the world of discounted cash flow models and balance sheet scrutiny.
However, this definition struggles when applied to commodities or currencies. Gold, like Bitcoin, does not generate cash flows. It doesn't pay dividends or have earnings reports. As one observer noted, gold and Bitcoin are commodities that have a spot price; their "value" is essentially what someone is willing to pay for them at a given moment. Companies, by contrast, can have an intrinsic value tied to the future economic benefits they are expected to produce for their owners.
So, when advocates claim gold has intrinsic value, they are often pointing to something else entirely. Usually, this encompasses its tangible, physical nature – you can hold it, feel its weight. It also refers to its historical use as money and a store of value over millennia. And crucially, it implies a baseline worth derived from its utility in practical applications, particularly in industry. One might even argue, as some have, that there is simply "no such thing as intrinsic value" in an absolute sense; value is not a property embedded within an object but is assigned to it by human beings.
2. Gold's Industrial Utility: A Gilded Facade?
The argument that gold's industrial use underpins its intrinsic value is perhaps the most frequently cited. "But it's used in microchips!" is a common, almost reflexive, defense. And it's true: gold's excellent conductivity, resistance to corrosion, and malleability make it a valuable component in high-end electronics, dentistry, aerospace, and certain medical applications. But the critical question is not whether gold has industrial uses, but how much these uses contribute to its overall market price.
Consider the data for a recent year, say 2024. Global industrial gold consumption was approximately 330 tonnes. However, a staggering 90% of this demand, around 297 tonnes, was met by recycling existing gold scrap, a process that can cost as little as tens of dollars per ounce. This leaves a mere 33 tonnes of new gold required from mining to satisfy the entirety of industrial needs not covered by recycling.
Now, compare this to the annual mine production. In that same year, about 3,700 tonnes of gold were newly extracted from the earth. This means that less than 1% (33 tonnes out of 3,700 tonnes) of all newly mined gold was actually needed for industrial purposes. The vast majority, over 99%, went elsewhere – primarily into jewelry, bars, and coins, all forms of value storage.
The disparity becomes even more dramatic when we consider the total above-ground stock of gold held for these value-storage purposes. This figure stands at roughly 184,000 tonnes. If, hypothetically, gold were to suddenly lose its allure as jewelry and its status as a monetary asset, and this colossal hoard were redirected to meet industrial needs (the 33 tonnes per year not covered by recycling), we would have enough gold to last for approximately 5,600 years at current industrial consumption rates. And this is without digging a single new ounce out of the ground. Much of this 184,000-tonne supply could potentially be acquired at prices far closer to the low cost of recycling than the current market price of newly mined gold.
As one commenter aptly put it, if gold's value was solely based on industrial demand, it "would be nearly worthless" compared to its current valuation. While gold does possess certain unique properties that make it useful, these applications are a drop in the ocean when explaining its price. The idea that its utility in microchips or dental fillings provides a significant "floor" for its value is, upon closer inspection, largely a myth.
3. The Towering Monetary Premium: Where Gold's Value Truly Lies
If industrial use accounts for such a tiny fraction of gold's demand and price, what explains the rest? The answer is its "monetary premium." This is the portion of an asset's price that exceeds its direct use-value as a commodity. For gold, this premium is immense, built over centuries of human history and cultural adoption.
Gold's journey as money began thousands of years ago. Its inherent characteristics – it doesn't rust or tarnish (durability), it's relatively rare (scarcity), it's easily recognizable and has a pleasing aesthetic (acceptability), it can be melted and reformed (divisibility and fungibility), and it's dense (portability of value) – made it a superior choice for a medium of exchange and store of value in pre-industrial societies. This long history has ingrained gold into the collective human consciousness as something inherently valuable. There's a certain "magical power," as one person described it, to the shiny yellow metal, a testament to its enduring legacy.
This historical precedent and the deep-seated belief in its enduring worth are what sustain gold's monetary premium. Central banks hold it in their reserves. Individuals purchase it in the form of jewelry (which, in many cultures, serves as a primary store of family wealth) and invest in bars and coins, not primarily for its practical applications, but because they trust it will preserve purchasing power or be desired by others in the future. This shared belief, this social consensus, is the bedrock of gold's value far more than its limited industrial applications. Some estimate this monetary premium to be as high as 90% of its total price, with the remaining 10% attributable to its use in jewelry and industry.
4. The Shifting Sands of Perceived Value
The notion that value is intrinsic and immutable is challenged by history itself. Value, as many economists and observers contend, is not an inherent property of an object but is determined by human perception and utility, which can and do change over time.
Consider aluminum. There was a time when aluminum was exceedingly rare and difficult to extract, making it more precious than gold. The capstone of the Washington Monument, completed in the late 19th century, was made of aluminum to signify its value and the technological prowess of the era. Today, thanks to advancements in refining processes, aluminum is abundant and inexpensive. We use it to wrap sandwiches, a far cry from its days as a "precious" metal adorning national monuments.
Similarly, Tyrian purple dye, derived from sea snails, was once so costly and labor-intensive to produce that its use was reserved for royalty and the highest echelons of society. It symbolized power and status. The invention of synthetic dyes in the 19th century made purple accessible to everyone, and the immense value once attached to the natural version evaporated.
These examples powerfully illustrate that what society deems valuable is not fixed. It is contingent on factors like scarcity (natural or artificial), the current state of technology, cultural significance, and collective human agreement. If gold's value is predominantly a monetary premium built on historical consensus and aesthetic appeal, then it too is subject to these shifting sands of human perception. The humorous desire to one day wrap sandwiches in gold foil, should it lose its monetary status, underscores this potential for radical revaluation.
5. Bitcoin's Utility: Solving Problems of the Digital Age
If gold's claim to "intrinsic value" through industrial use is tenuous, and its primary value stems from a historically constructed monetary premium, how does Bitcoin compare? Critics often dismiss Bitcoin as having no utility beyond speculation, a digital tulip mania. However, this perspective often overlooks the specific problems Bitcoin was designed to address and the unique properties it offers in the 21st century.
Bitcoin emerged in the wake of the 2008 financial crisis as a "peer-to-peer electronic cash system," aiming to provide an alternative to the traditional financial system. Its utility lies in its ability to offer:
• Decentralization: No single entity, corporation, or government controls the Bitcoin network. It operates on a distributed ledger (the blockchain) maintained by thousands of computers worldwide. This makes it resistant to control or shutdown by any central authority.
• Permissionless Access: Anyone with an internet connection can participate in the Bitcoin network – send, receive, and store value – without needing permission from a bank or government.
• Censorship Resistance: Once transactions are confirmed and added to the blockchain, they are extremely difficult to alter or reverse. This makes it a powerful tool for individuals in environments where financial censorship is a concern.
• Provable Scarcity: The Bitcoin protocol dictates that there will only ever be a maximum of 21 million bitcoins. This hard cap on supply is a fundamental aspect of its design, making it a verifiably scarce digital asset. This contrasts with gold, where new supply is continuously mined each year, estimated by some to be around 1.5-2% of the existing above-ground stock, arguably diluting its value over time.
• Portability and Divisibility: Bitcoin is incredibly portable. Vast sums can be "carried" on a tiny device or even memorized as a seed phrase, and transferred across the globe in minutes for relatively low fees. It is also highly divisible, down to one hundred millionth of a bitcoin (a "satoshi"), facilitating transactions of various sizes.
• Verifiability: The authenticity and transaction history of every bitcoin can be publicly verified on the blockchain, eliminating the need for trust in intermediaries for this purpose.
• Durability: As a digital asset secured by a vast, decentralized network, Bitcoin is highly durable as long as the network itself remains operational and secure.
A crucial real-world utility, highlighted by observers, is Bitcoin's ability to bypass capital controls. For individuals in countries with restrictive financial regimes, Bitcoin offers a means to transact and move value across borders with a degree of freedom not possible through traditional channels. This is not a speculative feature; it is a tangible benefit solving a real problem for many.
While the number of people using Bitcoin worldwide is still relatively small compared to users of traditional financial systems, its adoption is growing. Like any transformative technology, its utility is being discovered and leveraged by an expanding user base. Its "intrinsic value," if we are to use that term, lies in its capacity to fulfill these unique functions.
6. Gold vs. Bitcoin: A Clash of Properties
When we compare gold and Bitcoin based on properties often associated with a store of value or monetary good, distinct profiles emerge:
• Tangibility: Gold is physical; you can touch it. This offers a psychological comfort that some find reassuring. Bitcoin is digital; its existence is as code and ledger entries. Its "possession" is through control of cryptographic private keys.
• Industrial Utility: Gold has limited industrial uses that account for a tiny fraction of its price. Bitcoin's "industrial utility" is the operation of its network as a global system for value transfer and verification.
• Scarcity: Gold is naturally scarce, but its total earthly and cosmic abundance is unknown, and new supply is constantly mined. Bitcoin has absolute, programmable scarcity with a fixed supply cap.
• Portability: Moving large amounts of gold is cumbersome, expensive, and risky. Bitcoin is exceptionally portable.
• Divisibility: Gold can be physically divided, but it's not a seamless process. Bitcoin is easily and precisely divisible.
• Verifiability: Authenticating gold requires specialized knowledge and tools; it can be faked. Bitcoin transactions and holdings are verifiable with mathematical certainty on its public ledger.
• Durability: Gold is physically very durable. Bitcoin, as a digital protocol, is durable as long as its decentralized network is maintained and secured.
• Historical Precedent: Gold boasts millennia of use. Bitcoin is a little over a decade old, a mere infant by comparison.
• Censorship/Seizure Resistance: Physical gold can be, and has been, confiscated. Self-custodied Bitcoin, with properly secured private keys, is highly resistant to censorship and seizure.
This comparison reveals that while gold's strengths lie in its long history and physical presence, Bitcoin excels in areas like absolute scarcity, portability, divisibility, verifiability, and censorship resistance – attributes that are arguably increasingly valuable in an increasingly digital and interconnected global landscape.
7. The "Next Person" Fallacy and the Foundation of Value
A common critique leveled at both gold (for its monetary premium) and Bitcoin is that their value depends solely on "the next person being willing to buy it." In a sense, this is true for any asset that isn't consumed directly or doesn't produce cash flows. The value of a collectible, a piece of art, or indeed a monetary good, is ultimately what someone else is prepared to exchange for it.
However, this doesn't mean their value is arbitrary or baseless. The willingness of the "next person" to buy is predicated on a shared understanding or belief in the asset's desirable properties and its potential to retain or increase its value. For gold, this belief is built on thousands of years of tradition and its perceived enduring qualities. For Bitcoin, this belief is growing based on its unique technological attributes, its potential to solve modern financial problems, and its emerging network effects. The more people who recognize and utilize these properties, the stronger the shared belief, and thus the more robust its value becomes.
8. The Cost of Production and the Illusion of a Price Floor
Some argue that gold's price cannot fall below its cost of extraction, suggesting this provides a natural price floor. While it's true that miners would cease operations if the price fell below their production costs for a sustained period, this argument largely ignores the colossal 184,000 tonnes of gold already above ground and held primarily for monetary or aesthetic purposes. If this massive hoard were to lose its monetary premium and be dumped onto the market, the price could plummet dramatically, far below current mining costs, until it reached a level where industrial demand (or perhaps a new, much lower equilibrium for aesthetic use) could absorb it. Much of this existing stock could be made available at recycling costs, which are significantly lower than mining costs. The "cost of production" floor applies primarily to newly added supply, not to the revaluation of existing, hoarded stock.
Conclusion: Beyond Intrinsic – Value in Utility and Belief
The debate over whether gold has "intrinsic value" that Bitcoin lacks often misses the mark by clinging to a nebulous and misapplied concept. If "intrinsic value" refers to a baseline worth derived from non-monetary, practical utility, then gold's claim is surprisingly weak. Its industrial applications are minimal compared to its price, which is overwhelmingly a monetary premium built on centuries of human belief, cultural acceptance, and its historical role as money.
Value, ultimately, is not an inherent property magically residing within an object. It is a subjective judgment made by individuals, a reflection of an asset's perceived utility and the collective belief in its future desirability. Gold has served humanity well as a store of value due to a set of physical properties that were optimal for pre-digital eras. Bitcoin, a product of the digital age, offers a different set of properties – provable scarcity, decentralization, censorship resistance, and unparalleled portability – that address the challenges and opportunities of our modern world.
Neither gold's sheen nor Bitcoin's bits possess a mystical "intrinsic value" independent of human perception and use. Gold's value is rooted in its long history and the enduring human affinity for its beauty and permanence. Bitcoin's burgeoning value is rooted in its innovative technology and its potential to offer a new paradigm for money and value transfer. Both are valuable because, and only because, people believe them to be. The critical difference lies in the reasons for that belief and the problems each asset is perceived to solve. As the world continues to evolve, so too will our understanding and assignment of value.
