"Gold Analysis Using Elliott Wave: Prolonged ABC Correction"I believe that gold is currently undergoing a significant and prolonged ABC correction. At the moment, we are in a subordinate wave structure, specifically within a WXY correction pattern, marked on the chart with , , , , , and in red.
For the upcoming weeks and days, it is crucial to observe the potential price movements. In my chart, I have drawn the larger timeframe with white lines to illustrate the overarching trend, while a red line indicates the smaller, subordinate wave structure.
Currently, we are in the red-marked WXY zone, which suggests that around the 3,286 level could be an ideal point to enter a long position targeting higher levels in wave Y. Conversely, this could also be an opportune moment to short down to wave B and then C.
On the short-term chart, we are at point A, marked in yellow. After reaching A, I expect a trend reversal within the highlighted rectangle towards B (also marked in yellow), followed by an upward move to C.
Subsequently, we may see a five-wave decline labeled as i, ii, iii, iv, v. After this decline, a corrective upward movement is anticipated, characterized by an ABC pattern.
These are my expectations for gold based on this analysis. Please note that this information is for educational purposes only; there are no guarantees regarding trade execution or outcomes. Whether you decide to enter a position or not depends solely on your own judgment.
Goldlong

"Gold Analysis Using Elliott Wave: Prolonged ABC Correction"I believe that gold is currently undergoing a significant and prolonged ABC correction. At the moment, we are in a subordinate wave structure, specifically within a WXY correction pattern, marked on the chart with , , , , , and in red.
For the upcoming weeks and days, it is crucial to observe the potential price movements. In my chart, I have drawn the larger timeframe with white lines to illustrate the overarching trend, while a red line indicates the smaller, subordinate wave structure.
Currently, we are in the red-marked WXY zone, which suggests that around the 3,286 level could be an ideal point to enter a long position targeting higher levels in wave Y. Conversely, this could also be an opportune moment to short down to wave B and then C.
On the short-term chart, we are at point A, marked in yellow. After reaching A, I expect a trend reversal within the highlighted rectangle towards B (also marked in yellow), followed by an upward move to C.
Subsequently, we may see a five-wave decline labeled as i, ii, iii, iv, v. After this decline, a corrective upward movement is anticipated, characterized by an ABC pattern.
These are my expectations for gold based on this analysis. Please note that this information is for educational purposes only; there are no guarantees regarding trade execution or outcomes. Whether you decide to enter a position or not depends solely on your own judgment.

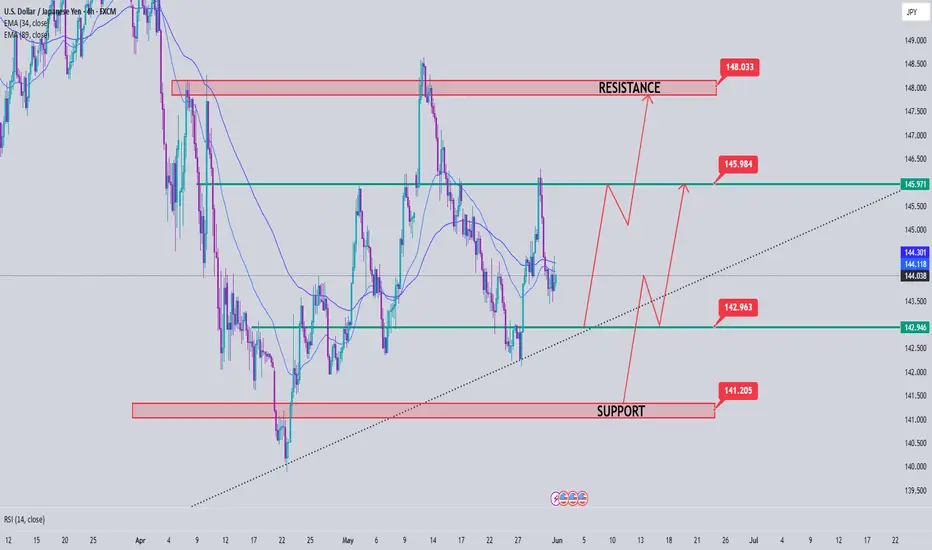
USDJPY Analysis week 23Fundamental Analysis
Tokyo's core CPI (excluding fresh food) - a key inflation gauge - rose 3.6%, higher than forecast and last month. This increases the possibility that the Bank of Japan (BoJ) will continue to raise interest rates this year, although most experts predict the BoJ will keep rates unchanged until September.
Meanwhile, the USD rose sharply after a US appeals court overturned the decision to remove most of the tariffs imposed by Mr. Trump. However, the Yen still appreciated slightly against the USD.
Technical Analysis
After consecutive declines on Friday, the pair is sideways waiting for the next development. 142.900 is the next support zone that the pair faces, this is the breakout zone and also the trendline meeting. Break this price zone must wait 141,200 for weekly support zone
145,900 last week's peak resistance zone acts as resistance for the pair's price reaction towards this week's resistance peak around 148,000
European session focuses on 3312 to accelerate the opening of th
Today, I still treat it as bearish. The market rebounded to 3322 and then started to fall, which is different from our expectations. The retracement and decline accelerated after breaking 3312. The current lowest is 3290. The main bearish idea is correct, but there is still room for decline. Now let me tell you about today's risk data!
On Friday, the U.S. Bureau of Economic Analysis will release the personal consumption expenditure (PCE) price index for April. As the most favored inflation indicator of the Federal Reserve, the year-on-year change of the core PCE price index has a greater impact on policymakers.
If the data is released today, the core PCE price index in April will rise faster than expected. The direct reaction of the market may lead investors to prefer the policy interest rate to remain unchanged in July. In this case, the US dollar may gather strength, causing gold prices to fall before the weekend.
A view on the trend of gold in the European session
Gold opened today with a maximum rise of 3322 and then started to fall. As of now, the lowest price has retreated to 3290. At present, it is not ruled out that gold will fluctuate widely, but my view on the trend is still biased towards the short side. Today's accelerated opening is at 3312. The current rebound strength still depends on the strength of the European session. In the European session, we should first focus on the 3312 line. If there is pressure, we will still look down to 3280! Otherwise, we have to test the high point of the opening above.
But if the European session directly breaks through the 3280 line, there is still room for decline, and the support is at the 3260-50 line. In addition, today is the last day of the monthly line closing, and the range of fluctuations has not yet left. If there is no suitable entry opportunity, just wait patiently. In my personal opinion, if the closing is below 3320, June is still short for the time being.
Gold: Short near 3212, defense above 20, target 3280, break to see 60 line!

It seems calm, but there are actually undercurrents!Today, the monthly, weekly and daily lines closed simultaneously. At the same time, the PCE data will be released during the US trading session, and the market volatility may intensify.
From a technical point of view, 3285 is also the key to long and short today. If gold does not break 3285 today, the strength of gold bulls is expected to continue, and there is still room for gold to move upward. If gold continues to fall and falls below 3285, then gold may begin to fluctuate in a large range. The upper resistance is in the 3320-3330 area, and the focus is on the 3335-3340 line of suppression. Pay attention to the 3290-3285 line of support below, and the key position below is in the 3280 area. If it breaks below the 3280 area during the day, the market is expected to fall again to the 3265-3250-3240 area.

The end of the triple cycle faces a big test of data
Today is the closing of the monthly, weekly and daily lines, and the PCE data will be released, so the market volatility may increase. Looking at the four-hour level of gold, the downward trend line remains intact. As time goes by, the suppression level has also come to around 3345. In view of the fact that the rebound of 3245 at 3330 is blocked and moves downward, today's Asia-Europe session strategy focuses on the continuation of the downward trend; at the hourly level, the last high point of 3365 has been trading below the trend line since the decline. Yesterday's high broke the trend line, but today's opening fell below 3308, so the short-term trend has returned to the short position again. Therefore, today is still bearish, short-selling ideas.
The specific operation is to intervene in short positions below 3310, with a short-term target of around 3278; wait for a rebound near 3288 and short again to look at the target of 3245; mid-term operations can directly focus on the 3245 position, followed by the 3200 mark.

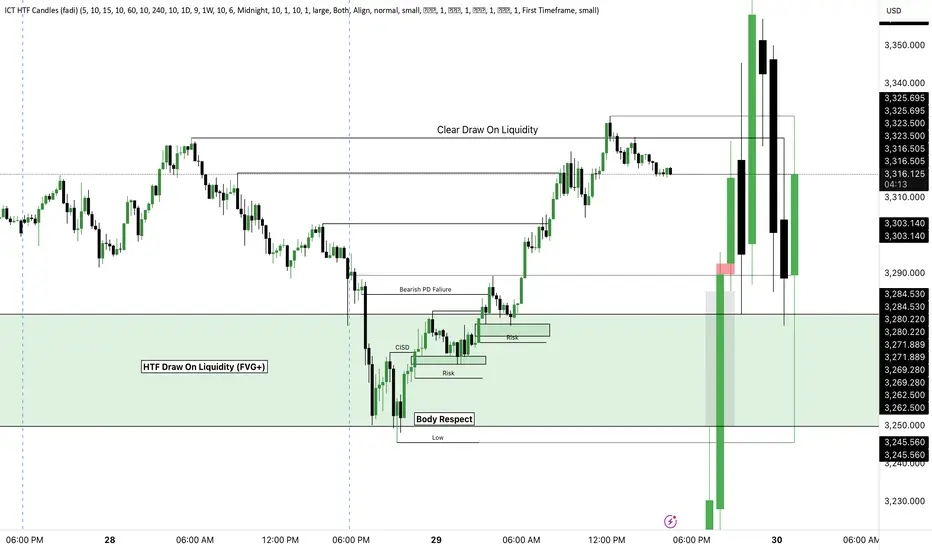
XAUUSD - Clean HTF Price Action 15-Minute Price Action Breakdown | Liquidity Sweep Into HTF FVG and CISD Model
The 15-minute chart illustrates a precise example of liquidity engineering and reversal within the framework of a higher timeframe draw on liquidity. Here's a breakdown of what occurred:
---
Contextual Framework
Price was clearly drawn toward a high time frame imbalance zone, labeled as the HTF Draw On Liquidity (FVG+). This zone was formed from a daily fair value gap and aligned with a major swing low, creating a perfect magnet for price.
---
Liquidity Sweep
As anticipated, price aggressively swept the prior lows, diving deep into the HTF FVG. This move triggered stop orders and induced sell-side liquidity just before a sharp reversal occurred. The aggressive reaction off the low confirmed the presence of smart money activity.
---
Model In Play: CISD, Risk Entries, and Clear Draw On Liquidity
After the sweep, a clean Change In State of Delivery (CISD) was printed. This marked the shift in order flow and offered confirmation that the previous bearish delivery had been invalidated. From this point, price began forming clean risk entry setups on the 15-minute chart.
Each retracement into minor imbalances respected the HTF FVG body perfectly. Price began stair-stepping higher with well-defined risk, offering multiple opportunities to join the move.
The clear target was the obvious draw on liquidity above the prior highs. Price reached and cleared that level cleanly, completing the full liquidity cycle.
---
Conclusion
This is a textbook case of smart money mechanics:
Price sweeps sell-side liquidity into an HTF imbalance
Market structure shifts via CISD
Price offers clean risk-defined entries
Final target is the high-probability draw on liquidity above recent highs
A clean and mechanical model, perfectly aligned across multiple timeframes.
GOLD ROUTE MAP UPDATEHey Everyone,
Please see update on our 1H chart route map from yesterday.
Another great day on the charts with our analysis playing out like we said.
Yesterday we stated; no EMA5 lock above 3317, forcing a rejection back to the retracement range.
We then stated that we are expecting continued reactions within this retracement range, inline with our plans to buy dips. Our updated levels and weighted levels help us track downward movements and catch bounce setups.
- This played out perfectly with the reaction from the retracement range into 3317. We will now look for a lock above this level for a continuation or failure to lock will follow with a rejection back into the lower Goldturns for support and bounce.
We'll continue to buy dips using our key support levels, targeting 20 to 40 pip moves. As always, each level structure provides consistent bounce zones, offering great opportunities for both entry and exit. If you backtest the levels we’ve shared every week over the past 24 months, you’ll see how effectively they work with or against short to mid term swings and trends.
Remember:
Swing ranges yield bigger bounces than weighted levels — that’s the key difference.
BULLISH TARGET
3389
EMA5 CROSS AND LOCK ABOVE 3389 WILL OPEN THE FOLLOWING BULLISH TARGETS
3428
EMA5 CROSS AND LOCK ABOVE 3428 WILL OPEN THE FOLLOWING BULLISH TARGET
3478
EMA5 CROSS AND LOCK ABOVE 3478 WILL OPEN THE FOLLOWING BULLISH TARGET
3517
BEARISH TARGETS
3352 - DONE
EMA5 CROSS AND LOCK BELOW 3352 WILL OPEN THE FOLLOWING BEARISH TARGET
3317 - DONE
EMA5 CROSS AND LOCK BELOW 3317 WILL OPEN THE FOLLOWING BEARISH TARGET
3282
EMA5 CROSS AND LOCK BELOW 3282 WILL OPEN THE FOLLOWING BEARISH TARGET
3233
EMA5 CROSS AND LOCK BELOW 3233 WILL OPEN THE SWING RANGE
3185
3146
As always, we’ll keep you all updated with real time analysis and management of active setups throughout the week. Thank you for your continued support, your likes, comments, and follows mean a lot!
Mr Gold
GoldViewFX

The direction is reversed, let's go short together
Views on the trend of gold in the European session!
The view of continued retracement remains unchanged. Although the market fell sharply at the opening and quickly rebounded again, it is still suppressed by the short-selling pattern. Even if there is a large rebound and a break, it is only a lure to buy. In fact, it is a short-selling after the wash. In addition, it has been fluctuating and adjusting for several weeks, but we have been paying attention to the high-rising big positive line closing last week, but we did not expect it to continue to weaken this week.
This is just the beginning of the short-selling. 3280 is the previous low support of gold price. After testing the support, a short-term long-short reversal is formed. It retreats and breaks the low point. It is expected that it will continue to test the low point today. The gold price will be dominated by a short-selling decline. The current round of decline has not been reversed, and the short-selling target below is still the 3233 and 3209 levels!
Gold: Continue to short near 3280 after the second pullback, defend 8-10 US dollars, target 3233-30, break through and look down to 3209! On the contrary, you can enter long positions in the short term and bet on a rebound!

Top and bottom conversion, short position continues?📰 Impact of news:
1. The International Trade Court ruled that Trump exceeded his authority, and the previous tariffs may be suspended
2. Ukraine submitted a ceasefire document to Russia
3. Pay attention to the initial jobless claims data during the US trading session
📈 Market analysis:
The U.S. Court of International Trade in Manhattan blocked Trump’s “Liberation Day” trade measures, ruling that Trump had overstepped his authority by imposing sweeping tariffs on countries that export more to the United States than they import without authorization from Congress. This means that most of Trump's tariffs will be suspended. But at the same time, the recent geopolitical impact cannot be ignored. In addition, the initial jobless claims data will be released during the U.S. trading session today. Independent traders must set stop losses.
From a technical point of view, the 1H level chart of gold shows that the Bollinger Bands open downward, and the gold price is near the lower track, showing a weak pattern in the short term. Considering that 3285 is the previous low point, there is also a possibility of suppression at 3285. Therefore, we should pay close attention to the resistance range of 3285-3295. If the gold price in the Asian and European sessions can stabilize below 3295, then we can rely on the 3285-3295 range to enter the market and short. On the contrary, if the pullback today stands above 3300, then we should not chase the short easily.
🏅 Trading strategies:
SELL 3285-3295
TP 3270-3260-3250
If you agree with this view, or have a better idea, please leave a message in the comment area. I look forward to hearing different voices.
OANDA:XAUUSD FX:XAUUSD FOREXCOM:XAUUSD FOREXCOM:XAUUSD FXOPEN:XAUUSD TVC:GOLD

Analysis and layout of gold trend in the US market📰 Impact of news:
1. Initial jobless claims data is positive
2. The White House is tough on the court ruling: Trump will win! Three trade agreements are close to being reached
📈 Market analysis:
I think the current rebound should not be directly judged as a unilateral trend. From a technical point of view, in the 4H cycle, the upper 3320-3325 line has a certain suppression force in the short term. If the gold price runs below 3325, we need to be alert to the risk of a high rebound. We can try to arrange short orders based on the 3320-3325 range, and bet on the high selling opportunities in the volatile market. Independent trading with a good stop loss. However, it should be noted that if the price quickly breaks through the 3330 line in the short term and stands above it, it is expected to rise to the 3340-3350 area. At the same time, I think the support below can first look at the 3300 line, with a focus on the 3290-3285 line support.
🏅 Trading strategies:
SELL 3320-3325
TP 3310-3300
BUY 3295-3285
TP 3300-3310-3320
If you agree with this view, or have a better idea, please leave a message in the comment area. I look forward to hearing different voices.

The golden range strategy continues to workGold bottomed out and rebounded as expected today. Friends who follow me should be able to clearly feel that I have been insisting on analyzing the trend of "bottoming out and rebounding" recently. Today, gold opened at 3300, and rebounded after the lowest price fell to around 3291. So far, the highest price has reached 3325. Overall, the support below gold is still strong, but the suppression above cannot be ignored. Therefore, the market performance yesterday and today was relatively stable, with small fluctuations as the main trend.
In terms of operation ideas, continue to pay attention to the support level of 3290-3295. If it falls back and does not break, maintain a bullish mindset. At present, the long orders in the 3290-3295 range have been notified to enter the market as planned, and are currently in the profit stage. If you encounter difficulties in the current gold market operation, I hope my analysis can help you. Welcome to communicate at any time.
From the 4-hour cycle chart, the support below gold is around 3290-3295, and the pressure above is concentrated in the 3330-3340 range. In the short term, the watershed between long and short is around 3275-3283. Before the daily level effectively falls below the watershed, it is still in a long-short shock pattern, maintaining the main theme of "high-altitude and low-multiple" cycle participation.
Gold operation strategy: If gold falls back to the 3290-3295 line, you can try to go long. If it further falls back to the 3280-3285 line, you can consider covering long orders, and the target is around 3316-3320.

Gold shocks extreme pull, US market layout🗞News side:
1. Musk issued the "strongest" condemnation of Trump
2. Trump and Netanyahu failed to reach an agreement, and the US-Iran negotiations may be "disrupted" by Israel
📈Technical aspects:
The trading strategy we have given is still valid. The current gold price trend on the hourly chart shows a standard descending flag pattern. If this pattern continues to be effective, there is a high possibility that the gold price will fall below 3285-3280. Once it falls below this range, as we gave in the strategy this morning, it may fall to the 3260-3250 line. However, the premise for this expectation to be established is that the gold price cannot break through and stabilize on the upper track of the consolidation channel, otherwise the descending flag pattern will be invalid. Therefore, for US market operations, short positions can be arranged around the upper rail of 3325, paying attention to the suppression effect; for the lower rail, first pay attention to the support effect of 3300.
sell 3325-3330
TP 3310-3300
buy 3290-3280
TP 3310-3320
If you agree with this view, or have a better idea, please leave a message in the comment area. I look forward to hearing different voices.
FOREXCOM:XAUUSD FXOPEN:XAUUSD TVC:GOLD FX:XAUUSD OANDA:XAUUSD

Gold ABC Pattern Suggest Powerful BreakoutGOLD ANALYSIS 🟡 | Bullish Setup Building
Price is retracing after completing a corrective wave structure (A–B–C) under major descending trendline resistance. We're now sitting just above the 200 EMA and entering key demand zones aligned with ascending trendline support.
🔹 Confluences:
Trendline support + demand zone
200 EMA holding as dynamic support
Corrective structure complete (Wave C)
Higher timeframe bullish structure intact
📌 Buy Zones: $3,220 – $3,180
🎯 Target: Retest of $3,434
🛑 Invalidation: Clean break below $3,160
Price is setting up for a potential bullish continuation — watching for bullish confirmation from these demand zones. Patience is key.

Gold trading zones: 29-May-2025Good morning! Find today's Gold trading zones and enhance your market analysis.

Trade Idea:XAUUSD Short ( SELL LIMIT )📉 Multi-Timeframe Breakdown
🔹 H4 Chart (Macro Bias)
• Trend Context: Price is still broadly in an uptrend on the H4, but it’s testing the 50 SMA from above.
• MACD: Bearish crossover below the signal line suggests waning bullish momentum.
• Volume: Slight uptick in bearish volume as price pulls back from the recent highs.
• Bias: Neutral to Bearish Short-Term (H4 trend remains up, but weakening).
🔹 M15 Chart (Setup Zone)
• Structure: A sharp selloff broke both the 20 SMA and 50 SMA.
• Momentum: RSI ~16, oversold—but that can persist in strong trends.
• Volume: Large spike on the breakdown candle = strong bearish interest.
• ATR: 7.97 = elevated volatility.
• Bias: Bearish momentum, potential pullback retest opportunity.
🔹 M3 Chart (Execution Focus)
• Price Action: Freefall with clean rejections at the 20 SMA.
• Volume Spike: Bears in control, RSI also confirms momentum exhaustion but no reversal confirmation yet.
• Bias: Bearish with potential for bounce/pullback retest entry.
⸻
✅ Primary Trade Setup
Type: 🟥 Sell Limit
Rationale: Let price retrace into resistance before fading it, using structure for confirmation.
Entry Zone: 3270–3276 area (prior support becomes resistance near 20 SMA on M15 and 50 SMA on M3).
Stop Loss: Above structure high → 3283
Take Profit: Next key support zone ~3245–3250 (measured move + demand zone on M15/M3).
📌 Sell Limit Order
• Sell Limit @ 3273
• SL @ 3283
• TP @ 3248
FUSIONMARKETS:XAUUSD

GOLD - LET CLIMB THE MOUNTAIN OF GOLDTeam, I was being patience for a week, did couple of long position, then short then long.
But this time I wait and wait until it reach my entry range price
GOLD is good to entry NOW
target 1 at 3272-3276
Target 2 at 3283-3306
STOP LOSS at 3232 - Once it hit our first target - bring stop loss to BE
i expect the GOLD will likely recover a little during TOKYO, but definitely fly back during UK market opening..
so therefore you need to be patience on this.. as the TRENDING still down trend.

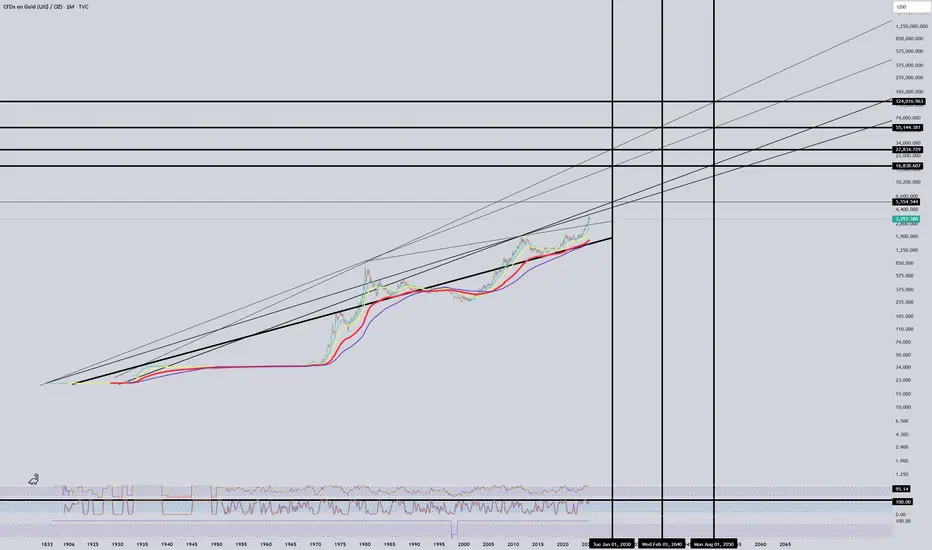
A break above $5500 would be huge. If this breaks above $5500 by 2030, the sky is the limit. Lots of key horizontal lines to reach above!
Gold fluctuates repeatedly, and the opportunity has come
Gold hit 3325 in the European session, and fell under pressure in the US session. It can be seen that the market still has no continuity, and the recent volatility is narrowing compared to the previous period. The whole month of May was a wide range of roller coaster fluctuations.
The oscillating market is to operate at the point of card. Wait for a one-sided trend and then follow the trend. Short-term US market rebounds to 3315 to short, and use the intraday high as defense. The 1H cycle support below 3280/3290 is long in batches, and other positions are not involved.

Is Gold’s Momentum Strong Enough to Break $3,400?📊 Market Overview:
Gold prices retreated slightly as stronger-than-expected U.S. consumer confidence data boosted expectations that the Federal Reserve may keep interest rates elevated for an extended period. This lent strength to the U.S. dollar, weighing on gold. Meanwhile, a more stable geopolitical tone—particularly in U.S.-EU trade discussions—has reduced safe-haven flows into gold.
📉 Technical Analysis:
• Key Resistance: $3,345 – $3,355
• Nearest Support: $3,270 – $3,280
📌 Outlook:
Gold may remain under pressure in the short term if the U.S. dollar stays firm and the Fed’s hawkish stance persists. However, the $3,270 support zone remains a key pivot for any potential rebound.
💡 Suggested Trading Strategy:
SELL XAU/USD at: $3,345 - $3,350
🎯 TP: $3,325
❌ SL: $3,355
BUY XAU/USD at: $3,270 – $3,280
🎯 TP: $3,290
❌ SL: $3,260

Golden Jedi counterattack! Key support ignites the bull engine📌 Gold Technical Analysis & Operation Strategy Update
Gold bottomed out and rebounded as expected, and the trend basically met recent expectations - oscillating upward around the support range below.
💡 Key Point Review
Today, gold opened at around 3300, with a minimum of 3291, and then rebounded, reaching a maximum of 3325. The overall trend still fluctuates within the range, with strong support below and obvious suppression above, and the overall performance is a narrow range of fluctuations.
📉 4-hour chart analysis
Support focus: 3285-3295 area
Pressure focus: 3330-3340 area
Short-term long-short watershed: 3275-3283 line
🔎 Before effectively falling below the watershed, it is still mainly seen as range fluctuations, and the high-altitude low-multiple strategy continues to be implemented.
📈 Operation strategy suggestions
1️⃣ Try to go long with a light position if the price falls back to 3295-3300
2️⃣ If the price falls back to 3280-3285, you can add to your position appropriately
🎯 Target focus: 3316-3320, and look to 3330-3340 after breaking through
⚠️ Risk control suggestions: strictly set stop loss, control position, and prevent the risk of range breakout.

XAUUSD Long PositionI've just entered this Long position on Gold and I'm looking to hold this position and eventually sell when price reaches the short-term resistance level at around the "3,360.00" area.
#GOLD #XAU #XAUUSD #LONG #BUY OANDA:XAUUSD

Gold May Undergo Short-Term Correction as USD Rebounds📊 Market Overview:
Gold (XAU/USD) is trading around $3,320/oz on May 28, 2025, after failing to break above a key resistance zone. The US dollar’s recovery and rising Treasury yields are putting short-term pressure on gold, despite lingering geopolitical tensions.
📉 Technical Analysis:
• Key Resistance: $3,330 – $3,360
• Nearest Support: $3,280 – $3,235
• EMA 09: Price is currently above the EMA 09, indicating that the upward trend remains intact.
• RSI Indicator: RSI stays above the 50 level, suggesting momentum is still bullish.
• Candlestick Pattern: A doji near the $3,330 zone signals market indecision.
📌 Outlook:
Gold may see a mild correction if the USD continues to strengthen. However, holding above $3,280 would keep the bullish momentum alive.
💡 Suggested Trading Strategy:
🔻 SELL XAU/USD at: $3,330
🎯 TP: $3,310 (200 pips)
❌ SL: $3,340
🔺 BUY XAU/USD at: $3,285
🎯 TP: $3,305 (200 pips)
❌ SL: $3,275
