Gold trading insights: 28-May-2025Gold trading insights for today: Explore our zones for informed decision-making.
Goldlong


XAU/USD Bounces Off Strong Support Zone – Bullish MomentumGold (XAU/USD) has shown a strong bounce from the clearly defined support zone around the 3280–3290 level on the 1-hour timeframe. This zone has held multiple times in the past, confirming its significance. Additionally, the 200 EMA (red) is aligned with this horizontal support, creating a strong confluence area. Price action has respected this level, forming a bullish reversal candle setup, indicating potential for upside movement.
Based on this structure, a long (buy) trade can be considered around the 3300–3305 range, ideally after a bullish confirmation candle or price holding above the EMAs. This entry provides an opportunity to ride the next wave upward while maintaining a favorable risk-to-reward ratio.
The stop loss for this trade should be placed just below the support zone—around 3275 USD. Placing the stop slightly below this area protects against fakeouts while still maintaining good risk control. This is a logical level where the setup would be invalidated if breached.
For targets, the first potential resistance and partial profit booking zone is near 3335–3340 USD. This zone acted as resistance during previous price swings. If momentum sustains, the second target zone is around 3360–3370 USD, which marks a previous swing high and a likely destination for bullish continuation. For extended upside potential, traders can aim for 3385+ USD, especially if the price action is supported by volume and broader market sentiment.
This setup offers a clean technical play with a risk-reward ratio of approximately 1:2.5 or higher. Traders can also trail their stop-loss once the price crosses above the first target to protect gains while riding further upside.
=================================================================
Disclosure: I am part of Trade Nation's Influencer program and receive a monthly fee for using their TradingView charts in my analysis.

Today we will focus on the 3281 support
Gold fell below 3300, today we focus on the support of 3281
We are making a profit from the long suggestions given during the day, focusing on the support near 3281. If this position is not broken, the price will fluctuate and may re-stand on 3300 and go above 3320. Therefore, we insist on the long idea today, short around 3287-90, stop loss 3280, take profit at 3310-20, pay attention to the risk.
May 27 gold short-term trading: long near 3288, stop loss 3280, take profit at 3320
Be careful, if it breaks 3280, it is expected to reach 3260, and you can go bearish.

3300 becomes the dividing line between long and short positions🗞News side:
1. The situation in the Middle East and between Russia and Ukraine has escalated again
2. Pay attention to the opening of US stocks today
📈Technical aspects:
Good morning, bros. Gold is currently testing the important support of 3300. Once it falls below 3300, it can be officially confirmed that the correction trend is coming. Today's opening of the U.S. stock market is critical. If the U.S. stock market opens higher, it is very likely to pull down gold prices. The stable operation suggestion for the day is to go long when it retreats to 3295-3290, and then rely on the upper side of the previous low point for protection, that is, look at the vicinity of 3325-3330. If it encounters resistance and pressure near 3330-3340, you can consider entering a short position and continue to be bearish. At present, the first focus below is the support of 3290-3280. If it continues to fall, it may touch the 3266 line.
If you agree with this view, or have a better idea, please leave a message in the comment area. I look forward to hearing different voices.
OANDA:XAUUSD FX:XAUUSD TVC:GOLD FXOPEN:XAUUSD FOREXCOM:XAUUSD
Just continue to maintain the bullish idea of high-altitude an
On Monday, gold closed slightly lower as Trump's comments on EU tariffs boosted market risk appetite. Today, it retreated and rose in the morning and now fell below our early long position again. In the short term, gold has lost its positive momentum, but it is impossible to fall more sharply. As investors weigh the prospects of improved trade relations between the United States and the European Union, the demand for safe-haven assets has cooled, and gold prices have maintained a downward trend.
Today's risk data warning!
At 20:30 today, the initial value of US durable goods orders in April will be released, and the monthly rate is expected to fall by 7.9%, after an increase of 9.2% in March
At 22:00 today, the US Conference Board Consumer Confidence Index for May will be released, and it is expected to be 87.2, and the previous value is 86.0.
Views on the trend of gold in the European session!
Gold rose and then fell yesterday, and the final rebound stopped at 3365. The trend is in line with our trend of volatility. As for today's market decline and break, it is a normal market! In addition, it has not broken through 3370 and has been under pressure, and the decline continued in the morning today. Since the support position of 3300 is close to the bottom, it is not appropriate to chase the short position!
In terms of trend, gold lacks the upward momentum at the 4-hour level, and the market falls after the upper resistance. This week's market has been maintained in the small range of 3330 and 3370. It is inevitable that the breakout will accelerate. At present, the bulls are under pressure. Unlike last week's continuous rise, this week has a bit of weak volatility. Then we continue to maintain the high-altitude bearish and low-level bullish ideas unchanged!
Gold: Enter long orders near 3290, defend 80, and target 3325-30! Continue to follow up with short orders above 3340, defend 50, and target 3300-05!
A reliable person has an explanation for everything, a solution for everything, and a response for everything. I have been committed to the market. I will write analysis that is useful to investors and make fewer mistakes. I believe that time will tell the true heart of a person. I am Yulia. Thank you for your likes. I love you.

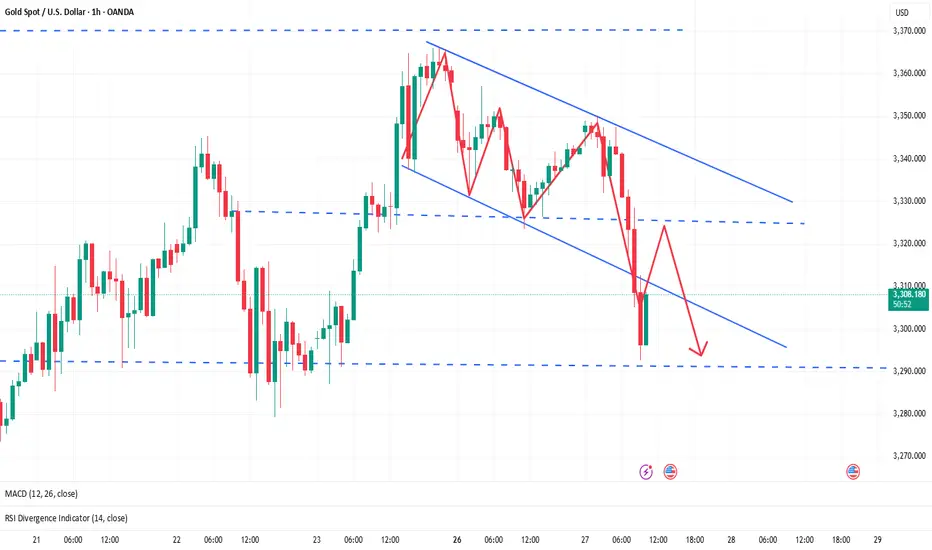
XAUUAD UPDATE : 27 - 5 - 2025The chart you've shared is a 1-hour candlestick chart of Gold (XAU/USD), showing a technical analysis with support and resistance zones, along with a projected bearish movement. Here's a detailed breakdown:
Key Observations:
1. Current Price Level:
Gold is trading around $3,322.79, slightly below a key resistance zone.
2. Resistance Zone (Top Yellow Box):
The resistance area is marked between approximately $3,360 and $3,372.
Price has previously been rejected from this zone, indicating strong selling pressure.
3. Support Zones:
Middle support zone around $3,280 – minor support where price might temporarily bounce.
Bottom support zone around $3,211.90 – strong support and likely target zone for the projected move.
4. Bearish Projection (Blue Arrows):
The analysis anticipates a potential minor retracement or consolidation, followed by a sharp move downward.
Final target appears to be just above $3,211, suggesting a potential short trade setup.
5. Volume Analysis:
Volume spikes correlate with major price movements, showing increased participation in those zones.
Possible Interpretation:
This chart suggests a bearish outlook for gold in the short term.
A trader might consider a short position if price fails to reclaim the resistance zone and confirms a break below the minor support near $3,280.
Risk management would likely involve placing a stop above the resistance zone ($3,360–$3,372), and taking profit near the $3,211 support area.
Would you like help creating a trading plan based on this chart?

Gold May Face Short-Term Correction at $3,350 Resistance📊 Market Overview:
- Gold is trading around $3,329/oz on May 27, after a slight decline due to President Donald Trump's postponement of the 50% tariffs on the EU until July 9, easing trade tensions.
- However, end-of-month USD selling pressure from portfolio rebalancing and concerns over U.S. debt continue to support gold prices.
📉 Technical Analysis:
- Key Resistance: $3,350
- Nearest Support: $3,295
- Candlestick Patterns / Volume / Momentum: The 14-day RSI is at 57, suggesting bullish momentum persists. However, price is testing strong resistance at $3,350. Failure to break through may lead to a pullback towards $3,295.
📌 Outlook:
Gold may experience a short-term pullback if it fails to break above the $3,350 resistance level and if market sentiment continues to be influenced by geopolitical and monetary policy factors.
💡 Suggested Trading Strategy:
SELL XAU/USD at: $3,345 – $3,350
🎯 TP: $3,330
❌ SL: $3,350
BUY XAU/USD at: $3,295
🎯 TP: $3,310
❌ SL: $3,390

Gold trading zones: 27-May-2025Today's Gold trading zones: Identify potential opportunities and plan your strategy.

Bitcoin vs. Gold: Central Banks Pick Gold (Here's Why)
The debate over the ultimate store of value has been reignited in the digital age. For centuries, gold, the immutable yellow metal, has been the bedrock of wealth preservation, the trusted haven in times of turmoil, and a core component of central bank reserves. In the last decade, a new contender has emerged: Bitcoin, the pioneering cryptocurrency, often touted as "digital gold." Yet, as the dust settles on initial exuberance and institutional scrutiny intensifies, a clear preference is emerging from the world's most conservative financial institutions. Central banks, the guardians of national wealth and financial stability, are overwhelmingly demonstrating their continued faith in gold, signaling that when it comes to the ultimate safe reserve, tradition and tangibility still trump technological novelty.
The evidence for this preference is not merely anecdotal; it's etched in the consistent and accelerating trend of global gold accumulation by these institutions. In recent years, central banks have been on a gold buying spree, a phenomenon driven by a confluence of potent global factors. The shifting geopolitical landscape, characterized by increased tensions, trade disputes, and a move towards a more multipolar world, has spurred a desire for assets that are not tied to any single nation's political or economic fortunes. Policies emanating from major economic powers, including periods of heightened trade protectionism and shifting global alliances, have historically fanned uncertainty, prompting a flight to assets perceived as universally valuable and politically neutral – a role gold has fulfilled for millennia.
Furthermore, concerns over the long-term value of major fiat currencies, particularly the U.S. dollar which has long dominated global reserves, are playing a significant role. Persistent fiscal deficits, expanding sovereign debt levels, and unprecedented monetary stimulus measures in various countries have led to an undercurrent of apprehension about potential currency devaluation. In such an environment, central banks are actively seeking to diversify their holdings and hedge against the erosion of purchasing power. Gold, with its intrinsic value and finite supply, offers a compelling alternative to holding ever-increasing amounts of fiat currency, whose value can be diluted by policy decisions. This strategic de-dollarization, or at least a diversification away from dollar-centric reserves, sees gold as a primary beneficiary. It is a tangible asset that sits outside the traditional financial system, offering a layer of insulation from the counterparty risks inherent in holding other nations' currencies or debt.
In stark contrast to this institutional embrace of gold stands Bitcoin. While proponents champion its decentralized nature, its mathematically enforced scarcity, and its potential as an inflation hedge, its inherent characteristics currently make it a challenging proposition for central bank reserves. The most glaring issue is its extreme volatility. Bitcoin's price history is a rollercoaster of meteoric rises and precipitous falls. For an individual retail investor, this volatility might be a tolerable, even attractive, risk in pursuit of outsized returns. However, for a central bank, whose primary mandate includes capital preservation and maintaining financial stability, such wild price swings are anathema. Reserve assets must be relatively stable, liquid, and dependable. Bitcoin, in its current state, struggles to meet these criteria consistently. A significant allocation to Bitcoin could expose a nation's reserves to sudden and substantial losses, undermining public trust and potentially destabilizing its financial position.
This volatility poses a tangible risk, not just theoretically, but as observed in the experiences of investors globally, including those in the U.S. While some have reaped fortunes, many others have faced considerable losses due to ill-timed investments or the market's unpredictable nature. Institutional investors, including those in the U.S., while showing increasing interest in Bitcoin as a speculative asset class or a small part of a diversified portfolio, still largely treat it with caution. The kind of deep, unwavering institutional trust that gold commands – built over centuries of proven performance as a store of value and a crisis hedge – has yet to be earned by Bitcoin. Gold’s market is deep, liquid, and well-understood, with established clearing and settlement mechanisms. Bitcoin's market infrastructure, while maturing, is still relatively nascent and fragmented compared to the centuries-old gold market.
Beyond volatility, other factors hinder Bitcoin's adoption as a mainstream reserve asset for central banks. Regulatory uncertainty remains a significant hurdle. The global regulatory landscape for cryptocurrencies is a patchwork of differing approaches, with some nations embracing innovation while others impose strict controls or outright bans. For central banks, which operate within stringent legal and regulatory frameworks, this lack of global consensus and clarity is a major deterrent. The operational risks associated with custody and security of digital assets at a sovereign scale are also non-trivial. While blockchain technology is inherently secure, managing private keys for billions of dollars' worth of Bitcoin requires sophisticated and untested protocols for institutions of this nature.
Furthermore, the narrative of Bitcoin as "digital gold" sometimes overlooks fundamental differences. Gold is a physical commodity with diverse industrial and cultural uses, providing a baseline of demand beyond its monetary role. It is universally recognized and accepted, transcending technological barriers. Bitcoin’s value is derived primarily from its network effects, its code, and investor belief in its future utility and adoption. While powerful, these are different underpinnings than the tangible reality of physical gold bullion held in a central bank's vault.
The actions of central banks speak volumes. While a handful of smaller nations or entities might experiment with Bitcoin, the overwhelming majority of major central banks, those that collectively manage the bulk of global reserves, have either remained silent on Bitcoin or have issued cautious warnings, all while steadily increasing their physical gold holdings. This isn't to say that Bitcoin has no future role or value. It may well continue to evolve as a speculative asset, a niche store of value for some, or a technology platform for new financial applications. However, the idea that it is poised to usurp gold's position in the vaults of central banks appears premature, if not fundamentally misguided, given its current attributes.
In conclusion, the debate between Bitcoin and gold as the preferred store of value and reserve asset has a clear, if perhaps unexciting, winner in the eyes of the world's central banks. Faced with geopolitical instability, the specter of dollar devaluation, and the enduring need for reliable safe-haven assets, these institutions are doubling down on gold. Its long history, proven stability, tangibility, and lack of counterparty risk resonate deeply with their conservative mandates. Bitcoin's volatility, regulatory ambiguity, and operational complexities, while potentially surmountable in the distant future, currently render it unsuitable for the core reserve holdings of nations. While U.S. investors and others may grapple with Bitcoin's risk-reward profile, central banks have largely made their choice, and that choice, for now and the foreseeable future, remains firmly with the ancient, trusted allure of gold.
Gold Pulls Back Slightly from Highs📊 Market Overview:
Gold (XAU/USD) slightly retreated to around $3,325/oz during the May 26 session, after reaching a two-week high of $3,365. The main reason was the increased investor risk appetite after U.S. President Donald Trump postponed a plan to impose 50% tariffs on EU goods, reducing safe-haven demand for gold.
However, the long-term bullish trend remains supported by a weakening U.S. dollar and expectations of interest rate cuts from major central banks.
📉 Technical Analysis:
• Key Resistance: $3,350 – $3,365
• Nearest Support: $3,325 – $3,285
• EMA: Price remains above the EMA50, indicating a sustained uptrend.
• RSI Indicator: Near 50, giving a neutral signal.
• MACD: Slight bullish signal.
• ADX: 36.998, indicating a strong upward trend.
• Price Pattern: Price is fluctuating within the $3,200 – $3,500 range, with the EMA50 at $3,200 acting as strong support.
📌 Outlook:
Gold may continue to experience a slight short-term correction if market risk appetite remains elevated. However, the long-term uptrend is still supported by a weak USD and expectations of rate cuts.
💡 Suggested Trading Strategy:
🔻 SELL XAU/USD at: $3,350 – $3,365
🎯 TP: $3,300
❌ SL: $3,380

Gold retreats to 3330 and continues to rise
Gold prices retreated from a two-week high of $3,365 an ounce hit last Friday. Despite the pullback, the bullish potential remains intact. Any decline in gold prices appears limited as U.S. fiscal concerns and escalating geopolitical tensions will continue to drive safe-haven demand for gold. Looking ahead to this trading day, gold prices may see a limited correction, but with the U.S. market closed on Monday to commemorate Memorial Day, the thin trading environment may amplify gold price fluctuations.
Why did gold prices plummet and soar in May?
Why did the price of gold plummet: First, the high-level trade talks between China and the United States reached an agreement, and bilateral tariffs dropped significantly, driving the market's risk appetite to rebound rapidly; second, although the U.S. CPI inflation rate in April was lower than expected, the Fed officials' statements were still cautious, hitting the market's expectations of interest rate cuts and also putting some pressure on gold prices. Finally, the rapid rise in gold prices in the previous period triggered technical adjustments, and the market took profits, which also pushed gold prices down.
Why did it rise: First, the unexpected intensification of the situation in the Middle East became a short-term flash point. Intelligence released by the United States shows that Israel may be preparing to launch a strike on Iran's nuclear facilities. The risk of escalating geopolitical conflicts is the main reason for the upward trend in gold prices. Secondly, Trump's additional tariffs and Moody's downgraded the US sovereign credit rating from the highest level Aaa to Aa1 on May 16. This move has led to a decline in market confidence in US debt, which in turn provides support for the rise in gold prices.
Views on today's gold trend!
The gold daily level closed again with a positive line, injecting new vitality into last week's trading space. The two rounds of rise not only successfully crossed the resistance level of 3250 last Monday, but also further broke through the suppression of 3320, showing a clearer upward trend. The current shock is a correction after the previous high point breakthrough! However, the short-term shock is also carried out simultaneously. The pressure of the 3370 area tested several times on Friday failed to break through effectively and continued to encounter resistance, indicating that the current pressure is still relatively strong!
From the 4-hour chart, the gold bulls are still well-positioned. Currently, it is facing resistance at 3370 near the previous high. Due to the overstretching of the bulls in the previous period, it often needs a period of adjustment. However, if further news is stimulated this week, there is still a possibility that gold will rise sharply. The key is to look at the trend of the early trading. Therefore, when betting on strength and weakness, the timing is very important. This week is expected to continue to maintain a volatile upward pattern, and the callback market can be captured. The resistance is 3370 and the support is at 3320.
Gold: Long near 3330, defense 20, target 3370 resistance


Gold bulls advance as expected Mainly go long on pullback.Today, gold opened lower and fell, reaching the lowest level of 3331. Then the bulls exerted their strength, reaching the highest level of 3356 and then adjusted back. The overall trend was highly consistent with the expected judgment. Looking back at the market last week, the technical side of gold continued the bullish pattern, and the oscillating upward trend was significant. From the daily level, the price repeatedly tested around the 3200 mark at the beginning of the week, and finally stabilized successfully, laying a solid foundation for the bull market. On Friday, it was supported by the 3280 mark, continuing the strong oscillating upward trend, forming a reverse middle Yang pattern, and the daily K line closed with an oscillating upward break of the middle Yang, fully demonstrating the short-term bullish pattern of gold prices, and bullish expectations continued to heat up.
Based on the current gold trend analysis, the focus below is on the 3330-3320 range support, and the focus above is on the 3380-3400 resistance. In terms of overall strategy, the bullish thinking is maintained before breaking 3320 to avoid blindly guessing the top.

SPX Buy Limit Active | High Precision Scalping Setup The market recently dipped below the local swing low, hitting a clearly defined demand zone on the 15-minute chart. This movement suggests that smart money might be accumulating, which could signal a potential reversal or a short-term retracement.
We’ve set a Buy Limit at 3334.63, based on solid price action and previous reactions at this level. Right now, the price is consolidating around our entry point, which boosts the likelihood of a bullish confirmation.
🔍 Entry Logic & Market Structure:
Liquidity Sweep: The lower wicks indicate a liquidity grab beneath the previous lows.
Order Block Zone: This demand zone was created by the last down candle before a significant upward move.
Imbalance Above: There’s a clear inefficiency visible between 3336.00 and 3340.00.
RR Justification: This trade offers a Risk-to-Reward ratio of 1:2+ with a tight stop loss.
🧠 Trade Details:
Buy Limit: 3334.63
Stop Loss: 3331.32
Take Profit: 3340.35
Risk-to-Reward: ~1:2.2
Timeframe: 15M
Trade Type: Intraday Reversal / Imbalance Fill
🔔 Execution Plan:
Wait for a bullish candle to close near the zone for confirmation (if you’re trading manually). If you’re using limit orders, make sure to manage your risk properly.
This setup stays valid unless the price drops below 3331.00 and closes with bearish momentum on the 15-minute chart.

GOLD M15 Intraday Chart For 26 May 2025GOLD M15 Intraday Chart just posted as you can see that there are important zone
right now market is in range so you can do couple of scalping trades in Support & Resistance range
furthermore there are 2 breakout scenarios mentioned, kindly check carefully then trade
Remember Trade always with SL

Gold market analysis: 26-May-2025Good morning! Happy New Day! Here's your daily Gold market analysis. Learn, grow, and trade wisely.

GOLDHello friends
Given the sharp upward movement we had, the price is now forming a flag pattern, and if this pattern is completed, we can wait for a new high.
*Trade safely with us*

Going long on pullbacks remains the mainstream.Fundamentals: Risk aversion is still the mainstream in the current market; risk aversion funds and risk aversion sentiment are still dominant in the gold market; although risk aversion and bullish sentiment have weakened at the war and trade war levels; the overall global fundamentals have not returned to their original state; behind various small fundamentals, there is still the possibility of triggering various risk events
Gold continued to rise on Friday due to the rise in risk aversion caused by tariffs, and the price of gold continued to rise to around 3365, and the daily line closed with a full big positive line again. If gold can successfully break through and stabilize in the 3360-3365 range in the future, the bull market is expected to regain its dominant position.
From the perspective of the 4-hour cycle, the price of gold continues to rise based on the unilateral moving average. Although there is a temporary divergence in the current indicators, in terms of form, the price of gold has achieved a short-term break. Next Monday, it is necessary to focus on the support strength of the 3345-3335 position, and the upper pressure range is maintained at 3365-3375. Do not blindly chase the rise before successfully breaking through and stabilizing. In terms of operation strategy, it is recommended to wait for the opportunity to step back, buy on dips, and continue to be bullish on gold prices. If gold can continue its strong performance next week, it is expected to test the previous high of 3430-3440 again.

XAUUSD BULLISH TRADE IDEAChart Patterns Identified:
Cup and Handle Pattern (highlighted in red/pink):
The left half shows a rounding bottom (the “cup”).
The right side forms a descending wedge (the “handle”), typically a bullish continuation pattern.
Falling Wedge (inside the handle):
The price consolidates in a narrowing range, suggesting a potential breakout.
A breakout is projected upward.
Key Levels:
Support: Around $2,955.111
Current Price: $3,327.259
Resistance:
Intermediate: Around $3,500.200
Target (based on breakout projection): $3,733.873
Bullish Scenario:
If the breakout above the falling wedge is confirmed (as suggested by the arrow), the price target is near $3,733, which aligns with the height of the cup projected from the breakout point.
This aligns with classic cup-and-handle theory.
Technical Implication:
The setup is bullish and suggests continuation of the upward trend if volume supports the breakout.
Ideal entry would be on a retest of the breakout above the handle resistance.

XAU/USD) Bullish reversal analysis Read The ChaptianSMC trading point update
Tchnical analysis for XAU/USD (Gold vs US Dollar) on the 4-hour timeframe, using Smart Money Concepts (SMC). Here's a breakdown of the idea behind this analysis:
---
1. Trend & Structure
The previous downtrend was broken with a change of character (ChoCH), suggesting a possible bullish reversal.
After the ChoCH, the market formed bullish order blocks which have been respected, confirming the bullish sentiment.
---
2. Key Levels
Support level: Around 3,220–3,240 region, coinciding with the 200 EMA, which has acted as dynamic support.
Order blocks: Several yellow zones indicate areas of institutional buying interest.
The most recent "new order block" is closer to the current price, showing a potential short-term demand zone.
---
3. Price Projection
The chart suggests a bullish continuation, projecting a move towards:
Target Point 1: Around 3,350–3,349.50
Target Point 2: Around 3,408–3,407.98
These levels are likely based on prior highs or imbalance zones.
---
4. RSI Indicator
RSI is above 65, showing bullish momentum, but nearing overbought territory (>70), which could signal a short-term pullback before continuation.
---
5. Trade Idea (Visualized Path)
A potential small pullback into the "new order block" around 3,280 is expected.
From there, price may rally to the next supply zones or previous highs, offering a potential gain of ~1.44%.
Mr SMC Trading point
---
Summary of the Idea
This is a bullish continuation setup based on:
Trend reversal via ChoCH.
Strong order block formations.
EMA 200 support.
RSI confirmation.
Traders might look to enter near the new order block (around 3,280), targeting 3,350 and then 3,408, while managing risk below the order block support.
Pleas support boost 🚀 analysis follow K

GOLD outlook for the weekIn today’s analysis, I’m expecting price to continue its bullish momentum, partially influenced by recent political developments surrounding Donald Trump. This aligns well with the broader higher time frame trend, where we’ve been favouring long setups.
To capitalise, the most immediate and valid point of interest I’ve marked out is the 9H demand zone — the origin of the most recent break of structure. If price retraces, this is where I’ll be watching for bullish confirmation.
However, if price continues to climb without retracing first, we could see a temporary bearish reaction from the nearby 4H supply zone around the 3,400 level. If this happens, I may look for a short-term countertrend sell setup, but only with strong confirmation. Risk will be kept low and I won’t be overly ambitious with targets.
Confluences for GOLD Buys:
Strong bullish momentum following a clear CHoCH on the higher time frame
Recent break of structure left behind a clean 9H demand zone for potential retracement
Trend remains bullish on both the lower and higher time frames
Liquidity resting above still yet to be swept
DXY is currently bearish, supporting a bullish case for gold
P.S. While we could see a minor sell opportunity down to the demand zone, patience is key.
Waiting for a solid pre-trend setup is part of the process — no need to rush entries.
Have a great trading week and stay sharp!

Buying on pullbacks remains the main theme!Tariff turmoil resurfaces, gold price jumps!
The Trump administration once again wields the tariff stick, threatening to impose a 50% tariff on the EU from June 1, and saying that there has been no progress in the negotiations between the US and the EU. Because the timing of this threat is quite subtle. Just earlier this week, the EU just submitted a new framework proposal to the US to restart bilateral trade negotiations. This directly led to a jump in gold price tonight!
Faced with the tough stance of the US, the EU is not sitting still. It is reported that the EU has formulated a contingency plan. If the negotiations fail, it will impose additional tariffs on US exports worth 95 billion euros in response to Trump's "reciprocal" taxation and 25% tariffs on cars and some parts, which will inevitably cause further impact on the market!
The bulls are in control and are unwilling to give the bears too many opportunities to cover their losses. Therefore, the strategy of following the trend needs to be more active - strong markets usually do not experience a deep retracement, and the correction phase will not break the previous low for the second time. After the current gold price surged to 3365, the intraday bull defense position should be set at 3340. The previous low of 3320 has been effectively supported, and the bulls have taken the absolute initiative, and there will be no short-selling opportunities in the short term. Based on the current strong bullish performance, continuing to maintain a bullish mindset is the core of the transaction.
Operation strategy:
1. Gold recommends going long in the 3340-3330 area, with a target of 3350-3360.
2. Gold recommends going short in the 3365-3375 area, with a target of 3350-3340.
