It’s the right time to shortUS President Trump recently criticized Fed Chairman Powell again, calling him "slow to act" and emphasizing that the Fed should cut interest rates as soon as possible to support the economy. Trump believes that delaying interest rate cuts may lead to the risk of recession in the US economy, but the Fed still takes inflation and employment data as the core of decision-making, and the two sides have obvious differences in policy positions.
At present, the Fed's interest rate cut expectations have been postponed and the magnitude has been reduced. Coupled with the expectation of rising US bond yields, the gold market sentiment has weakened. The world's largest gold ETF recently reduced its holdings by 8.98 tons to 918.73 tons, reflecting the cooling of institutions' short-term bullish enthusiasm for gold. Technically, gold prices continued to weaken after breaking through key support last week, and the weekly closing was negative, suggesting that shorts were dominant; the daily level was constrained by the 20-day moving average, and the volatile downward trend may continue in the short term. Focus on the 3250-3265 line resistance during the day. If it cannot break through, the $3,200 mark below may face a test.
Gold recommendation: short sell when it rebounds to 3245-3252 range. Target 3230-3220.
Goldlong
The current price of gold is 3230, so go short directly!
Gold began to fluctuate in a large range. Don't chase long positions easily at high levels. Gold opened under pressure and fell back at 2350. Then the double top of gold rebounded in 4 hours and continued to fall, and then fluctuated in a large range. The current price of gold is 3230 and it is directly short!
Gold did not form an upward breakthrough in 4 hours, so it is likely to be a volatile market. Since gold is fluctuating, if gold falls below 3200 again, it may weaken further. Then gold will start to fluctuate in a large range in 4 hours. Gold rebounded under pressure and went short first.
The market is changing rapidly, and gold is now experiencing great ups and downs. In the short term, we still need to pay attention to continued highs and falls. Gold should focus on the gains and losses of the 3200 line. If gold does not break 3200 for a long time, then gold may form support, and then gold bulls will have upward momentum.
European trading operation ideas:
Gold short at 3230, stop loss at 3240, target 3200-3180;

Bullish Inflation Data Fuels Gold Rebound — Impulsive Waves!?Gold ( OANDA:XAUUSD ) started to fall from the Resistance zone($3,280-$3,245) as I expected in the previous idea , but 50_SMA(Daily) and Support lines were able to hold Gold .
----------------------------------
Today, key U.S. economic data was released:
Core PPI m/m: -0.4% (vs. 0.3% forecast)
Core Retail Sales m/m: 0.1% (vs. 0.3% expected)
PPI m/m: -0.5% (vs. 0.2% forecast)
Retail Sales m/m: 0.1% (in line)
Unemployment Claims: 229K (as expected)
Outlook :
The weaker-than-expected inflation data, especially the PPI figures, indicate easing inflationary pressures. This may increase expectations for potential Fed rate cuts, which generally supports gold as a non-yielding asset.
Conclusion :
Today’s data is overall bullish for gold. Watch for continued upside if sentiment shifts further toward dovish Fed expectations. However, keep an eye on upcoming Fed commentary for confirmation.
----------------------------------
Gold is moving above the Heavy Support zone($3,200-$3,136) and has managed to break the Resistance lines .
In terms of Elliott Wave theory , Gold seems to have completed the corrective waves , and we can expect the start of an impulsive wave . Breaking the Resistance zone($3,280-$3,245) can be a good sign for the start of an impulsive wave and a gold pump .
I expect Gold to start rising again after a pullback to the Resistance lines(broken) , probably from the Fibonacci Levels inside the chart , and attack the Resistance zone($3,280-$3,245) .
Note: If Gold touches $3,154 , we can expect more dumps.
Gold Analyze ( XAUUSD ), 1-hour time frame.
Be sure to follow the updated ideas.
Do not forget to put a Stop loss for your positions (For every position you want to open).
Please follow your strategy; this is just my idea, and I will gladly see your ideas in this post.
Please do not forget the ✅' like '✅ button 🙏😊 & Share it with your friends; thanks, and Trade safe.

XAU/USD 4H Chart Analysis – Wave 5 Setup in PlayHey traders! Just wanted to share this clean Elliott Wave setup I’m tracking on Gold (XAU/USD).
We’ve just completed what looks like a textbook Wave (4) correction, finding support right at the lower boundary of this long-term ascending channel. Price also respected the 38.2% Fibonacci retracement perfectly, lining up around the $3,090 level. That level is acting as a key demand zone right now.
🌀 According to the wave count:
Wave (3) topped out near $3,500
Wave (4) retraced sharply into the channel base
We are now potentially at the launch point for Wave (5) — the final impulse leg
💹 Wave (5) Projection:
Targeting the upper channel boundary, which aligns closely with $3,740–$3,750
This area also completes the measured move and matches key structural confluence
📈 Technical Confluence Supporting the Bullish Bias:
RSI bounced cleanly from oversold territory
Bullish EMA crossover (20/50) is happening right near the bounce zone
We’re also seeing a break of the corrective trend line, suggesting momentum is shifting back in favor of the bulls
📍 Key Levels to Watch:
$3,149: minor pullback area / possible retest
$3,283: Fib 23.6% resistance — needs to be cleared for confirmation
$3,500: Major resistance & previous high — breakout zone
$3,747: Wave 5 target
⚠️ Invalidation Zone:
If price breaks below $3,090, and especially $3,041, I’ll be reassessing the wave count. That would suggest a deeper Wave 4 or a breakdown in bullish structure.
📌 Conclusion:
I’m watching this setup closely. Gold looks poised for a strong upside leg if current levels hold. The structure is clean, momentum is turning, and we’ve got multiple confirmations in place. I’ll be scaling in with proper risk management and looking to ride this potential Wave 5 to new highs.
Drop your thoughts below — are you long on Gold? Let’s talk setups 👇
@WrightWayInvestments
@WrightWayInvestments
@WrightWayInvestments

Gold price outlook: short term increase📝 NEWS
Gold Prices Rise as Moody’s Downgrades U.S. Credit Rating
- Moody’s downgraded the U.S. credit rating from Aaa to Aa1, citing concerns over high public debt and unsustainable fiscal spending.
- The move boosted demand for safe-haven assets, leading to a weaker U.S. dollar and rising U.S. Treasury yields.
- Spot gold prices rose 0.5% to $3,217.49/oz, while June gold futures gained 1% to $3,220.17/oz.
- Other precious metals also saw modest gains:
- Silver +0.5% to $32.530/oz
- Platinum +0.1% to $991.50/oz
Market Outlook
- In the coming week, the market will closely watch a busy U.S. economic calendar, including:
- Speeches from Federal Reserve officials
- Preliminary PMI data
- Key housing indicators
- These events are expected to influence short-term monetary policy expectations.
Technical View: Gold Poised to Continue Rising
⚠️ Gold is expected to continue its upward trend amid rising trade tensions between the U.S. and China, with little progress in ongoing tariff negotiations.
💡 Short-Term Trade Scenarios:
🚨 SELL XAU : zone 3247-3250
SL: 3255
TP: 50 - 100 - 300pips
🚨 BUY XAU : zone 3188-3191
SL: 3183
TP: 50 - 100 - 300pips

XAUUSDHello traders!
I’m sharing what may be your first trade of the week. This setup comes from the XAUUSD pair. I currently see a Buy opportunity in Gold, and the trade is already active on my side.
🔍 Trade Details:
✔️ Timeframe: 15-Minute
✔️ Risk-to-Reward Ratio: 1:1.50
✔️ Trade Direction: Buy
✔️ Entry Price: 3223.82
✔️ Take Profit: 3237.39
✔️ Stop Loss: 3214.78
🔔 Disclaimer: This is not financial advice. I’m simply sharing a trade I’m personally taking, based on my own methodology. It is intended purely for educational purposes.
📌 If you're interested in a more systematic and data-driven approach to trading:
💡 Follow the page and turn on notifications to stay updated with future trade ideas and market breakdowns.

Gold Urgent Update.Gold Urgent Update
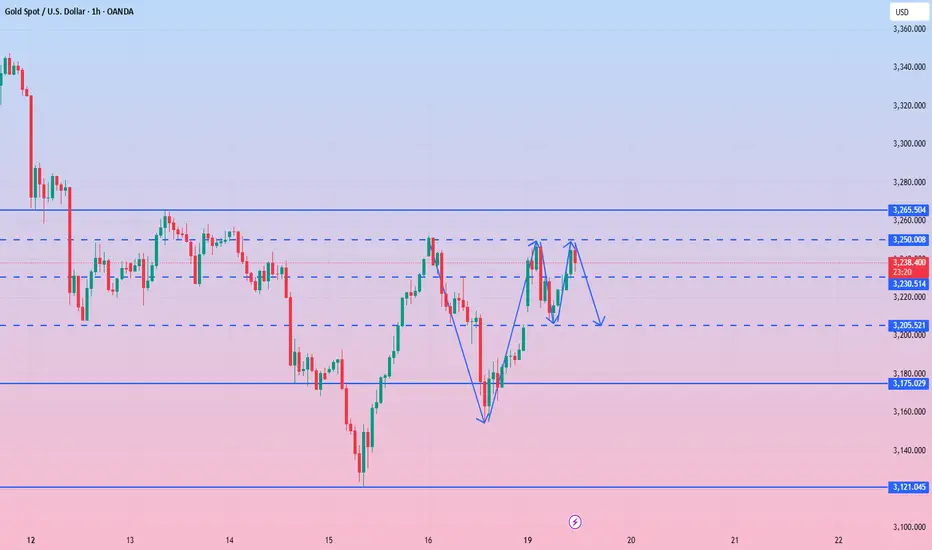
Gold has recently touched its 4-hour bullish Fair Value Gap (FVG) and is now moving upward. Additionally, there is existing liquidity from previous days positioned above the current price level, which further increases the probability of a continued bullish move.
There is a high likelihood that the market could rise towards the price levels of 3250, 3260, and possibly even 3265. These levels should be closely monitored, as they represent potential short-term targets based on the current price action and market structure.
At this stage, it is advised to avoid entering any selling (short) positions unless a clear and confirmed bearish signal is observed. The market sentiment remains decisively bullish, and until any bearish reversal patterns are confirmed, the upward trend should be respected.
Please conduct your own research (DYOR) and practice proper risk management when trading towards the mentioned target levels.

How to layout in the battle between long and short positionsGold surged directly at the opening, which is in line with our analysis expectations. We gave a short position near 3240-45. As expected, gold fell to the 3230 line for profit. There is great pressure from above and limited space above. Up to now, it has been fluctuating near 3220. For gold, we are now focusing on the short-term support of 3200-06. If it breaks through this position, it is very likely to go to the 3175-90 line.
From the current trend analysis, today's support continues to focus on 3170-80, strong support 3150, and upper pressure 3253-60. Relying on this range as a whole, the main tone of high-altitude low-multiple cycle participation remains unchanged. In the middle position, you must watch more and move less, be cautious in chasing orders, and wait patiently for key points to enter the market. I will notify you of the specific operation strategy in time and pay attention to it in time.
Gold operation strategy: short gold rebound near 3240-50, target 3230-3220. Pay attention to the support of 3202 and 3175 below, and go long according to the strength of the decline!

GOLD: Action Level!Gold is actually approaching an interesting action level. We can expect a bounce here, targeting 3310, otherwise i have placed a long limit order in a second support level (3027), with the same target.
This are mid term trades that i expect to hold for few days. My main trades are scalps on 5 minutes timeframe, that can't be posted here.

GOLD Weekly OutlookGood Morning Guys, here we are with XAU again. My previous long trade reached a good amount of profits so i closed it last Friday before market close, and i am now looking for a good re entry. I identified a good bounce level at $3185.00. I placed here a long limit order, that i hope will be triggered before Wednesday. My stoploss is easy here, just below local bottom, targeting $3310.00
XAUUSD GOLD Just Grabbed liquidity Below a key low analysis Full Guide: How to Use COT Data for Trading XAUUSD (Gold)
1. What is COT Data?
The Commitment of Traders (COT) report is a weekly publication by the Commodity Futures Trading Commission (CFTC). It shows the aggregate positioning of different types of traders in the futures markets.
For XAUUSD (Gold), you’ll look at the Gold futures (COMEX) section.
2. Key Trader Categories in COT Report
1. Commercials (Hedgers):
Typically big institutions or producers like mining companies.
They use futures to hedge exposure, not speculate.
Usually short during rallies and long when price is low.
2. Non-Commercials (Large Speculators):
Hedge funds, money managers.
Considered the "smart money." Full Guide: How to Use COT Data for Trading XAUUSD (Gold)
1. What is COT Data?
The Commitment of Traders (COT) report is a weekly publication by the Commodity Futures Trading Commission (CFTC). It shows the aggregate positioning of different types of traders in the futures markets.
For XAUUSD (Gold), you’ll look at the Gold futures (COMEX) section.
---
2. Key Trader Categories in COT Report
1. Commercials (Hedgers):
Typically big institutions or producers like mining companies.
They use futures to hedge exposure, not speculate.
Usually short during rallies and long when price is low.
2. Non-Commercials (Large Speculators):
Hedge funds, money managers.
Considered the "smart money."
Follow trends and often drive major moves.
3. Nonreportables (Retail/Small Traders):
Smaller traders, often contrarian indicators.
Not always consistent with price direction.
---
3. Where to Find COT Data
CFTC Website
Tools like:
Tradingster.com
BarChart.com
COTbase.com
Look for "Legacy" or "Disaggregated" COT reports for Gold - COMEX.
---
4. How to Read the COT Data for Gold
Key Metrics:
Longs/Shorts: Number of contracts held.
Net Positions: Longs minus Shorts.Changes WoW: Increase/decrease in positions compared to the prior week.
Example Insight:
If Non-Commercials are heavily net long, and reaching historical highs, market may be overbought.
If Commercials increase shorts significantly, they may be preparing for a price decline.
A divergence between price action and COT data often signals potential reversal.
---
5. Using COT for Gold Trading (XAUUSD)A. Trend Confirmation
Rising net long positions by non-commercials = bullish confirmation.
Decreasing net long or rising shorts = weakening trend or reversal.
B. Reversal Spotting
Extremes in positioning (e.g., record longs by speculators) often precede reversals.
Look for non-commercials reducing longs while commercials increase shorts—potential top.
C. Liquidity Grabs and COT
If gold grabs liquidity (stop hunts) and COT shows heavy speculative positioning, that could be a smart money trap.
A strong bullish reversal after liquidity grab with increasing net longs confirms a momentum shift.
---
6. How to Combine COT with Technical Analysis
Use COT to validate or question what you see on the chart.
Example Setup:
Chart: Gold drops below key support (liquidity grab).
COT: Non-commercials increase longs that week.
Conclusion: Smart money bought the dip — potential for bullish reversal.
Combine with:
Market structure
Volume
Sentiment tools
Price action (e.g., bullish engulfing, break of structure)
---
7. Limitations and Tips
Lagging Data: COT is released every Friday for data on Tuesday.
Use it for context and macro positioning, not for intraday trades.
Look at weekly or monthly trends, not daily.
Best used alongside price action and other confirmation signals.
---
Conclusion
COT data is a powerful tool for understanding who is behind the move in gold. By tracking the positioning of major players, you can:
Confirm trends
Spot early signs of reversal
Align your trades with institutional momentum

XAU/USD) back up Trand analysis Read The ChaptianSMC Trading point update
Technical analysis for XAU/USD (Gold vs. US Dollar) on the 4-hour timeframe suggests a bullish reversal setup from a key support zone. Here's a breakdown of the idea:
Key Observations:
1. Support Zone (Yellow Box at ~3,100–3,140):
The price recently touched a significant support area marked by multiple previous bounces (green arrows).
The latest green arrow shows a bullish reaction from this zone, indicating potential for an upward move.
2. Resistance Zone (~3,220–3,250):
This intermediate zone is expected to be the first area of interest for bulls.
The analysis suggests a brief pullback or consolidation before continuation.
3. Target Point (~3,375):
The chart outlines a projected move to around 3,375, aligning with a previous supply zone and the upper channel line.
This is likely the main target for a swing trade.
4. EMA 200 (Blue Line - ~3,221):
Price is hovering around the 200 EMA, acting as a dynamic resistance.
A breakout above this would add bullish confirmation.
5. RSI Indicator (~41):
RSI is recovering from an oversold region (~38), indicating potential momentum building for a reversal.
Mr SMC Trading point
---
Conclusion:
This is a bullish reversal setup with:
Entry zone: Around 3,120–3,140
Short-term resistance: ~3,220–3,250
Final target: ~3,375
Invalidation: A clear break and close below the yellow support box (~3,100)
Pales support boost 🚀 analysis follow)

GOLD Has Shown A Significant Bullish Move!!Gold Market Analysis
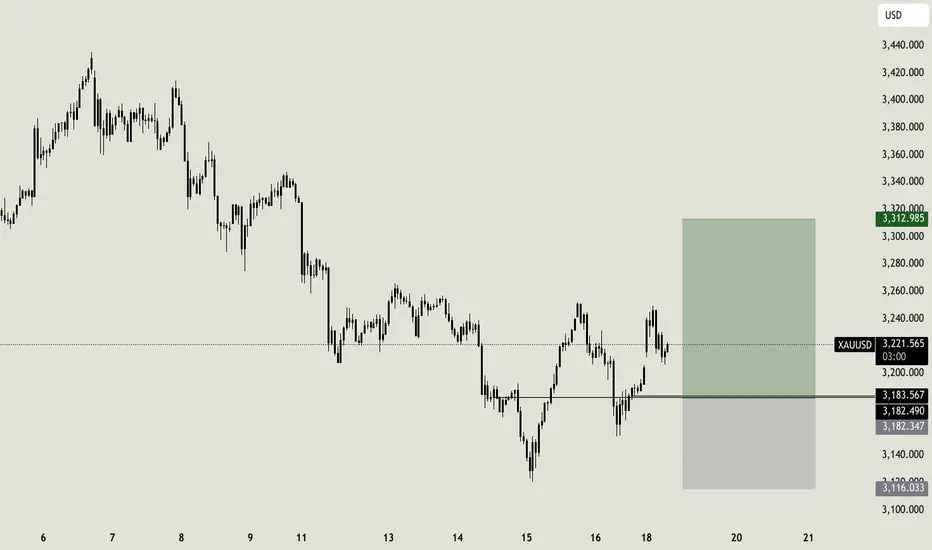
Over the past week, gold has shown a significant bullish move by touching its weekly bullish Fair Value Gap (FVG) and closing a candle above it. This price action serves as a strong indication that the market is currently exhibiting bullish momentum. However, it is important to note that the sustainability of this bullish trend will be confirmed only through future market developments and price behavior.
As of now, our analysis suggests that gold, after revisiting and respecting the weekly bullish FVG, is trending upward. Looking ahead, we anticipate a minor retracement in the short term. This pullback could provide a healthy opportunity for the market to gather momentum before making another move upward. Ideally, we expect the price to retrace slightly and re-enter the highlighted yellow zone. Within this zone, we will be watching for a Market Structure Shift (MSS), which would act as our confirmation signal to consider entering a long position.
Once confirmation is received through MSS or similar price action cues, our strategy would be to target the liquidity zones situated above the current price level. It is also worth mentioning that the market has already cleared liquidity on the sell-side, which further strengthens the bullish case. Based on current technical indications and liquidity structure, there is a high probability that gold could reach as high as $3,250 in the upcoming sessions.
That said, market conditions can evolve rapidly, and it is essential to monitor price action closely. Traders and investors are strongly advised to conduct their own research (DYOR) and await clear confirmations before making any trading decisions. Staying vigilant and informed will be key to capitalizing on potential bullish movements in the gold market.

XAU/USD) bullish trend analysis Read The ChaptianSMC trading point update
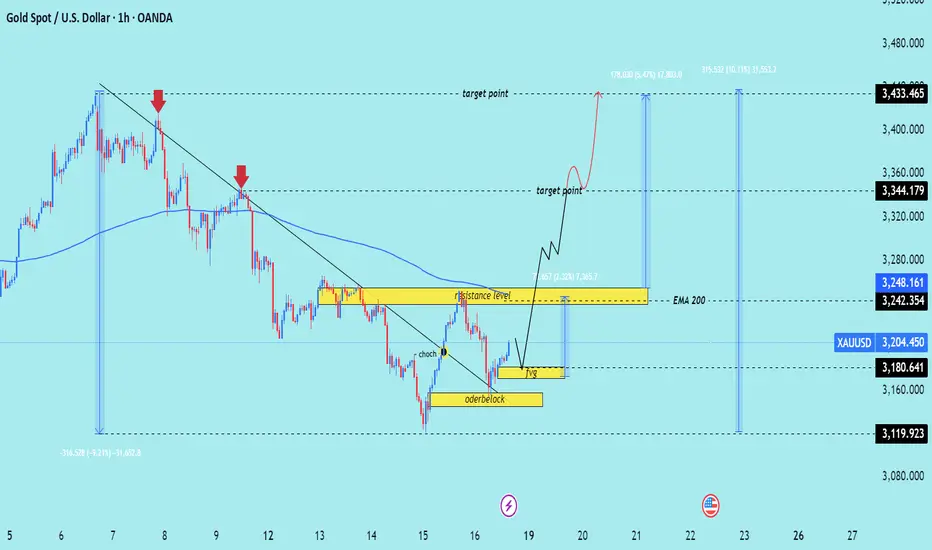
Technical analysis of XAU/USD (Gold Spot price against USD) on a 1-hour timeframe, featuring a Smart Money Concept (SMC) approach. Here's a breakdown of the key ideas presented:
---
1. Downtrend & Trendline Break
The chart initially shows a downtrend with two red arrows marking lower highs.
A trendline is broken, indicating a potential shift in market structure.
CHOCH (Change of Character) is labeled — a key SMC concept signaling a reversal from bearish to bullish structure.
---
2. Orderblock & FVG (Fair Value Gap)
A bullish orderblock is highlighted, indicating an area where institutional buying may have occurred.
A Fair Value Gap (FVG) is shown, which often acts as a magnet for price to fill inefficiencies before continuing in the intended direction.
---
3. Resistance & Target Zones
A resistance level is marked near 3248–3250, which price may revisit and possibly break.
Two target points are identified:
First target: ~3344
Final target: ~3433
---
4. EMA 200
The EMA 200 is acting as dynamic resistance; a break above it adds confluence to the bullish bias.
---
5. Expected Move
The analysis anticipates:
1. A pullback into the FVG or orderblock.
2. A bullish continuation after mitigating those zones.
3. Price aiming for the resistance and eventually the upper targets.
Mr SMC Trading point
---
Conclusion
This is a bullish outlook based on a structural break (CHOCH), institutional demand (orderblock), and gap-filling logic (FVG). The price is expected to pull back slightly and then rally toward the 3344 and 3433 levels if it holds the orderblock zone.
Pales support boost 🚀 analysis follow)
XAUUSD Bearish Setup with Key Entry, Stop Loss & Target LevelsEA GOLD MAN XAUUSD
Entry Point: $3,235.94
Stop Loss: $3,235.94 (above current price, suggesting a SELL trade)
Target Points:
EA Target Point (Downside): $2,974.71 (Short target)
EA Target Point (Upside): $3,505.03 (Long target — likely alternate scenario)
Resistance Level: $3,121.49
Nearby Support Zone: Around $3,000–$2,975
📉 Trade Strategy Implied
This appears to be a short position setup:
Sell at: ~$3,220–$3,235
Stop Loss: $3,235.94
Take Profit: $2,974.71
Risk/Reward Ratio: ~1:3 (very favorable setup if thesis holds)
The upside target ($3,505.03) might be for a different scenario — if price reverses and breaks above resistance.
🧠 Market Structure Observations
Trend: A bearish break from a previous ascending channel.
Momentum: Price has bounced slightly after hitting support, but the moving averages suggest bearish momentum may persist.
Key Risk: If price breaks above $3,236 convincingly, it could invalidate the short setup and trigger a bullish run.
📌 Summary
Bias: Bearish (based on current setup)
Setup: Short with tight stop above resistance
Confirmation Needed: Watch for rejection at the $3,220–$3,236 zone and a breakdown below $3,200 for follow-through.

gold(4H)📌 Gold (XAU/USD) - Key 4H Levels
🔍 Critical Zones:
▫️ Resistance: 3320-3348$
▫️ Support: 3120$
▫️ Trend: Bullish above 3120$
⚡️ Trade Plan:
• Entry: 3120-3200$
• Target: 3320$ | SL: 3120$
• Risk: ≤1% capital
💬 Poll:
"Which scenario is likely?
1) Break 3348$
2) Reject at 3320$
Reply ↓"

Swing analysis on Gold of target achieving storyHow far accuracy goes in your analysis ??
swing analysis in Gold.
Follow for more simple and accurate analysis of INDEX |COMMODITIES| CURRENCY

Gold layout summary and forecast for next week
Before the fishermen went out to sea, they didn't know where the fish were? But they still chose to go because they believed they would return with a full load. When you invest, you don't know whether you can make a profit, but you still need to try. Success is not something that will happen in the future, but from the moment you choose and decide to do it, you will gain something if you insist on believing. The same is true for gold investment. You may still be losing money at the moment, but as long as you find me, all losses will be solved!
Views on the trend of gold next week!
Gold continued its downward trend on Friday. In the morning, there was another long-short wash and returned to the 3200 mark. The daily line closed with a small negative line. Then we have to consider a problem now, that is, whether the daily line will form a continuous decline. In the daily rhythm, we can see that the position of the high point has been declining, which means that after the top resistance level of the three-point line is blocked, it is easy to form a secondary turning point of the trend downward, which means that next week we still have to look at the retracement.
As for the future market direction, the short-term bearish trend will continue to be the theme! On the whole, the gold price rebounded in 4 hours and made a backtest. If the rebound does not break the resistance, it will continue to fall, and the direction of the decline will continue! After the short turning point turned downward from the high point, the current short trend is still extending downward, that is to say, before the short reaches the key node and the long builds a bottom, the rebound is still the main rhythm!
Gold: Enter short orders near 3212 next week, defend 22, and target 3180-60!

GOLD DAILY CHART ROUTE MAP Hey Everyone,
Please see the daily chart update. As shown, the Goldturn channel is still being respected by price action. After a failed breakout attempt above the channel alongside the EMA5, we saw a rejection back toward the channels half line, a level we've identified as a potential support zone.
This support held, resulting in a bounce that aligns with our strategy of buying dips. As long as price continues to hold above this level and the EMA5 remains supportive, we could see a gradual move back toward higher levels. However, if the midline is retested and fails, and the EMA5 crosses below the half line, this could signal a potential move toward the lower boundary of the channel.
This is the beauty of our Goldturn channels, drawn using weighted averages instead of pure price action. This unique approach helps us clearly identify fake-outs and real breakouts, cutting out much of the noise that usually confuses traders.
Moving forward, we’ll focus on smaller timeframes (1H and 4H) to buy dips off the weighted Goldturns, aiming for clean 30–40 pip moves. Ranging markets are perfect for this style, allowing us to capitalize on quick moves without getting caught in the chop of larger swings.
Thank you all again for your continued likes, comments, and follows, we truly appreciate your support!
Mr Gold
GoldViewFX

GOLD WEEKLY CHART MID/LONG TERM ROUTE MAPHey Everyone,
Here’s our weekly chart update. Once again, the Goldturn channel is proving reliable, with price action unfolding as expected. Over the past few weeks, we saw multiple attempts to break above the top of the channel, but each was rejected , confirmed by the EMA5 failing to break through.
Following this, price dropped to as low as 3189 and nearly reached 3094, aligning closely with the channels half line, a key support level we've been monitoring. We caught an early bounce there and capitalized on it using confluence from our lower time frame analysis, also shared with you all, on our 1h and 4h chart ideas.
As long as price holds above the channels half line, we’ll continue to look for bounce opportunities using levels from our smaller time frame setups. However, if price crosses and holds below the half line, it may open the door for a move toward the lower boundary of the channel.
As always, patience and precision are key. We'll continue using the 1H and 4H timeframes to buy dips on retracements into these support zones, targeting clean 20–40 pip moves. These levels and pullbacks offer ideal opportunities, especially in ranging conditions where our Goldturn method truly shines.
This is exactly why we rely on our Goldturn Channels, our proprietary system built on weighted averages. It filters the noise, helps us spot real breakouts vs. fake-outs, and gives us the confidence to act with clarity and discipline.
Thanks again for all the support, your likes, comments and follows.
MR GOLD
GOLDVIEWFX

Gold ended this week successfully!In terms of news, first, the easing of the trade situation weakened the safe-haven property of gold. Secondly, a series of data released this week and the Fed's emphasis on not rushing to cut interest rates also suppressed the gold price. In addition, the parties involved in geopolitical conflicts also began talks. Although there are differences in negotiating positions, they still have to solve the problem when they can sit down and talk. Because of the repeated news, the closing price at the end of the week was also above 3200, so some people still believe that the gold price will go to 3500, and even think that it will exceed this position. I have mentioned this in my previous analysis. The gold price was first stimulated by multiple news and buying rushed up. Now that the risk aversion has receded, I think it is reasonable to see the gold price fall.
Let's analyze it from the technical side: the rhythm of gold has changed rapidly recently, and next Monday is actually the key. The 1-hour moving average of gold has begun to show signs of turning around, so whether it can form a golden cross upwards is the key next time, or it will oscillate a few times and continue to diverge downward. The strength of gold on Monday is very critical. Gold closed with a big positive line on Thursday, which was a very fast trend. However, it fell directly on Tuesday and broke through more than half, so it cannot be said that the bulls are strong. Although it rebounded slightly in the late trading, it still closed with a big negative line. There will be two key positions on Monday next week. Pay attention to 3180 on the bottom of gold. If it falls below 3180 soon after the opening on Monday, then gold will still be weak as a whole. Pay attention to 3215 on the top. If gold breaks through 3215, then gold will be strong as a whole. If gold opens flat on Monday and the upward momentum is not strong, and it is under pressure at 3215, then you can continue to go short in the short term.
TVC:GOLD OANDA:XAUUSD FOREXCOM:XAUUSD

Gold Price Analysis and OutlookOver the past week, the global gold market experienced its steepest correction since last November. Investor sentiment shifted sharply, sending gold prices (XAU/USD) into a freefall and erasing most of the gains accumulated in previous weeks.
📉 Gold Price Movements
- Gold ended the week at around $3,201 per ounce, plunging nearly $122 compared to the previous week — marking the largest weekly drop in six months.
- The decline came as global markets pivoted toward riskier assets following a trade agreement between the U.S. and China, which brought renewed optimism to investors.
- The easing of geopolitical tensions, along with expectations that interest rates will remain steady or rise slightly, led to a waning demand for gold as a traditional safe-haven asset.
🔮 Outlook: Temporary Correction or Start of a Bearish Trend?
- Despite the sharp decline, many experts believe this may only be a technical correction, driven by profit-taking after a strong upward rally in recent weeks.
- Factors such as persistent inflation, rising global debt, and underlying macroeconomic uncertainties continue to support gold’s role as a hedge in investment portfolios.
- In the short term, the gold market will remain sensitive to policy signals from the U.S. Federal Reserve and volatility in the bond market.
🧭 Conclusion
Gold has just endured its worst week in half a year, but that doesn’t necessarily signal the end of its long-term bullish trend. For cautious, long-term investors, the current correction phase could present a valuable opportunity to reposition portfolios at more attractive price levels.

XAUUSD - expected move I am looking teh metal further upside .. Major structure is bullish howver we have seen teh ups and down in minor structure. .. lets see next week
