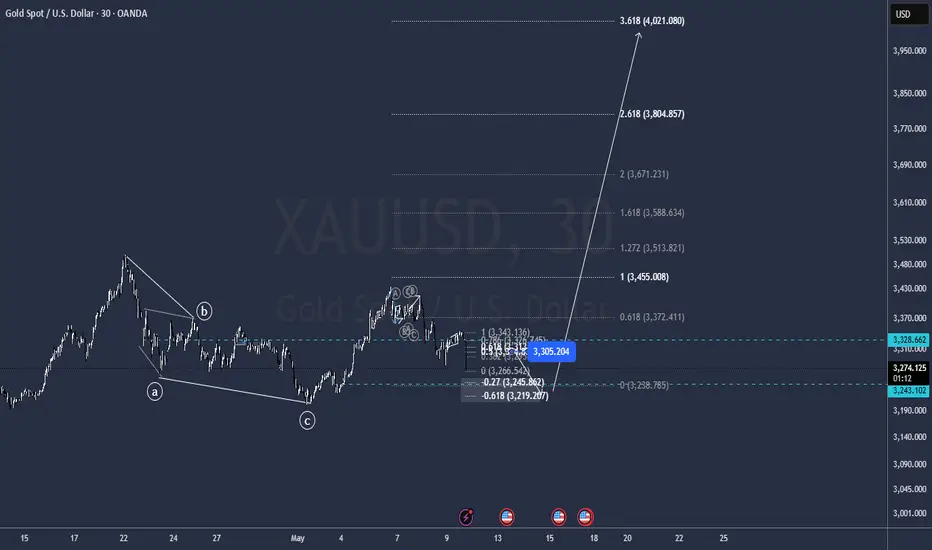
GOLD 4.000Ok then big GAP Thankfully I do never keep open Gold positions on weekends
This is what I can see
sell from 3305 to 3245
buy from 3245 to 4.000
GG
Goldlong
The market is full of crises next week!📌Fundamentals:
This weekend, China and the United States held two days of negotiations as scheduled. It seems that there are many topics to discuss and the scope is wide, but they are still trying to reach a consensus. Otherwise, there is no need to spend two days of intensive talks. Some people think that after so long, there is no conclusion, which is bad news. I think the opposite. At this time, no bad news means good news. Based on the current "marathon" negotiation time, we need to be vigilant about the expected difference in the results of this round of negotiations. The second is the India-Pakistan conflict. After the talks led by the United States, India and Pakistan have agreed to a comprehensive and immediate ceasefire. Judging from this line alone, there will definitely be no risk of risk aversion rising when the market opens on Monday. The only thing is that the results of this round of negotiations between China and the United States are quite important, and there will definitely be results before the opening of Monday.
📊Technological aspects:
Even if the current round of China-US negotiations achieves an optimistic result, gold cannot fall below 3300. If it falls below 3300 and hits the low point below 3275 again, then the next step for gold is very likely to touch the high point of 3160-50 where the trade war started. On the contrary, if gold can hold 3300, then it is very likely to move like the previous wave, break the range, stand above 3360-70, then gold will continue to return to above 3400. Therefore, the most critical position for the opening of next week is the support position of 3300 below and the suppression position of 3360-70 above. If it breaks, the trend will almost move in that direction.

Is GOLD still rising star? XAUUSD AnalysisHello everyone!
i Want share my idea about gold price action.
End of April we had some correction but beginning of May it still has buyer and why? at global market we see still misunderstanding, America and China still talk about rates, final talk will be soon between that to giant country, Russia-Ukraine war plus we have very hard situation between India and Pakistan, everyone was expecting peace, after trump inauguration, but how we see we are still far, no one knows what will be next and for big investors gold is safest place to invest money. If we look at gold for long term we can see it has pretty strong bull run.
For me i have other view - China and America will deal about rates, which will give market better view, i think before it will happen, Gold will test new High, where it will find sellers and from there we will have 2 quarter Bearish trend. New high will be between 3500 - 3550, also if we look at Dollar index (DXY) at 1D chart it found buyers and slowly showing reversal, but don't forget 1W chart because there we had 1W consolidation from 2023 and the last fall was stronger than other falls, at technical it tested weekly Fair Value Gap, but i cant see any reason yet for fall.
I think Gold will show us new high which will be between 3500 - 3550 and then we will get bearish trend and we will see correlation with dollar and dollar will start bullish trend.
With technical i will use simple technic, gold tested today daily fair value gap and it got strong reaction, we have resistance + 2h FVG but for me it will be not hard for gold to brake it.
This analysis is from my experience, i am not financial advisor.
FOR COLLABORATION TEXT ME !
ALWAYS MAKE YOUR OWN RESEARCH !

Gold May be in Bullish Direction from a Support LevelHello Traders
In This Chart GOLD HOURLY Forex Forecast By FOREX PLANET
today Gold analysis 👆
🟢This Chart includes_ (GOLD market update)
🟢What is The Next Opportunity on GOLD Market
🟢how to Enter to the Valid Entry With Assurance Profit
This CHART is For Trader's that Want to Improve Their Technical Analysis Skills and Their Trading By Understanding How To Analyze The Market Using Multiple Timeframes and Understanding The Bigger Picture on the Charts

Gold: Potential Bullish Reversal Setup on XAU/USD from QML ZoneHello guys!
What I see:
QML in Lower Time Frame:
Price is currently testing a QML zone from a lower timeframe (marked in light blue).
This area aligns with a significant reaction point, suggesting institutional interest.
QML in Higher Time Frame:
Below this lies a higher timeframe QML, acting as a secondary support.
This adds confluence for a potential strong bullish rejection if the price dips further.
Engulfed Level:
A previously engulfed resistance level has been marked, showing where sellers lost control.
Price returning toward this area with reduced momentum indicates possible accumulation.
Targets Identified:
Multiple target levels are projected with an ascending structure.
These align with liquidity pools above recent highs, suggesting buy-side liquidity engineering.
Market Structure:
Current price behavior suggests the formation of higher lows and potential bullish continuation.
A corrective move into the QML zone could spark a strong impulsive leg upward.

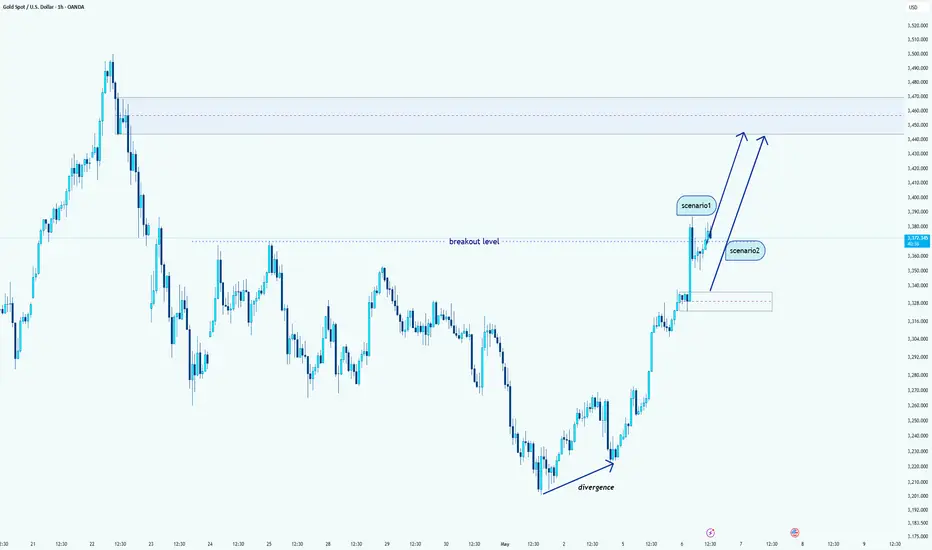
Gold (XAU/USD) Breakout Confirmed – Bulls Eye Higher TargetHello guys!
Gold has successfully broken above the key resistance level marked as the breakout level, confirming bullish momentum. This breakout follows a clear bullish divergence, indicating a reversal from the recent downtrend. The strong upward movement suggests increased buyer interest and continuation potential.
Two bullish scenarios are in play:
Scenario 1: Price continues upward from the current breakout zone without a retest, targeting the next resistance area around $3,440–$3,470.
Scenario 2: A pullback to the breakout level or the demand zone near $3,325–$3,340, followed by a bullish continuation.
What I see:
✅ Bullish divergence identified at the recent low
✅ Breakout from a significant resistance level
📈 Momentum favors continued upside
Gold Eyes Upside Break – Bullish Outlook for Swing TradersGold (XAUUSD) continues to show strength on the 4-hour chart, maintaining its bullish structure and offering a compelling opportunity for swing traders. The market has recently rejected a key support zone, confirming buyer interest and momentum continuation.
Key Technical Observations
Support Zone Rejection: Price strongly rejected the $3,199–$3,265 support zone, forming a clear bullish response. This zone also coincides with the rising trendline, adding strength to the support.
Trendline Confirmation: The dotted green ascending trendline has been respected multiple times, reinforcing the ongoing uptrend.
Consolidation Breakout: After consolidating for nearly 3 days, price broke above the range, confirming bullish intent.
All-Time High Target: The next major resistance lies near the all-time high at $3,504, which acts as the primary upside target.
Trade Setup
Entry Level: $3,338 (after breakout from consolidation)
Take Profit (TP): $3,504
Stop Loss (SL): $3,265
Risk-Reward Ratio: Approximately 2.28
Gold is clearly bullish on the 4-hour timeframe. The trendline bounce, support zone defense, and breakout from consolidation provide a solid basis for swing traders aiming to capture a move toward the all-time high. As long as price remains above the $3,265 level, bullish positions remain valid.

GOLD ROUTE MAP UPDATEHey Everyone,
Great finish to the week with our chart idea playing out, as analysed.
After completing our Bullish targets 3282, 3343 and 3404 yesterday; we stated that no further cross and lock above 3404 confirmed the rejection and that price will find support at lower Goldturns for the bounces.
- This played out perfectly inline with our plans to buy dips. Price found support at 3282 Goldturn and gave the weighted bounce just like we analysed.
BULLISH TARGET
3282 - DONE
EMA5 CROSS AND LOCK ABOVE 3282 WILL OPEN THE FOLLOWING BULLISH TARGET
3343 - DONE
EMA5 CROSS AND LOCK ABOVE 3343 WILL OPEN THE FOLLOWING BULLISH TARGET
3404 - DONE
We will now come back Sunday with our updated Multi time-frame analysis, Gold route map and trading plans for the week ahead.
Have a smashing weekend!! And once again, thank you all for your likes, comments and follows, we really appreciate it!
Mr Gold
GoldViewFX

Gold long and short repeated operation
📌 Negative driving factors
Gold prices fell below $3,320/ounce on Thursday as the US-UK trade agreement improved risk appetite. Gold fell nearly 4% in two days as the US-UK agreement boosted risk appetite and demand for the US dollar.
📊Comment analysis
Gold fell directly at the opening of the Asian session today, and did not provide a good position for short selling. However, it rebounded and rose later, regaining its footing at 3,330. The short-term price fluctuated between long and short.
💰Strategy Package
🔥Sell Gold Zone: 3351-3353 SL 3358
TP1: $3340
TP2: $3330
TP3: $3320
🔥Buy Gold Zone: $3232 - $3234 SL $3227
TP1: $3245
TP2: $3260
TP3: $3270
⭐️ Note: Labaron hopes that traders can properly manage their funds
- Choose the number of lots that matches your funds
- Profit is 4-7% of the capital account
- Stop loss is 1-3% of the capital account

Gold XAUUSD Possible Move 9th May 2025🟨 XAUUSD (Gold) Analysis – 09 May 2025
Market Structure Overview:
The market was previously in a bearish trend, forming consecutive Lower Lows (LL) and Lower Highs (LH).
A bullish shift in structure occurred when price formed a Higher Low (HL) followed by a Higher High (HH), breaking and closing above the previous Lower High.
This break of structure signals a potential trend reversal or deeper pullback in progress.
Key Levels:
Support Zone (Demand): Around 3,315 – 3,325 (recent breakout zone and potential retest area).
Resistance Zone (Supply): Around 3,365 – 3,375 (previous structural HH + liquidity pool).
Expectations:
If price sustains above the 3,315–3,325 support zone, we expect a continuation to the upside targeting the 3,365–3,375 supply zone.
If price fails to hold above support, a rejection and continuation to the downside toward 3,280 is likely.
🔔 Trading Signal (Setup Idea):
Type: Buy (Conditional)
Entry:
Buy on confirmation from support (e.g., bullish engulfing, FVG, or sweep + bullish structure) around 3,320–3,325.
Stop Loss:
Below the swing low or invalidation level: 3,310
Take Profit:
TP1: 3,340 (minor resistance)
TP2: 3,365–3,375 (major supply zone)
Risk/Reward: Minimum 1:2 RRR
Confirmation Tips:
Look for bullish price action at the support zone (e.g., bullish pin bar, demand FVG, CHoCH).
Use volume, OBV, or momentum divergence for additional confirmation.
Show support by following, comment and sharing.

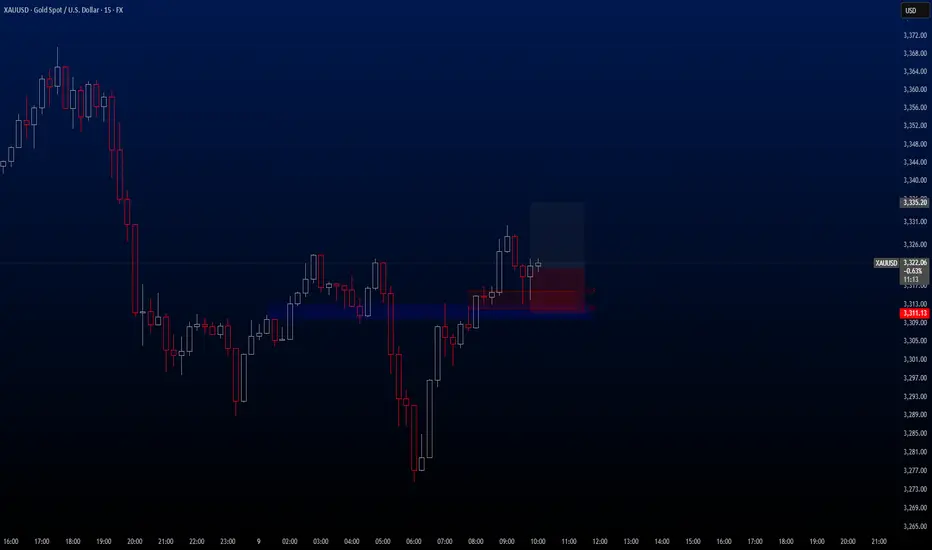
XAUUSDHello traders!
There's a buy opportunity on the XAUUSD pair, and I wanted to share this trade with you. The trade is currently active on my end, and I’ve set the Risk-to-Reward Ratio to 1:1.50.
🔍 Criteria:
✔️ Timeframe: 15M
✔️ Risk-to-Reward Ratio: 1:1.50
✔️ Trade Direction: Buy
✔️ Entry Price: 3320.74
✔️ Take Profit: 3335.20
✔️ Stop Loss: 3311.13
🔔 Disclaimer: This is not financial advice. It's a trade I’m taking based on my own system, shared purely for educational purposes.
📌 If you're also interested in systematic and data-driven trading strategies:
💡 Don’t forget to follow the page and subscribe to stay updated on future analyses.
Gold Rebounds Amid Geopolitical TensionsOANDA:XAUUSD Gold (XAU/USD) bounced back to $3,330 amid escalating global tensions, including renewed conflicts on the Russia-Ukraine front and flare-ups along the India-Pakistan border. Safe-haven demand supported the rebound, but the upside may be limited as markets watch US-China trade talks and digest the limited US-UK trade deal. Technically, gold remains in a corrective phase below the $3,365 resistance zone. A clean break above this level could trigger a retest of the $3,413 supply zone. Otherwise, bears may drag it back toward $3,289 and $3,239 support. Traders watch closely for clarity from today’s FOMC speakers.
Resistance : $3,330 , $3,364 , $3,413
Support : $3,289 , $3,239

The buy low and long strategy is coming!From the 4-hour analysis, the support below is around 3308-3300. If it does not break, the main bullish trend will remain unchanged. The upper side pays attention to the short-term suppression of 3360-66. The daily level stabilizes above this position and continues to maintain the low-multiple rhythm.
Gold operation strategy:
1. If gold falls back on the 3325-3320 line, go long, and if it falls back on the 3310-3300 line, it will cover long positions. The target is 3355-3360.

Gold Potential Bullish ContinuationAfter a considerable retracement, Gold price still seems to exhibit signs of overall Bullish momentum as the price action may form a credible Higher Low with multiple confluences through key Fibonacci and Support levels which presents us with a potential long opportunity.
Trade Plan:
Entry : CMP 3220
Stop Loss : 2946
TP 0.9 - 1 : 3490

Gold prices are plummeting, is a bear market coming?🗞News side:
1. China and the United States hold talks on trade issues
2. India-Pakistan conflict escalates again
3. Geopolitical risks
📈Technical aspects:
Today, gold surged to the 3410 line and then ushered in a sharp fall, with the lowest touching near the 3322 line. We also seized the opportunity to notify our VIPs to enter the market, and all VIP members made good gains. At present, gold is still following the news, and the fundamental influencing factors are relatively complicated. Retail investors who trade alone can easily get caught up in the recent gold fluctuations. The gold price fluctuated repeatedly around 3340. The European session focused on the conversion suppression of the 3350-3360 support area. The 4H Bollinger Bands showed a closing shape. If the gold price cannot stand above 3350, then the bulls need to be repaired in the short term before they can continue to rise. The European session focused on the 3350-3360 resistance above and the 3310-3300 support below.
If you agree with this view, or have a better idea, please leave a message in the comment area. I look forward to hearing different voices.
OANDA:XAUUSD FX:XAUUSD FXOPEN:XAUUSD FOREXCOM:XAUUSD TVC:GOLD

GOLD Analysis - Can buyers push toward 3,410$?OANDA:XAUUSD is trading within a clear ascending channel, with price action consistently respecting both the upper and lower boundaries. The recent bullish momentum indicates that buyers are in control, suggesting there's chances for potential continuation on the upside.
The price has recently broken above a key resistance zone and now came back for a retest. If this level holds as support, it would reinforce the bullish structure and increase the likelihood of a move toward the 3,410 target, which aligns with the channel’s upper boundary.
As long as the price remains above this support zone, the bullish outlook stays intact. However, a failure to hold above this level could invalidate the bullish scenario and increase the likelihood of a deeper pullback.
Remember, always confirm your setups and use proper risk management.

XAU/USD - Fed warns of Economic UncertaintyThe XAU/USD pair on the M30 timeframe presents a Potential Buying Opportunity due to a recent Formation of a Bullish Flag Pattern. This suggests a shift in momentum towards the upside and a higher likelihood of further advances in the coming hours.
Possible Long Trade:
Entry: Consider Entering A Long Position around Trendline Of The Pattern.
Target Levels:
1st Resistance – 3473
2nd Resistance – 3519
🎁 Please hit the like button and
🎁 Leave a comment to support for My Post !
Your likes and comments are incredibly motivating and will encourage me to share more analysis with you.
Best Regards, KABHI_TA_TRADING
Thank you.

With the Federal Reserve on hold, gold is ushering in a new engi
At 2 pm yesterday, the Federal Reserve announced that it would keep the benchmark interest rate unchanged at 4.25%-4.50%, in line with market expectations, and remained unchanged for the third consecutive meeting. After the announcement of the Fed's interest rate decision, the market continued to believe that the Fed would cut interest rates before July, and still expected three rate cuts this year.
Then Fed Chairman Powell downplayed any impression that the central bank would use interest rate cuts to ease the economic weakness caused by Trump's tariff policy at a press conference in the early morning.
Powell used the word "wait" 22 times to emphasize that the Fed is not in a hurry. He said: "We think the cost of waiting is quite low, so we are doing it."
Powell said: "In this case, we can't take the initiative because we don't actually know what the correct response to the data is until we see more data."
Powell hinted that the Fed will only cut interest rates after seeing evidence of a significant slowdown in the economy, and it may cut interest rates soon.
Returning to the market, first of all, from the gold daily chart, it can be seen that the current trend of gold is basically similar to that of the first half of the month.
There was a sharp retracement last week, and then the bottom daily line closed with a cross star, followed by a sharp rebound.
The current market is basically copying the previous market. If nothing unexpected happens, if it goes up in this trend, 3500 is very likely not the high point, and it is only a matter of time before a new high is reached.
In addition, from the 4-hour chart, yesterday, the bottom 3360 was tested many times, but it failed to break down. Today, the opening was stretched from 3360 to above 3400.
3360 is a intensive trading area suppression position in the early stage. After breaking through 3360 on Tuesday, it has not fallen below this position so far.
So, we can currently regard 3360 as an important support position.
So we can regard 3360 as the 618 support position, so as to infer the high point position.
As you can see in the picture, I have also marked the point, which is about 3450-60.
Finally, let's look at the hourly chart. You can see that from 3360 to the morning high of 3415, the Fibonacci position 50% position and 382 position are about 3390-85.
It is also about the lowest position of the callback.
In terms of future operations, you can basically rely on 3390-85 to enter the market and do more.
The upper target can basically see the 3440-60 range.

The Fed’s interest rate decision makes a grand debut
After gold quickly rose and fell today, gold basically began to fluctuate sideways. Of course, this is also to welcome the heavy data of the Federal Reserve's interest rate decision; gold is likely to fluctuate like this before the data, so where will the Federal Reserve's interest rate decision go? And how to lay it out?
Judging from the recent market and data, there is a high probability that gold will keep interest rates unchanged, so gold as a whole will still maintain a volatile upward trend. The gold 1-hour moving average is still a bullish arrangement with a golden cross upward. The strength of the gold bulls is still there, and gold will continue to make more dips. Gold 3350 is still an important turning point for gold's long-short transition. After the gold Fed interest rate decision, then we will continue to go long on dips above 3350. After the Federal Reserve's interest rate decision, gold will continue to buy on dips above 3350.
Gold's short-term trend is still a bullish arrangement. Gold will continue to buy on dips without breaking 3350. If the gold data unexpectedly falls below 3350, then re-arrange it at that time.
Operational ideas:
Gold more than 3350, stop loss 3340, target 3400-3420;

Gold range shock , Both long and short have a chance!📌Fundamentals:
1. There are signs of escalation in the India-Pakistan conflict
2. The US-Houthi ceasefire agreement
3. The Fed's interest rate decision dominates this week's market
4. The international trade situation disturbs market sentiment
5. Market sentiment and capital flows
📊Technical aspects:
The market came out in the Asian session. It stalled again later. We are used to seeing fluctuations of hundreds of points. A fluctuation of more than ten or twenty points a day is the same as no fluctuation. At present, the market is temporarily maintained in the range of 3400-3360, and there is not much fluctuation. At present, let's see where the market breaks through. If it retreats to around 3360, follow up with long orders. If it rebounds to around 3400, follow up with short orders.

XAUUSD: Price Mitigated Earlier, We Got Left Behind! Hey Everyone
Happy Friday
So, yesterday, we were expecting gold prices to dip down to around 3172. But guess what? It didn’t quite go as planned! The price took a nosedive from 3208 and is currently sitting at 3260, almost 520 pips move.
It’s not always going to be a smooth ride, so let’s not get discouraged. We can focus on analysing this chart and keeping an eye on the price as it moves.
Once the trade is activated, there are two targets you can set. You can choose your own take-profit based on your analysis and trade management.
Good luck and trade safely! 😊
Thanks a bunch for your unwavering support! ❤️🚀
If you’re feeling generous, here are a few ways you can help us out:
- Like our ideas
- Comment on our ideas
- Share our ideas
Cheers,
Team Setupsfx_
❤️🚀

XUA/USD) bullish trend analysis Read The ChaptianSMC Trading point update
Technical analysis chart for Gold Spot (XAUUSD) on the 4-hour timeframe. Here's a breakdown of the key ideas behind the analysis:
1. Trend and Structure:
The overall trend shows a bullish move followed by a correction and now a potential continuation upward.
A bullish breakout from a descending trendline suggests a shift in momentum from bearish to bullish.
2. Key Zones:
Order Block / Buying Zone (~3,280-3,310): A demand area where price is expected to find support and potentially bounce higher.
Support Level (~3,320-3,360): Price is currently above this level, suggesting buyers are in control.
Resistance Level (~3,440-3,495): Marked as a potential short-term ceiling; a breakout above this level may signal strong bullish continuation.
Target Point (~3,494): This is the projected take-profit level for a bullish move.
3. RSI Indicator:
RSI is around 63–64, close to overbought territory but not yet extreme. This suggests moderate bullish momentum without signs of immediate reversal.
4. Projected Move:
The chart outlines a possible retracement to the support or order block zone, followed by a bounce and a push toward the resistance level and target.
Mr SMC Trading point
Strategy Implication:
Buy on pullback to the support or order block zone.
Stop-loss could be placed below the order block (~3,280).
Take-profit around the target zone (~3,494).
pales support boost 🚀 analysis follow)
